. 2019 Sep 26;9(19):11448-11463.
doi: 10.1002/ece3.5646. eCollection 2019 Oct.

Exploring a Pool-seq-only approach for gaining population genomic insights in nonmodel species

Affiliations

Exploring a Pool-seq-only approach for gaining population genomic insights in nonmodel species

Sara Kurland et al. Ecol Evol. .

Abstract

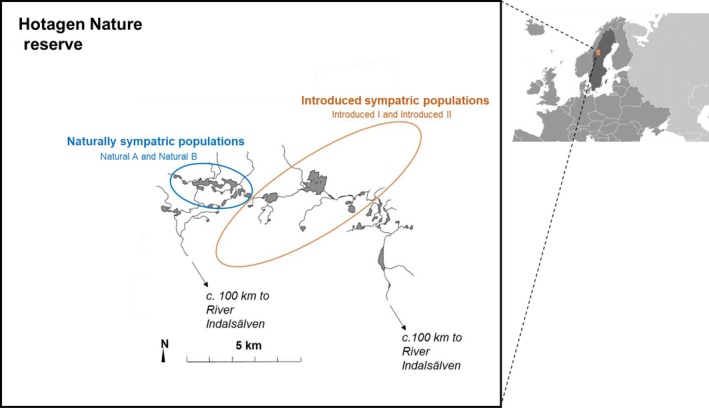
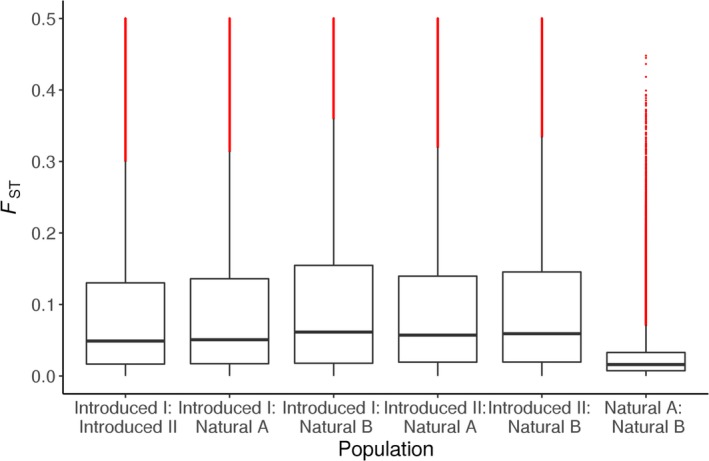
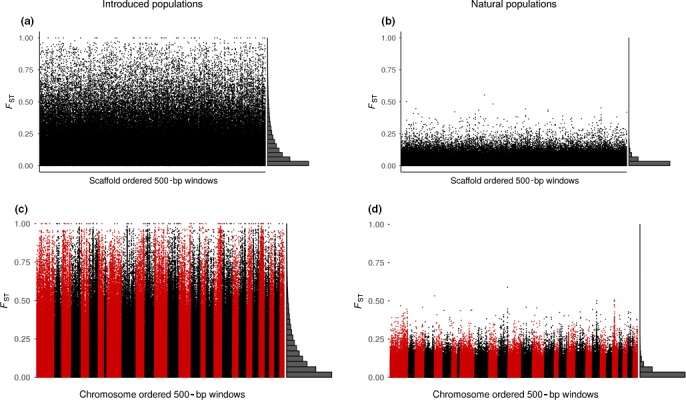
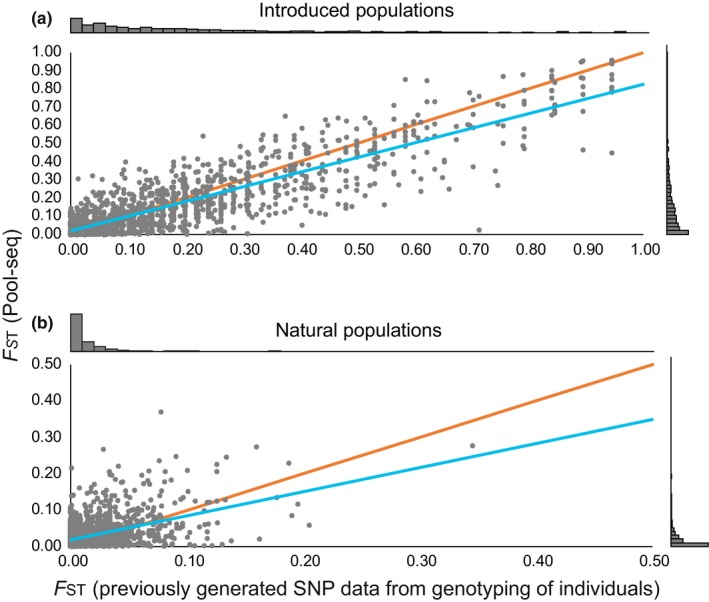
Developing genomic insights is challenging in nonmodel species for which resources are often scarce and prohibitively costly. Here, we explore the potential of a recently established approach using Pool-seq data to generate a de novo genome assembly for mining exons, upon which Pool-seq data are used to estimate population divergence and diversity. We do this for two pairs of sympatric populations of brown trout (Salmo trutta): one naturally sympatric set of populations and another pair of populations introduced to a common environment. We validate our approach by comparing the results to those from markers previously used to describe the populations (allozymes and individual-based single nucleotide polymorphisms [SNPs]) and from mapping the Pool-seq data to a reference genome of the closely related Atlantic salmon (Salmo salar). We find that genomic differentiation (F ST) between the two introduced populations exceeds that of the naturally sympatric populations (F ST = 0.13 and 0.03 between the introduced and the naturally sympatric populations, respectively), in concordance with estimates from the previously used SNPs. The same level of population divergence is found for the two genome assemblies, but estimates of average nucleotide diversity differ ( π ¯ ≈ 0.002 and π ¯ ≈ 0.001 when mapping to S. trutta and S. salar, respectively), although the relationships between population values are largely consistent. This discrepancy might be attributed to biases when mapping to a haploid condensed assembly made of highly fragmented read data compared to using a high-quality reference assembly from a divergent species. We conclude that the Pool-seq-only approach can be suitable for detecting and quantifying genome-wide population differentiation, and for comparing genomic diversity in populations of nonmodel species where reference genomes are lacking.

Keywords: Salmo trutta; genetic diversity; genome sequencing; population genomics; salmonid; single nucleotide polymorphism.


Conflict of interest statement

None declared.

Figures

Figure 1
Figure 1
The brown trout (Salmo trutta) from Swedish mountain lakes was used as a case study to explore the potential of a recently presented Pool‐seq‐only approach for gaining genomic insights in nonmodel species. Photograph by Anastasia Andersson
Figure 2
Figure 2
Map of study sites located in Hotagen Nature Reserve, Sweden. Circles indicate sampled lakes inhabited by introduced and naturally sympatric populations, respectively. Both waters are connected to the River Indalsälven which drains into the Baltic Sea c. 400 km from the study site
Figure 3
Figure 3
Boxplot of F ST values within 500‐bp windows along the S. trutta assembly for all pairwise comparisons between population pools. The horizontal line at the center of the box is median F ST, and the top and bottom of the box show 25th and 75th percentiles, respectively. Vertical black lines show the boundaries of the interquartile range and red markings show outliers
Figure 4
Figure 4
Pairwise F ST values within 500‐bp windows along the (a, b) S. trutta and (c, d) S. salar assemblies for (a, c) introduced and (b, d) naturally sympatric populations. Histograms in the margins represent frequency distributions of F ST values
Figure 5
Figure 5
F ST values from Pool‐seq analyses (y‐axes) compared to those from previous individual SNP genotyping of the same SNP loci (x‐axes; data from Andersson, Jansson, et al., 2017 and L. Laikre & N. Ryman, unpublished data). Nei's F ST computed as F ST = 1−H S/H T was used for the previous SNP data, while for Pool‐seq, Nei's F ST was computed using POPOOLATION v. 1.2.2. (a) Pairwise F ST for 1,415 SNP loci for the introduced population (linear regression coefficient b = 0.81, 2= 0.76, = 68, < 0.001). (b) Pairwise F ST for 1,378 SNP loci for the naturally sympatric populations (linear regression coefficient b = 0.66, r 2 = 0.21, t = 19, p < 0.001). The blue lines are linear regression trend lines, and the orange ones represent expected values with r= 1. Histograms in the margins represent frequency distributions of F ST values
Figure 6
Figure 6
Comparison of frequency of most common alleles of individual SNP loci estimated using Pool‐seq data (y‐axes) versus previously genotyped individuals (x‐axes). (a) Frequency of the most common allele at each of 1,415 individual SNP loci for the introduced population I (linear regression coefficient b = 0.85, r 2 = 0.71, = 60, < 0.001), and (b) introduced population II (linear regression coefficient b = 0.84, r 2  = 0.76, = 66, < 0.001). (c) Frequency of the most common allele for each of the 1,378 individual SNP loci for the naturally sympatric populations A (linear regression coefficient b = 0.88, r 2  = 0.73, = 60, < 0.001) and (d) B (linear coefficient b = 0.88, r 2  = 0.74, = 63, < 0.001). Blue lines are linear regression lines, and orange lines represent expected values. The number of individuals was = 50 for each of the pools and = 18 for previous data from individual genotyping of the SNP loci for each of the introduced populations, and = 30 for each of the naturally sympatric populations. Historgrams in the margins represent distributions of allele frequencies

References

    1. Albrechtsen, A. , Nielsen, F. C. , & Nielsen, R. (2010). Ascertainment biases in SNP chips affect measures of population divergence. Molecular Biology and Evolution, 27, 2534–2547. 10.1093/molbev/msq148 - DOI - PMC - PubMed
    1. Allendorf, F. W. , & Hard, J. J. (2009). Human‐induced evolution caused by unnatural selection through harvest of wild animals. Proceedings of the National Academy of Sciences of the United States of America, 106, 9987–9994. 10.1073/pnas.0901069106 - DOI - PMC - PubMed
    1. Allendorf, F. W. , & Ryman, N. (2002). The role of genetics in population viability analysis In Beissinger S. R. & McCullough D. R. (Eds.), Population viability analysis (pp. 50–85). Chicago, IL: University of Chicago Press.
    1. Anand, S. , Mangano, E. , Barizzone, N. , Bordoni, R. , Sorosina, M. , Clarelli, F. , & De Bellis, G. (2016). Next generation sequencing of pooled samples: Guideline for variants' filtering. Scientific Reports, 6, 33735 10.1038/srep33735 - DOI - PMC - PubMed
    1. Andersson, A. , Jansson, E. , Wennerström, L. , Chiriboga, F. , Arnyasi, M. , Kent, M. P. , & Laikre, L. (2017). Complex genetic diversity patterns of cryptic, sympatric brown trout (Salmo trutta) populations in tiny mountain lakes. Conservation Genetics, 18, 1213–1227. 10.1007/s10592-017-0972-4 - DOI