Comparative Study
. 2019 Sep 20;7(1):e000717.
doi: 10.1136/bmjdrc-2019-000717. eCollection 2019.

Effects of metformin, acarbose, and sitagliptin monotherapy on gut microbiota in Zucker diabetic fatty rats

Affiliations
Comparative Study

Effects of metformin, acarbose, and sitagliptin monotherapy on gut microbiota in Zucker diabetic fatty rats

Minchun Zhang et al. BMJ Open Diabetes Res Care. .

Abstract

Objective: Recent studies have demonstrated that gut microbiota was closely related to metabolic disorders such as type 2 diabetes. Oral antidiabetic medications including metformin, acarbose and sitagliptin lowered blood glucose levels via acting on the gastrointestinal tract. The aim of the study was to observe the comparisons among those medications on gut microbiota composition.

Research design and methods: Zucker diabetic fatty rats (n=32) were randomly divided into four groups, and had respectively gastric administration of normal saline (control), metformin (215.15 mg/kg/day), acarbose (32.27 mg/kg/day), or sitagliptin (10.76 mg/kg/day) for 4 weeks. Blood glucose levels were measured during an intragastric starch tolerance test after the treatments. 16S rRNA gene sequencing was used to access the microbiota in the fecal samples.

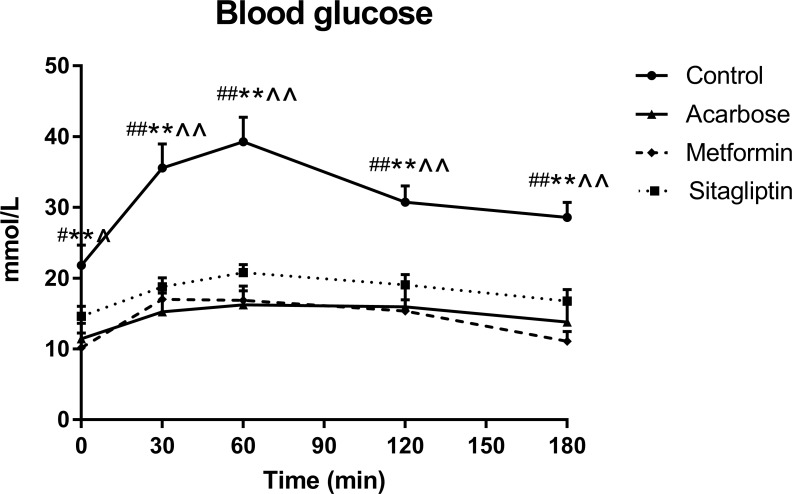
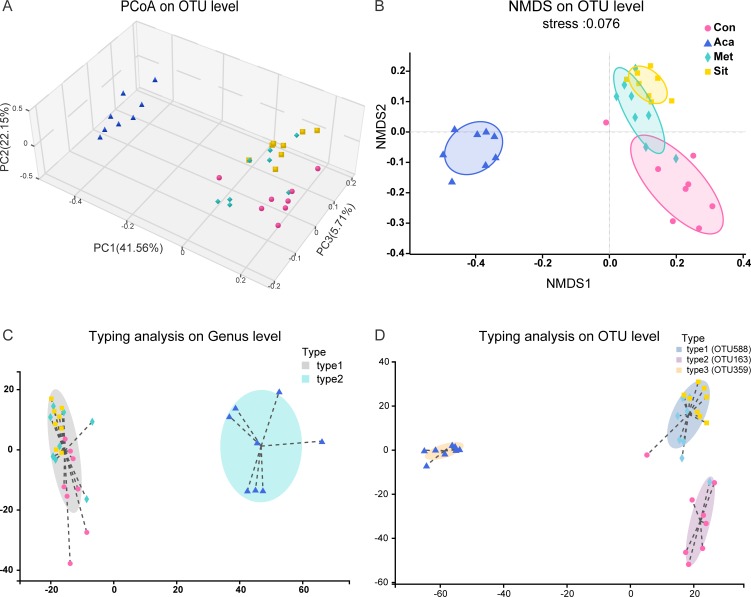
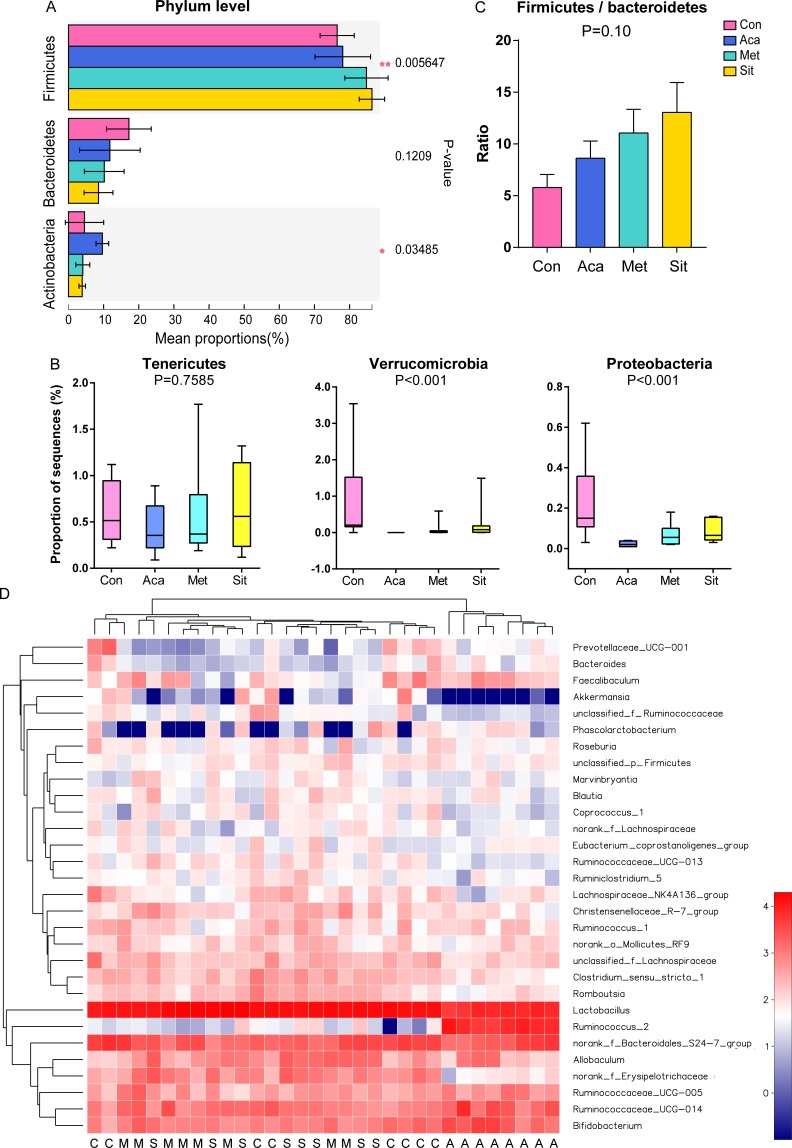
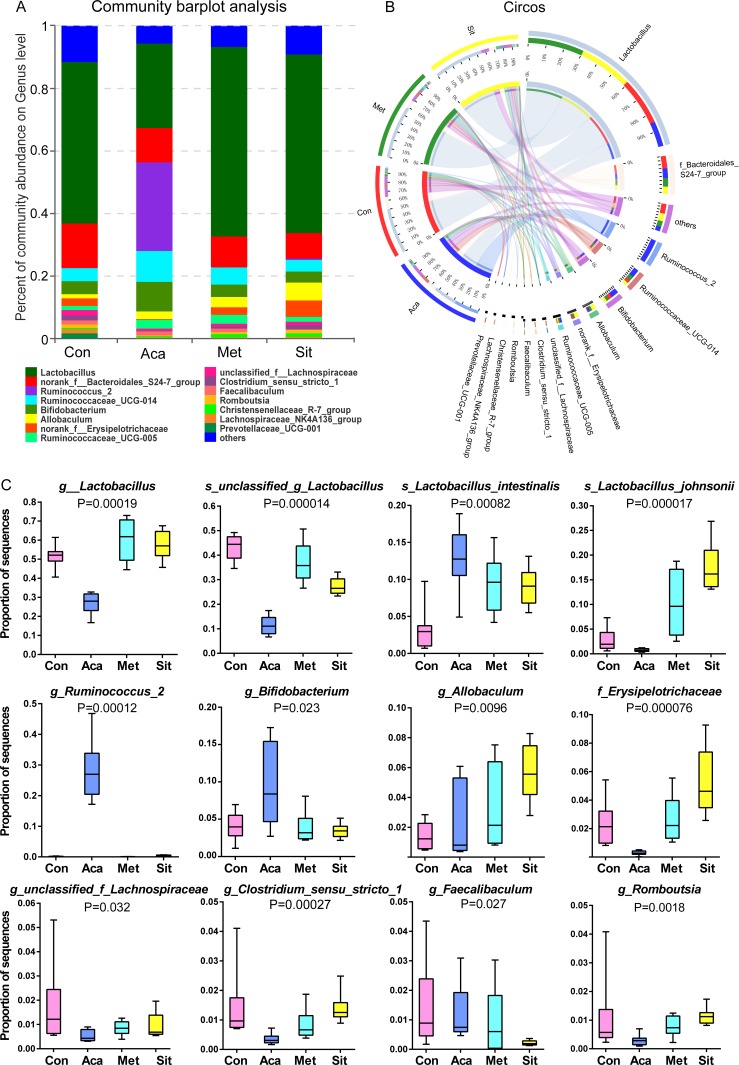
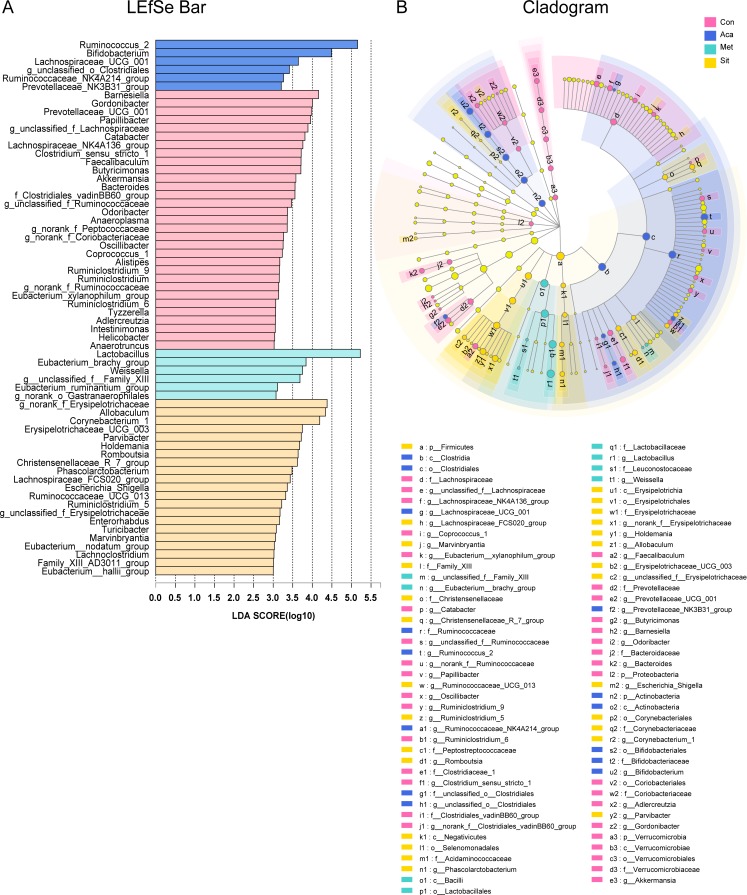
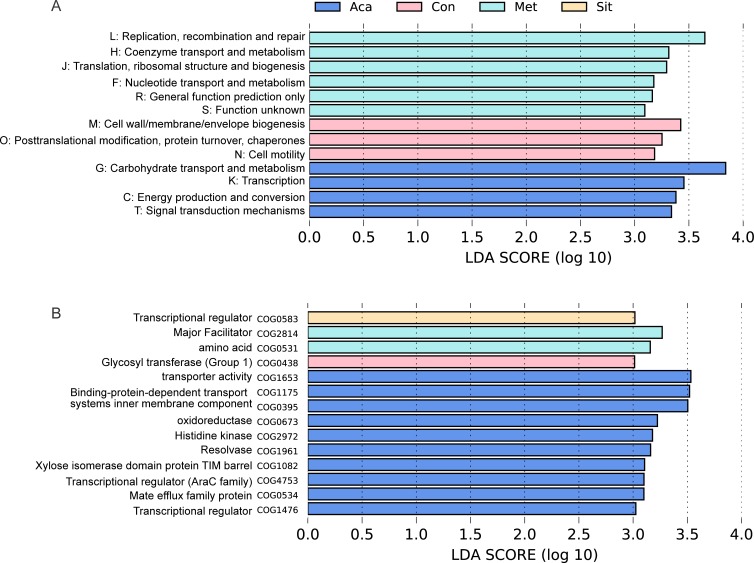
Results: Metformin, acarbose, and sitagliptin monotherapy effectively decreased fasting and postprandial blood glucose levels (p<0.001). Acarbose group displayed specific cluster and enterotype mainly composed by Ruminococcus 2 while Lactobacillus was the dominant bacterium in the enterotype of the other three groups. The relative abundance of genera Ruminococcus 2 and Bifidobacterium was dramatically higher in acarbose group. Metformin and sitagliptin increased the relative abundance of genus Lactobacillus. Metagenomic prediction showed that the functional profiles of carbohydrate metabolism were enriched in acarbose group.

Conclusions: Metformin, acarbose and sitagliptin exerted different effects on the composition of gut microbiota and selectively increased the beneficial bacteria. Supplementation with specific probiotics may further improve the hypoglycemic effects of the antidiabetic drugs.

Keywords: Metformin; acarbose; gut microbiota; sitagliptin; type 2 diabetes.


Conflict of interest statement

Competing interests: None declared.

Figures

Figure 1
Figure 1
Blood glucose levels during the intragastric starch tolerance tests (IGSTT) in control, acarbose, metformin and sitagliptin groups. Data were all expressed as mean±SEM. Values were assessed by one-way analysis of variance (ANOVA). The statistical significance was presented by special characters as #control versus acarbose; *control versus metformin; control versus sitagliptin. One special character meant p<0.05 and two meant p<0.01.
Figure 2
Figure 2
Beta diversity and enterotypes analysis in four groups. (A) Principal coordinates analysis (PCoA). The three principal coordinates (PC1–PC3) explain 41.56%, 22.15% and 5.71%, respectively, and the analysis of permutational multivariate analysis of variance (pMANOVA) was p=0.001 and p adjust=0.001. (B) Non-metrical multidimensional scaling (NMDS). The stress was 0.076. (C) Clustering of all 32 samples into two enterotypes at genus level. Type 1 was represented by Lactobacillus and type 2 was represented by Ruminococcus 2. (D) Typing analysis at OTU level. Types 1–3 were driven by OTU588 (Lactobacillus johnsonii sp) OTU163 (s_unclassified_g_Lactobacillus) and OTU359 (s_uncultured_bacterium_g_Ruminococcus_2), respectively. One dot represents one individual (n=8). Circles=control. Squares=acarbose. Diamond=metformin. Regular triangle=sitagliptin. OTU, operational taxonomic units.
Figure 3
Figure 3
Characterization of core microbial communities. (A) Relative abundance of the domain phyla Firmicutes, Bacteroidetes and Actinobacteria. (B) Relative abundance of phyla Tenericutes, Verrucomicrobia and Proteobacteria. (C) Ratio of Firmicutes to Bacteroidetes. Kruskal-Wallis rank-sum test with adjusting by the false discovery rate (FDR) correction was used to assess the Firmicutes/Bacteroidetes ratio. (D) Heatmap showing top 30 abundant microbes at genus level (log10 transformation). One column represents one sample. A, acarbose group; C, control group; M, metformin group; S, sitagliptin group.
Figure 4
Figure 4
Bacterial community abundance on specific taxa of each group. (A) Community barplot analysis showing the relative abundance on top 15 abundance genera. (B) Circos plot displaying the relationship between samples and bacterial genera. (C) Relative abundance of genus and specific species significantly altered by hypoglycemic agents.
Figure 5
Figure 5
LDA effect size (LEfSe) analysis at genus level among control (Con), acarbose (Aca), metformin (Met) and sitagliptin (Sit) groups. (A) LEfSe barplot showing different abundance at bacterial genus level. (B) Cladogram representing the taxonomic levels by rings with phyla in the outermost and genera in the innermost ring. Only categories meeting a log linear discriminant analysis (LDA) significant threshold >3 are shown. The strategy of multiple comparison among four groups was defined as all-against-all. The prefixes ‘p’, ‘c’, ‘o’, ‘f’ and ‘g’ represent the level of phylum, class, order, family, and genus.
Figure 6
Figure 6
Functional profilings in metagenomic predictions by using Phylogenetic Investigation of Communities by Reconstruction of Unobserved States (PICRUSt) and LDA effect size (LEfSe) analysis. LEfSe barplot showing different abundance of (A) clusters of orthologous groups (COG) functional classifications and (B) COG secondary classifications among control (Con), acarbose (Aca), metformin (Met) and sitagliptin (Sit) groups. They were annotated in evolutionary genealogy of genes: Non-supervised Orthologous Groups (eggNOG) database. Only log linear discriminant analysis (LDA) >3 was shown.

References

    1. Musso G, Gambino R, Cassader M. Obesity, diabetes, and gut microbiota: the hygiene hypothesis expanded? Diabetes Care 2010;33:2277–84. 10.2337/dc10-0556 - DOI - PMC - PubMed
    1. Karlsson FH, Tremaroli V, Nookaew I, et al. . Gut metagenome in European women with normal, impaired and diabetic glucose control. Nature 2013;498:99–103. 10.1038/nature12198 - DOI - PubMed
    1. Qin J, Li Y, Cai Z, et al. . A metagenome-wide association study of gut microbiota in type 2 diabetes. Nature 2012;490:55–60. 10.1038/nature11450 - DOI - PubMed
    1. Aron-Wisnewsky J, Doré J, Clement K. The importance of the gut microbiota after bariatric surgery. Nat Rev Gastroenterol Hepatol 2012;9:590–8. 10.1038/nrgastro.2012.161 - DOI - PubMed
    1. Montandon SA, Jornayvaz FR. Effects of antidiabetic drugs on gut microbiota composition. Genes 2017;8. doi:10.3390/genes8100250. [Epub ahead of print: 30 Sep 2017]. - DOI - PMC - PubMed

Publication types

MeSH terms

LinkOut - more resources