

Electric field causes volumetric changes in the human brain
- PMID: 31644424
- PMCID: PMC6874416
- DOI: 10.7554/eLife.49115
Electric field causes volumetric changes in the human brain
Abstract
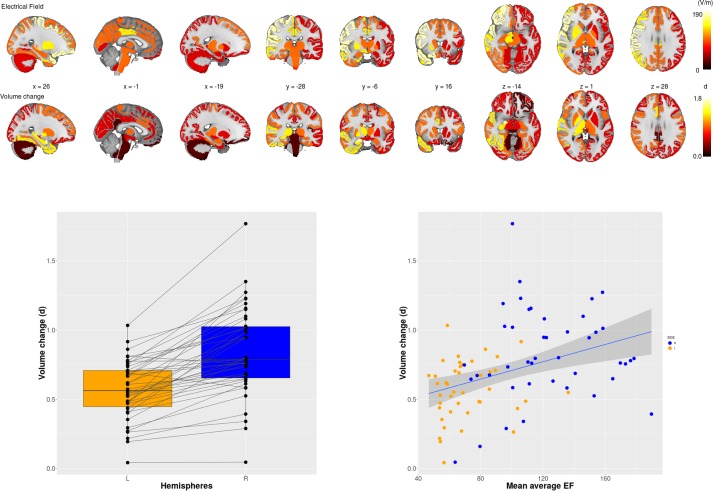
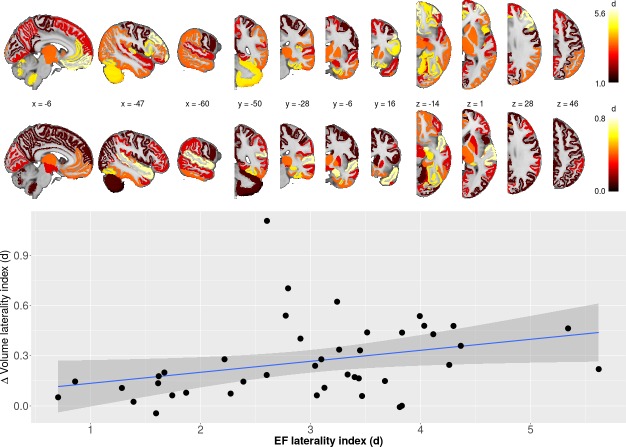
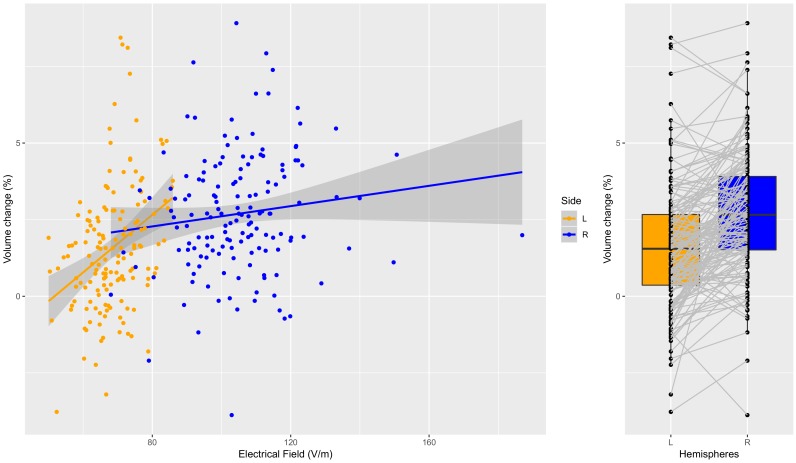
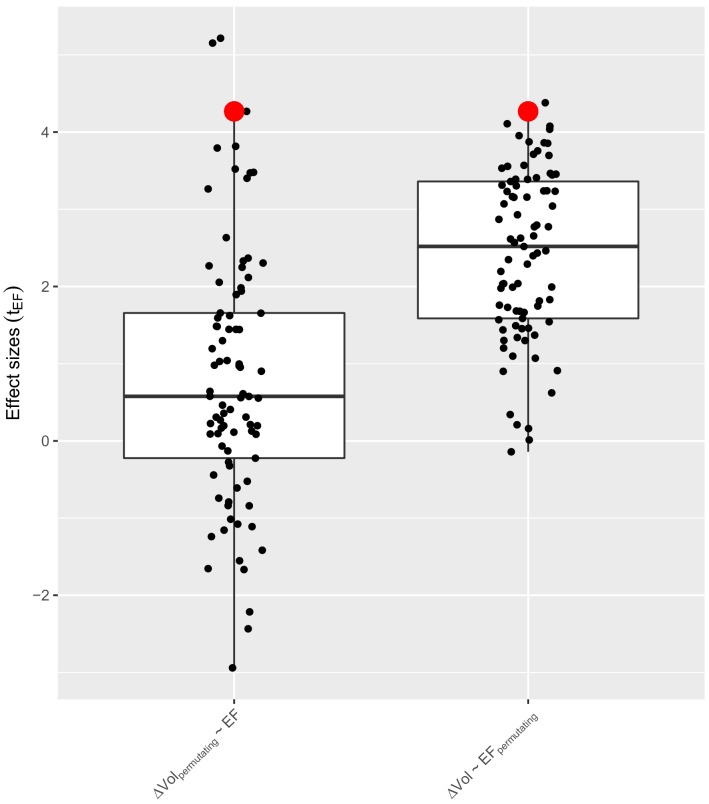
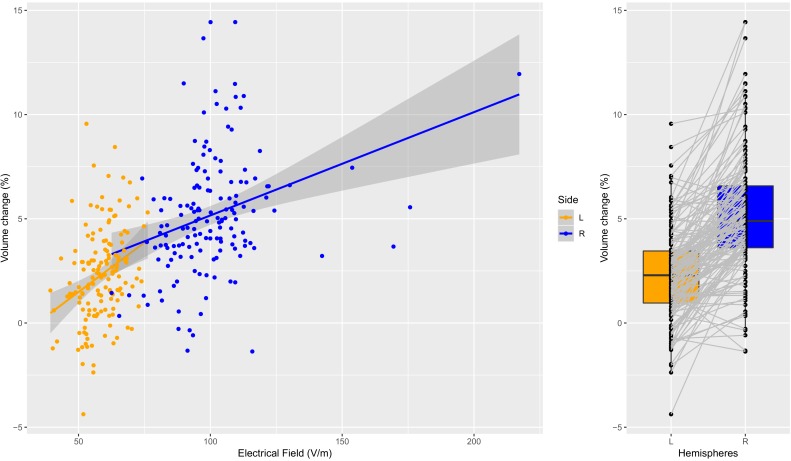
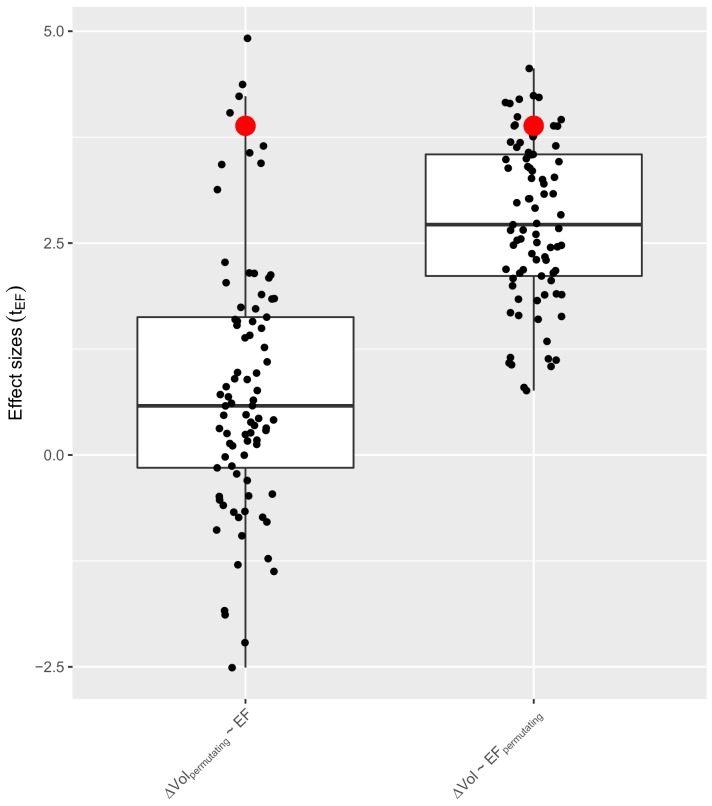
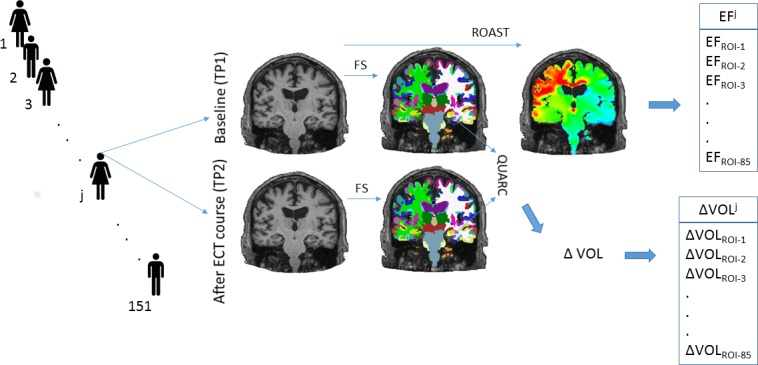
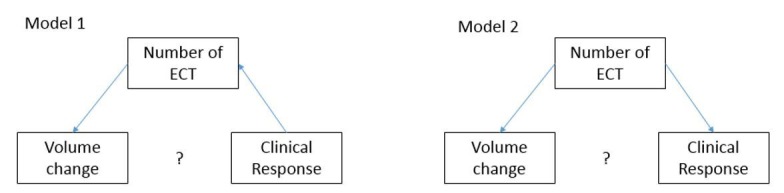
Recent longitudinal neuroimaging studies in patients with electroconvulsive therapy (ECT) suggest local effects of electric stimulation (lateralized) occur in tandem with global seizure activity (generalized). We used electric field (EF) modeling in 151 ECT treated patients with depression to determine the regional relationships between EF, unbiased longitudinal volume change, and antidepressant response across 85 brain regions. The majority of regional volumes increased significantly, and volumetric changes correlated with regional electric field (t = 3.77, df = 83, r = 0.38, p=0.0003). After controlling for nuisance variables (age, treatment number, and study site), we identified two regions (left amygdala and left hippocampus) with a strong relationship between EF and volume change (FDR corrected p<0.01). However, neither structural volume changes nor electric field was associated with antidepressant response. In summary, we showed that high electrical fields are strongly associated with robust volume changes in a dose-dependent fashion.
Keywords: ECT; depression; electric field modeling; human; human biology; medicine; neuroimaging; volume change.
Conflict of interest statement
MA, LO, ZD, BW, AJ, SS, HB, MC, UD, AD, VE, RE, UK, KN, KO, MO, RR, MS, AT, LE, FB, PS, JP, IT, Pv, GP, AM, CA No competing interests declared, MB reports that The City University of New York (CUNY) has intellectual property (IP) on neuro-stimulation system and methods with MB as inventor; serves on the scientific advisory boards of Boston Scientific and GSK; has equity in Soterix Medical, AD reports that he is a Founder of and holds equity in CorTechs Labs, Inc, and serves on its Scientific Advisory Board. He is a member of the Scientific Advisory Board of Human Longevity, Inc and receives funding through research agreements with General Electric Healthcare and Medtronic, Inc
Figures
Comment in
-
The impact of electroconvulsive therapy on brain grey matter volume: What does it mean?Brain Stimul. 2020 Sep-Oct;13(5):1226-1231. doi: 10.1016/j.brs.2020.04.014. Epub 2020 May 19. Brain Stimul. 2020. PMID: 32442625 No abstract available.
References
-
- Andreae LC. Adult neurogenesis in humans: dogma overturned, again and again? Science Translational Medicine. 2018;10:eaat3893. doi: 10.1126/scitranslmed.aat3893. - DOI
-
- Bai S, Gálvez V, Dokos S, Martin D, Bikson M, Loo C. Computational models of bitemporal, bifrontal and right unilateral ECT predict differential stimulation of brain regions associated with efficacy and cognitive side effects. European Psychiatry. 2017;41:21–29. doi: 10.1016/j.eurpsy.2016.09.005. - DOI - PubMed
-
- Benjamini Y, Hochberg Y. Controlling the false discovery rate: a practical and powerful approach to multiple testing. Journal of the Royal Statistical Society: Series B. 1995;57:289–300. doi: 10.1111/j.2517-6161.1995.tb02031.x. - DOI
Publication types
MeSH terms
Substances
Grants and funding
- MH110008/MH/NIMH NIH HHS/United States
- Project C09/Deutsche Forschungsgemeinschaft/International
- RE111604 and RE111722/Innovative Medical Research/International
- MH119616/MH/NIMH NIH HHS/United States
- DFG FOR2107/Deutsche Forschungsgemeinschaft/International
- R01 MH092301/MH/NIMH NIH HHS/United States
- 911986/Western Norway Regional Health Authority/International
- ZIAMH00295/MH/NIMH NIH HHS/United States
- U01 MH111826/MH/NIMH NIH HHS/United States
- DFG FOR2107 DA1151/5-1 and DA1151/5-2/Deutsche Forschungsgemeinschaft/International
- MH111826/MH/NIMH NIH HHS/United States
- MH092301/MH/NIMH NIH HHS/United States
- Fulbright Program/University of Bergen/International
- MH102743/MH/NIMH NIH HHS/United States
- K24 MH102743/MH/NIMH NIH HHS/United States
- Projects C09 and Z02/Deutsche Forschungsgemeinschaft/International
- R21 MH119616/MH/NIMH NIH HHS/United States
- Project Z02/Deutsche Forschungsgemeinschaft/International
- K23 MH120504/MH/NIMH NIH HHS/United States
- SFB-TRR58/Deutsche Forschungsgemeinschaft/International
- U01 MH110008/MH/NIMH NIH HHS/United States
- RE111604/Innovative Medical Research/International
- DA1151/5-1/Deutsche Forschungsgemeinschaft/International
- R01 MH111826/MH/NIMH NIH HHS/United States
- DA1151/5-2/Deutsche Forschungsgemeinschaft/International
- RE111722/Innovative Medical Research/International
- 912238/Western Norway Regional Health Authority/International
