. 2020 Apr 1;21(7):1007-1021.
doi: 10.1002/cbic.201900572. Epub 2019 Dec 5.

Chemical-Shift Perturbations Reflect Bile Acid Binding to Norovirus Coat Protein: Recognition Comes in Different Flavors

Affiliations

Chemical-Shift Perturbations Reflect Bile Acid Binding to Norovirus Coat Protein: Recognition Comes in Different Flavors

Robert Creutznacher et al. Chembiochem. .

Abstract

Bile acids have been reported as important cofactors promoting human and murine norovirus (NoV) infections in cell culture. The underlying mechanisms are not resolved. Through the use of chemical shift perturbation (CSP) NMR experiments, we identified a low-affinity bile acid binding site of a human GII.4 NoV strain. Long-timescale MD simulations reveal the formation of a ligand-accessible binding pocket of flexible shape, allowing the formation of stable viral coat protein-bile acid complexes in agreement with experimental CSP data. CSP NMR experiments also show that this mode of bile acid binding has a minor influence on the binding of histo-blood group antigens and vice versa. STD NMR experiments probing the binding of bile acids to virus-like particles of seven different strains suggest that low-affinity bile acid binding is a common feature of human NoV and should therefore be important for understanding the role of bile acids as cofactors in NoV infection.

Keywords: STD NMR spectroscopy; chemical shift perturbation; ensemble docking; long-timescale MD; molecular recognition.


Conflict of interest statement

The authors declare no conflict of interest.

Figures

Scheme 1
Scheme 1
Chemical structures and abbreviations of ligands used for NMR experiments.
Figure 1
Figure 1
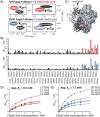
A) Regions of a 1H,15N TROSY HSQC spectrum showing backbone NH signals of a [U‐2H,15N] labeled sample of P dimers of GII.4 Saga norovirus (100 μm) being disturbed by the presence of 8 mm cholic acid (CA). The spectrum was recorded at 500 MHz and 298 K. B) Chemical shift perturbations (CSPs, calculated as Euclidean distances) of backbone NH signals as a function of amino acid position. CSPs larger than mean+σ are shown in orange, and values larger than mean+2 σ in red. C) Mapping of CSPs onto the crystal structure of P dimers (PDB ID: https://www.rcsb.org/structure/4X06) using the color coding in panel (B). The remote HBGA binding site is highlighted with a blue ball (position of C6 of the fucose moiety of B‐trisaccharide).
Figure 2
Figure 2
Binding epitope of CA bound to GII.4 VLPs from STD NMR buildup curves (cf. Figure S3). Almost all protons receive saturation, but due to overlap STD amplification factors (AF) could only be determined for a subset of protons. Where STD amplification factors could be obtained respective protons are color coded. Experiments were performed at 600 MHz, with the temperature set at 277 K.
Figure 3
Figure 3
Binding isotherms from NMR titration experiments using cholic acid as ligand. A) Binding isotherms from CSPs in 1H,15N TROSY HSQC spectra of GII.4 Saga P dimers. B) Binding isotherms from CSPs in methyl TROSY spectra of GII.4 Saga P dimers. C) Binding isotherms from STDs in the presence of GII.4 Saga P dimers. D) Binding isotherms from initial growth rate STDs in the presence of GII.4 Saga VLPs (cf. Figure 2). E) Binding isotherms from CSPs in 1H,15N TROSY HSQC spectra of GII.4 MI001 P dimers.
Figure 4
Figure 4
A) Regions of methyl TROSY spectra of a 13C‐methyl (MILProSVProSA)‐labeled sample of GII.4 Saga NN and iDiD P dimers. Two representative cross‐peaks demonstrate that perturbations upon addition of CA are unaffected by deamidation of Asn373. B) CSPs as a function of amino acid position. CSPs at 8 mm CA larger than mean+σ (‐ ‐ ‐ ‐) are color coded (red: NN P dimers; blue: iDiD P dimers). C) 13C methyl CSPs mapped onto the surface of GII.4 Saga NN P dimers (PDB ID: https://www.rcsb.org/structure/4X06). The deamidation site Asn373 is highlighted. D) Binding isotherms from chemical shift titrations of NN P dimers with CA. E) Binding isotherms from chemical shift titrations of iDiD P dimers with CA.
Figure 5
Figure 5
Examples of CSPs in methyl TROSY spectra of GII.4 Saga P dimers in the presence of blood group B‐trisaccharide (B‐Tri) and cholic acid. Left column: CSP of the cross‐peak of the 13C methyl group of Leu334 indicates binding of B‐Tri and is only marginally affected by the presence of saturating amounts of CA. Middle column: CSP of the cross‐peak of the 13C methyl group of Leu507 indicates binding of CA and is only marginally affected by the presence of saturating amounts of B‐Tri. Right column: Corresponding K D values for B‐Tri and apparent K D values for CA from binding isotherms using global fitting.
Figure 6
Figure 6
A) Backbone RMSD, difference in pocket volume relative to crystal structure and average bile acid docking score. Solid lines represent moving averages. The shaded area and the dots represent the actual values. The CA ligand poses with the five lowest docking scores were labeled as 1–5 (cf. lowest panel) and were subsequently subjected to MD refinement. B) Backbone RMSF mapped to the protein X‐ray structure (PDB ID: https://www.rcsb.org/structure/4X06). The binding pocket identified by NMR is marked with an ellipsoid.
Figure 7
Figure 7
X‐ray structure (in absence of small molecules) and the five top‐scoring poses resulting from dynamic docking of CA to MD snapshots of P dimers. The protein surface is color coded according to experimental CSPs. Backbone CSPs larger than mean+2 σ (cf. Figure 1 B) are shown in pale red. CSPs larger than mean+σ from methyl TROSY experiments (cf. Figure 4 B) are yellow. CA is shown in blue with oxygen atoms highlighted in red and hydrogen atoms omitted for clarity. The numbers represent the average of all bile acid docking scores with the CA docking score in brackets [kcal mol−1].
Figure 8
Figure 8
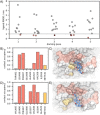
A) MD refinement of docked ligand poses of CA. Each point represents the mean RMSD of the final 10 ns of a 20 ns MD trajectory using the corresponding docking pose as initial coordinates. For each pose 1–5 (cf. Figure 7) ten independent simulations with varying initial velocity distributions were performed. Trajectories with RMSD<1 nm are highlighted as orange or dark red filled circles and were further analyzed for CA–protein contacts. As examples, CA–protein contacts for the red filled circle trajectories are shown in (B) and (D) in detail. B), D) Contact occupancies of CA with backbone nitrogen atoms during the last 10 ns of trajectories Pose 3 Rep 5 (B) and Pose 4 Rep 3 (D). Contact criterion is a distance ≤0.6 nm between the backbone N and at least one heavy atom of CA. Contact amino acids that exhibit significant CSPs are highlighted in red (backbone HSQC) and gold (methyl TROSY), respectively. Proline residues are not considered as they show no NMR signals. Only amino acids with an occupancy >0.02 are shown. C), E) Representative snapshots of stable protein–CA complexes for Pose 3 Rep 5 (C) and Pose 4 Rep 3 (E).

References

    1. None
    1. de Graaf M., van Beek J., Koopmans M. P., Nat. Rev. Microbiol. 2016, 14, 421–433; - PubMed
    1. Koo H. L., Ajami N., Atmar R. L., DuPont H. L., Discov. Med. 2010, 10, 61–70; - PMC - PubMed
    1. Ahmed S. M., Hall A. J., Robinson A. E., Verhoef L., Premkumar P., Parashar U. D., Koopmans M., Lopman B. A., Lancet Infect. Dis. 2014, 14, 725–730. - PMC - PubMed
    1. None

Publication types