. 2020 Feb 1;26(3):679-689.
doi: 10.1158/1078-0432.CCR-19-2209. Epub 2019 Oct 23.

Neoadjuvant PD-1 Immune Checkpoint Blockade Reverses Functional Immunodominance among Tumor Antigen-Specific T Cells

Affiliations

Neoadjuvant PD-1 Immune Checkpoint Blockade Reverses Functional Immunodominance among Tumor Antigen-Specific T Cells

Jay Friedman et al. Clin Cancer Res. .

Abstract

Purpose: Surgical resection of primary tumor with regional lymphadenectomy remains the treatment of choice for patients with advanced human papillomavirus-negative head and neck squamous cell carcinoma. However, even when pathologic disease-free margins can be achieved, locoregional and/or distant disease relapse remains high. Perioperative immunotherapy may improve outcomes, but mechanistic data supporting the use of neoadjuvant or adjuvant treatment clinically are sparse.

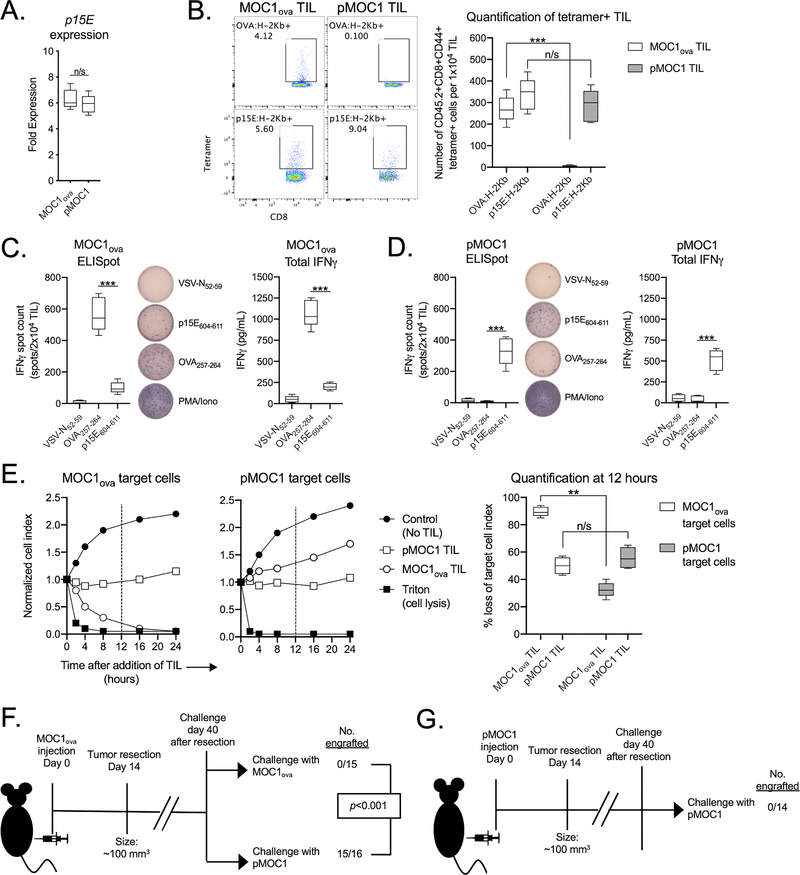
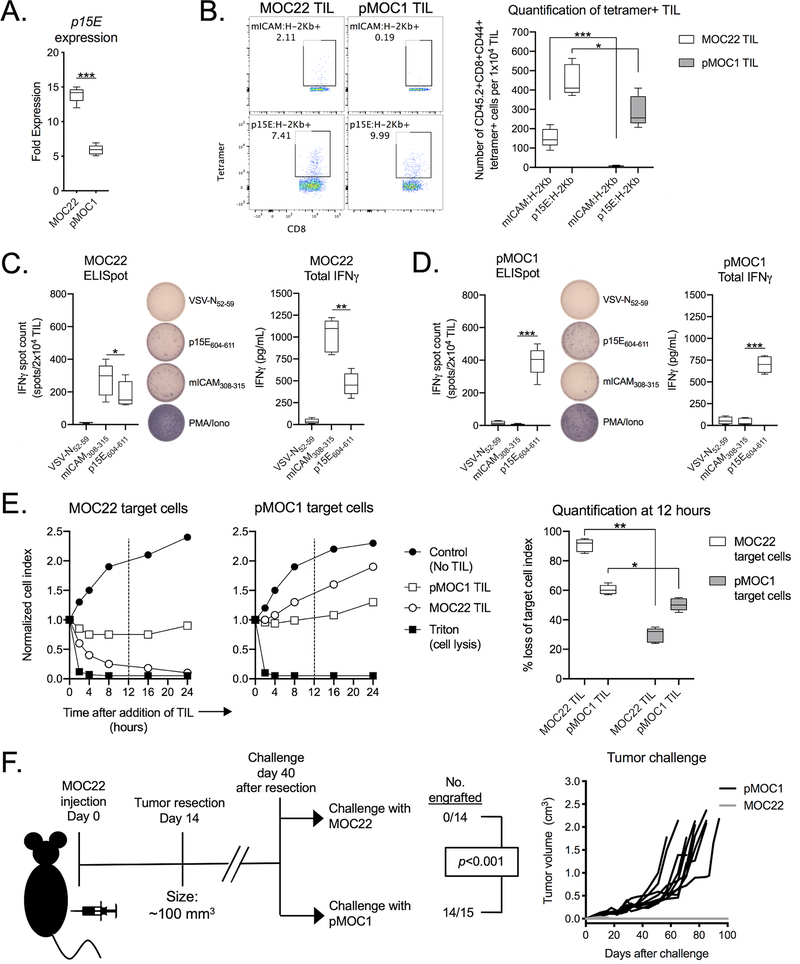
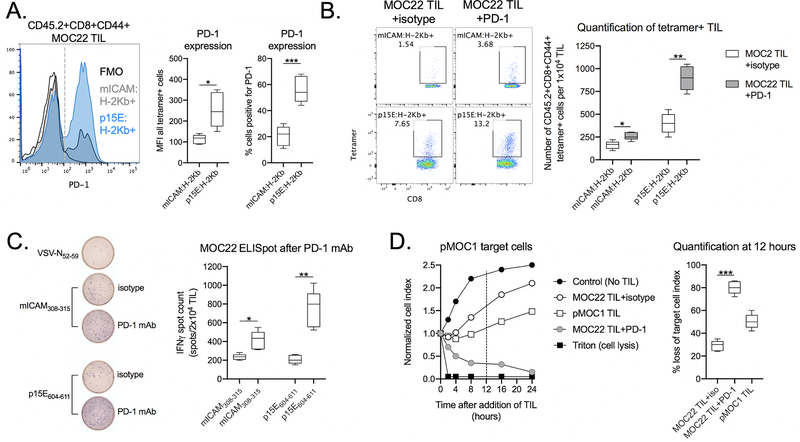
Experimental design: Two syngeneic models of oral cavity carcinoma with defined T-cell antigens were treated with programmed death receptor 1 (PD-1) mAb before or after surgical resection of primary tumors, and antigen-specific T-cell responses were explored with functional and in vivo challenge assays.

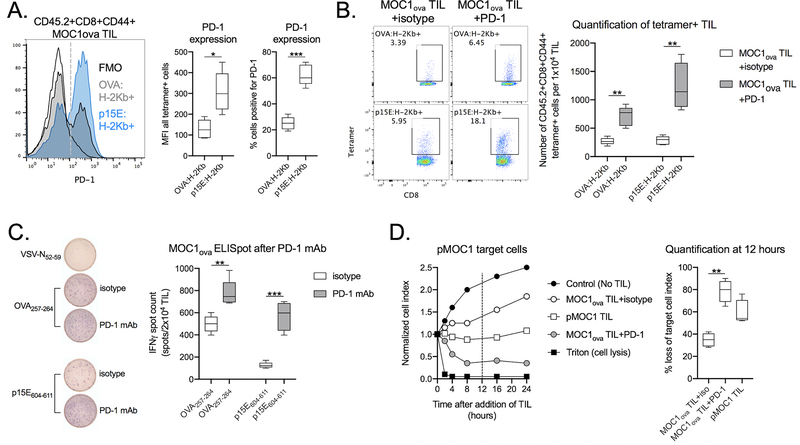
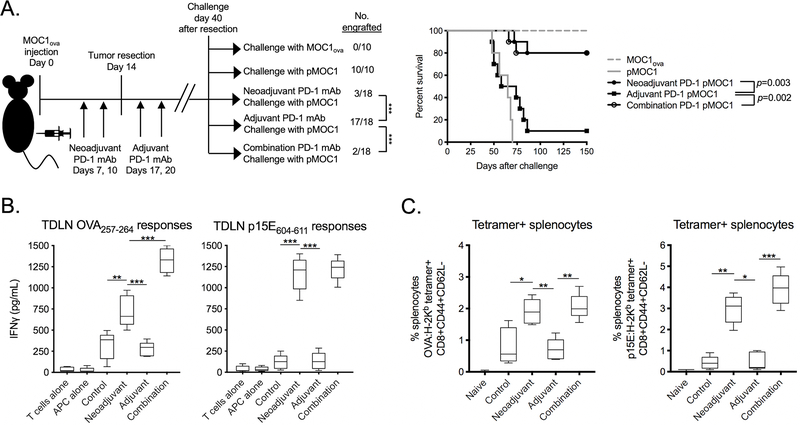
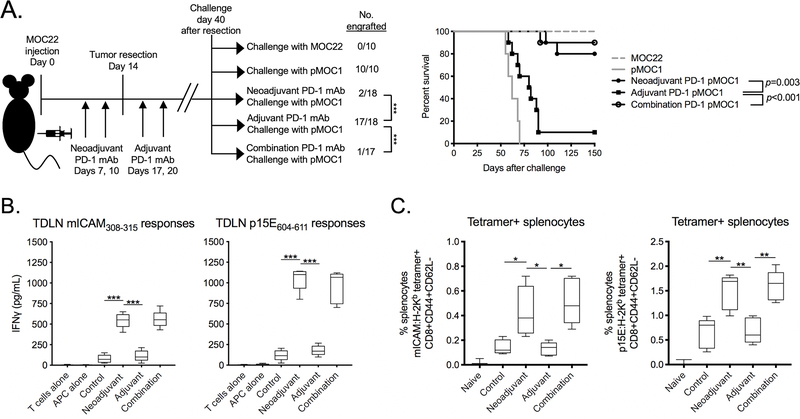
Results: We demonstrated that functional immunodominance developed among T cells targeting multiple independent tumor antigens. T cells specific for subdominant antigens expressed greater levels of PD-1. Neoadjuvant, but not adjuvant, PD-1 immune checkpoint blockade broke immunodominance and induced T-cell responses to dominant and subdominant antigens. Using tumors lacking the immunodominant antigen as a model of antigen escape, neoadjuvant PD-1 immune checkpoint blockade induced effector T-cell immunity against tumor cells lacking immunodominant but retaining subdominant antigen. When combined with complete surgical excision, neoadjuvant PD-1 immune checkpoint blockade led to formation of immunologic memory capable of preventing engraftment of tumors lacking the immunodominant but retaining subdominant antigen.

Conclusions: Together, these results implicate PD-1 expression by T cells in the mechanism of functional immunodominance among independent T-cell clones within a progressing tumor and support the use of neoadjuvant PD-1 immune checkpoint blockade in patients with surgically resectable carcinomas.


Conflict of interest statement

Conflict of interest: The authors have declared that no conflict of interest exists

Figures

Figure 1 –
Figure 1 –. Functional TIL targeting p15E failed to develop in the presence of OVA
A, qPCR was used to measure p15E gene expression in MOC1ova and pMOC1 cells. p15E expression in MOC2 cells was used as a reference and set to 1. B, TIL were cultured from day 14 MOC1ova or pMOC1 tumors. After 7 days in culture, TIL were assessed for tetramer positivity by flow cytometry. Representative dot plots are shown on the left. Quantity of tetramer positive TIL is shown on the right (n = 5 independent tumors each model). C and D, TIL cultured from MOC1ova tumors (C) or pMOC1 tumors (D) were assessed for IFNγ production upon exposure to control (VSV-N52–59) or antigenic peptides (OVA257–264 and p15E604–611). Number of IFNγ producing cells was quantified by ELISpot (left, with representative photomicrographs of wells) and cumulative production of IFNγ was quantified by ELISA (right) (n = 5 independent tumors each model). E, TIL cultured from day 14 MOC1ova or pMOC1 tumors were co-cultured with MOC1ova or pMOC1 target cells and loss of target cell viability was assessed in real-time by impedance analysis. Representative impedance plots are shown on the left. Quantification of loss of target cell index 12 hours after initiation of co-culture (vertical dashed line) is shown on the right (TIL pooled from 5 independent tumors each model). F, MOC1ova tumors were established in WT B6 mice and completely resected at day 14. Forty days after resection, mice were challenged with either MOC1ova or pMOC1 cells and followed for tumor engraftment. Cumulative data from three independent experiments. Significance determined by Mantel-Cox analysis. G, pMOC1 tumors were established in WT B6 mice and completely resected at day 14. Forty days after resection, mice were challenged with pMOC1 cells and followed for tumor engraftment. Cumulative data from two independent experiments. Unless stated otherwise, all data shown is representative data from one of at least two independent experiments. **, p < 0.01; ***, p < 0.001, student’s t-test; n/s, non-significant.
Figure 2 –
Figure 2 –. PD-1 mAb restored the function of TIL targeting p15E in MOC1ova tumors
A, MOC1ova TIL specific for OVA:H-2Kb or p15E:H-2Kb were assessed for PD-1 expression by flow cytometry. Representative histogram of PD-1 staining is shown on the left, with qualification of PD-1 expression on all tetramer positive cells (median fluorescent intensity) as well as the percentage of positive cells (dashed grey line) shown on the right (n = 5 independent tumors). B, WT B6 mice bearing MOC1ova tumors were treated with PD-1 mAb or isotype control (days 7 and 10). TIL were cultured from day 14 tumors, and after 7 days of culture, TIL were assessed for tetramer positivity by flow cytometry. Representative dot plots are shown on the left. Quantity of tetramer positive TIL is shown on the right (n = 5 independent tumors each condition). C, TIL cultured from day 14 MOC1ova tumors treated with PD-1 mAb or isotype control were assessed for IFNγ production upon exposure to antigenic peptides by ELISpot. Representative photomicrographs of ELISpot wells are shown on the left, with quantification of spot counts on the right (n = 5 independent tumors each condition). D, TIL cultured from day 14 MOC1ova tumors treated with PD-1 mAb or isotype control were co-cultured with pMOC1 target cells and loss of target cell viability was assessed by impedance analysis. Representative impedance plot is shown on the left. Quantification of loss of target cell index 12 hours after initiation of co-culture (vertical dashed line) is shown on the right (TIL pooled from 5 independent tumors each condition). All data shown is representative data from one of at least two independent experiments. *, p < 0.05; **, p < 0.01; ***, p < 0.001, student’s t-test
Figure 3 –
Figure 3 –. Mice rejected engraftment with tumor cells lacking OVA following neoadjuvant PD-1 mAb
A, MOC1ova tumors were established in WT B6 mice and completely resected at day 14. Tumor-bearing mice were given neoadjuvant (days 7 and 10), adjuvant (days 17 and 20) or combination PD-1 mAb. 40 days after resection, untreated mice were challenged with MOC1ova or pMOC1 cells as controls, and treated mice were challenged with pMOC1 cells and followed for engraftment. Tumor engraftment rates are shown on the left, and survival to 150 days after challenge is shown as a Kaplan-Meier curve on the right. Cumulative data from two independent experiments. B and C, MOC1ova tumor-bearing mice were treated neoadjuvant, adjuvant or combination PD-1 mAb as in A. B, 40 days after resection, T cells were sorted form tumor draining lymph nodes (TDLN) and assessed for IFNγ production upon exposure to antigenic peptides by ELISA. C, 40 days after resection, splenic T cells were assessed for tetramer and memory marker positivity by flow cytometry (n = 5 independent tumors each condition). Unless stated otherwise, all data shown is representative data from one of at least two independent experiments. *, p < 0.05; **, p < 0.01; ***, p < 0.001, student’s t-test
Figure 4 –
Figure 4 –. Functional TIL targeting p15E failed to develop in the presence of mICAM
A, qPCR was used to measure p15E gene expression in MOC22 and pMOC1 cells. B, TIL were cultured from day 14 MOC22 or pMOC1 tumors. After 7 days in culture, TIL were assessed for tetramer positivity by flow cytometry. Representative dot plots are shown on the left. Quantity of tetramer positive TIL is shown on the right (n = 5 independent tumors each model). C and D, TIL cultured from MOC22 tumors (C) or pMOC1 tumors (D) were assessed for IFNγ production upon exposure to control (VSV-N52–59) or antigenic peptides (mICAM308-315 and p15E604–611). Number of IFNγ producing cells was quantified by ELISpot (left, with representative photomicrographs of wells) and cumulative production of IFNγ was quantified by ELISA (right) (n = 5 independent tumors each model). E, TIL cultured from day 14 MOC22 or pMOC1 tumors were co-cultured with MOC22 or pMOC1 target cells and loss of target cell viability was assessed in real-time by impedance analysis. Representative impedance plots are shown on the left. Quantification of loss of target cell index 12 hours after initiation of co-culture (vertical dashed line) is shown on the right (TIL pooled from 5 independent tumors each model). F, MOC22 tumors were established in WT B6 mice and completely resected at day 14. 40 days after resection, mice were challenged with either MOC22 or pMOC1 cells and followed for tumor engraftment. Cumulative data from two independent experiments. Significance determined by Mantel-Cox analysis. Unless stated otherwise, all data shown is representative data from one of at least two independent experiments. *, p < 0.05; **, p < 0.01; ***, p < 0.001; student’s t-test
Figure 5 –
Figure 5 –. PD-1 mAb restored the function of TIL targeting p15E in MOC22 tumors
A, MOC22 TIL specific for OVA:H-2Kb or p15E:H-2Kb were assessed for PD-1 expression by flow cytometry. Representative histogram of PD-1 staining is shown on the left, with qualification of PD-1 expression on all tetramer positive cells (median fluorescent intensity) as well as the percentage of positive cells (dashed grey line) shown on the right. B, WT B6 mice bearing MOC22 tumors were treated with PD-1 mAb or isotype control (days 7 and 10). TIL were cultured from day 14 tumors, and after 7 days of culture, TIL were assessed for tetramer positivity by flow cytometry. Representative dot plots are shown on the left. Quantity of tetramer positive TIL is shown on the right (n = 5 independent tumors each condition). C, TIL cultured from day 14 MOC22 tumors treated with PD-1 mAb or isotype control were assessed for IFNγ production upon exposure to antigenic peptides by ELISpot. Representative photomicrographs are shown on the left, with quantification of spot counts on the right (TIL pooled from 5 independent tumors each condition). D, TIL cultured from day 14 MOC22 tumors treated with PD-1 mAb or isotype control were co-cultured with pMOC1 target cells and loss of target cell viability was assessed by impedance analysis. Representative impedance plot is shown on the left. Quantification of loss of target cell index 12 hours after initiation of co-culture (vertical dashed line) is shown on the right (TIL pooled from 5 independent tumors each condition). All data shown is representative data from one of at least two independent experiments. *, p < 0.05; **, p < 0.01; ***, p < 0.001
Figure 6 –
Figure 6 –. Mice rejected engraftment with tumor cells lacking mICAM following neoadjuvant PD-1 mAb
A, MOC22 tumors were established in WT B6 mice and completely resected at day 14. Tumor-bearing mice were given neoadjuvant (days 7 and 10), adjuvant (days 17 and 20) or combination PD-1 mAb. 40 days after resection, untreated mice were challenged with MOC22 or pMOC1 cells as controls, and treated mice were challenged with pMOC1 cells and followed for engraftment. Tumor engraftment rates are shown on the left, and survival to 150 days after challenge is shown as a Kaplan-Meier curve on the right. Cumulative data from two independent experiments. B and C, MOC22 tumor-bearing mice were treated neoadjuvant, adjuvant or combination PD-1 mAb as in A. B, 40 days after resection, T cells were sorted form tumor draining lymph nodes (TDLN) and assessed for IFNγ production upon exposure to antigenic peptides by ELISA. C, 40 days after resection, splenic T cells were assessed for tetramer and memory marker positivity by flow cytometry (n = 5 independent tumors each condition). Unless stated otherwise, all data shown is representative data from one of at least two independent experiments. *, p < 0.05; **, p < 0.01; ***, p < 0.001

References

    1. Bernier J, Domenge C, Ozsahin M, Matuszewska K, Lefebvre JL, Greiner RH, et al. Postoperative irradiation with or without concomitant chemotherapy for locally advanced head and neck cancer. N Engl J Med 2004;350(19):1945–52. - PubMed
    1. Ferris RL, Blumenschein G Jr., Fayette J, Guigay J, Colevas AD, Licitra L, et al. Nivolumab for Recurrent Squamous-Cell Carcinoma of the Head and Neck. The New England journal of medicine 2016;375(19):1856–67. - PMC - PubMed
    1. Seiwert TY, Burtness B, Mehra R, Weiss J, Berger R, Eder JP, et al. Safety and clinical activity of pembrolizumab for treatment of recurrent or metastatic squamous cell carcinoma of the head and neck (KEYNOTE-012): an open-label, multicentre, phase 1b trial. The Lancet Oncology 2016;17(7):956–65. - PubMed
    1. Bursuker I, North RJ. Immunological consequences of tumor excision: from active immunity to immunological memory. Int J Cancer 1986;37(2):275–81. - PubMed
    1. Salvadori S, Martinelli G, Zier K. Resection of solid tumors reverses T cell defects and restores protective immunity. J Immunol 2000;164(4):2214–20. - PubMed

Publication types

MeSH terms

Substances