. 2019 Oct 23;9(1):15190.
doi: 10.1038/s41598-019-51375-7.

Social context and dominance status contribute to sleep patterns and quality in groups of freely-moving mice

Affiliations

Social context and dominance status contribute to sleep patterns and quality in groups of freely-moving mice

Stoyo Karamihalev et al. Sci Rep. .

Abstract

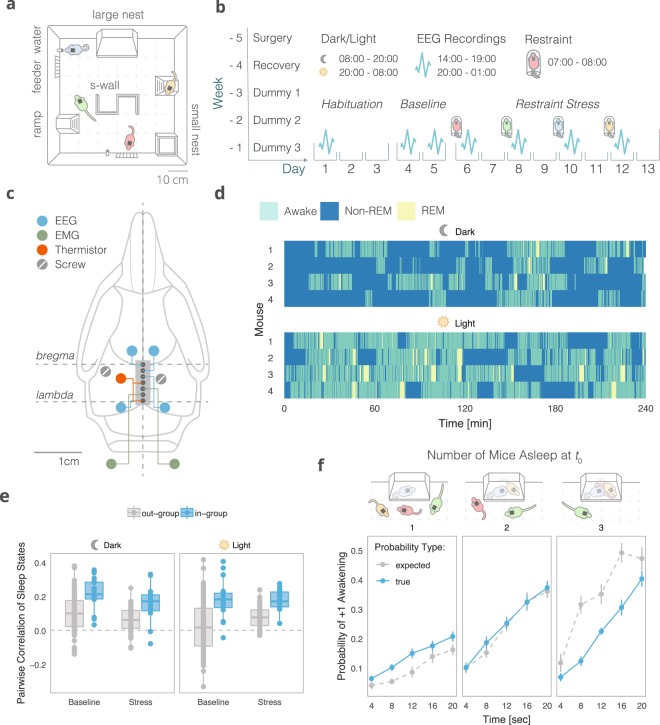
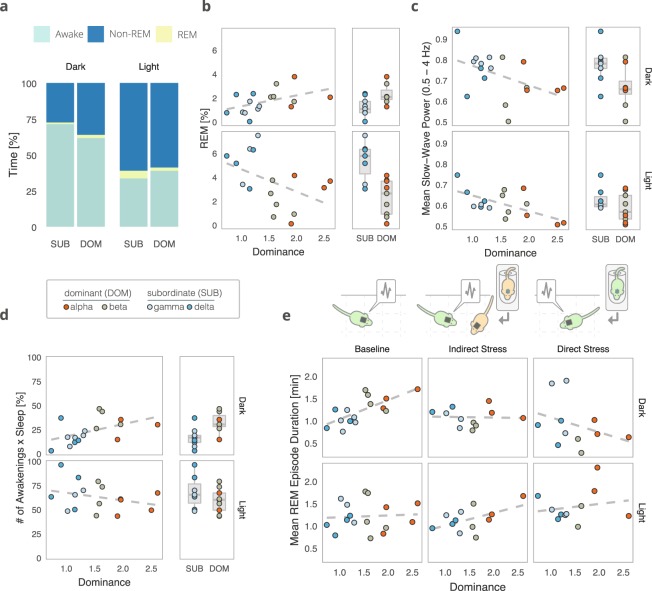
In socially-living species, sleep patterns are often subject to group influences, as individuals adjust to the presence, daily rhythms, and social pressures of cohabitation. However, sleep studies in mice are typically conducted in single-housed individuals. Here, we investigated sleep in a semi-naturalistic environment with freely-moving, group-housed mice using wireless electroencephalographic (EEG) monitoring and video tracking. We found evidence of in-group synchrony of sleep state patterns and effects of social dominance status on sleep quality. These findings highlight the importance of exploring sleep in a social context and are a step toward more informative research on the interplay between social functioning and sleep.


Conflict of interest statement

The authors declare no competing interests.

Figures

Figure 1
Figure 1
Sleep coordination in freely moving groups of mice. (a) The “Social Box” (SB) paradigm (described in detail in refs). Each SB is an arena where a group of individuals cohabitate under continuous video monitoring for the duration of the experiment (several days). Each box contains a closed large nest, a small open shelter, two ramps, two feeders, two water bottles, and an S-wall. (b) Experimental timeline. Implantation of EEG and EMG electrodes was performed five weeks before introduction to the SB. The surgery was followed by a week of recovery and three training weeks of habituating the animals to dummy head stages of increasing weights. Baseline behavioral and EEG recordings were collected for 5 days, followed by individual stress (1 h restraint) before the beginning of the dark phase. A different animal from the same group was stressed every other day. (c) The coordinates of each recording electrode. Polygraphic signals were collected from four EEG channels, two EMG channels, and a thermistor. (d) Representative hypnograms from a single group of four mice (dark and light phase recordings, 14:00–19:00 & 20:00–01:00, resp.). (e) Pairwise correlations of sleep states. In-group sleep state correlations are higher than out-group correlations, indicating in-group sleep synchrony (in-group vs. out-group, box-plot: line – median, box limits – 1st and 3rd quartile, whiskers – 1.5 × IQR, n = 120 pairs). (f) Push-pull group effects on sleep. The probability of a mouse awakening within 5 epochs (20 seconds) if it is the only mouse in a group asleep at t0 is higher than expected based on out-group measurements. Conversely, with three mice asleep at t0, the probability of one of them awakening in the same time frame is significantly lower than expected by chance (interaction of group type and number of mice, mean ± SE, n = 16 individuals).
Figure 2
Figure 2
Social dominance status predicts sleep characteristics. (a) Average percent of time spent in each sleep stage differs between subordinate (SUB, ranks gamma and delta) and dominant (DOM, ranks alpha and beta) animals, adjusted for between-group differences (approx. 4 h of recording time per individual per light phase, n = 18 individuals). (b) Baseline dominance (David’s Score rank) predicts increased group-adjusted dark phase REM sleep and decreased light phase REM sleep (n = 18 individuals). (c) Lower-ranking individuals showed higher slow-wave activity during NREM sleep, suggesting baseline dominance levels predict group-adjusted mean NREM slow-wave power (n = 18 individuals). (d) Sleep fragmentation, corrected for total sleep amount and group belonging, is increased in dominant animals compared to subordinates during the dark phase (n = 18 individuals). (e) Social dominance mediates the effects of stress on group-adjusted mean REM episode duration (n = 18 individuals). For all panels, box-plot elements are as follows: line – median, box limits – 1st and 3rd quartile, whiskers – 1.5 × IQR.

References

    1. Spoormaker VI, Montgomery P. Disturbed sleep in post-traumatic stress disorder: Secondary symptom or core feature? Sleep Med. Rev. 2008;12:169–184. doi: 10.1016/j.smrv.2007.08.008. - DOI - PubMed
    1. Richdale AL, Schreck KA. Sleep problems in autism spectrum disorders: Prevalence, nature, & possible biopsychosocial aetiologies. Sleep Med. Rev. 2009;13:403–411. doi: 10.1016/j.smrv.2009.02.003. - DOI - PubMed
    1. Steiger A, Kimura M. Wake and sleep EEG provide biomarkers in depression. J. Psychiatr. Res. 2010;44:242–252. doi: 10.1016/j.jpsychires.2009.08.013. - DOI - PubMed
    1. Weiergräber M, Henry M, Hescheler J, Smyth N, Schneider T. Electrocorticographic and deep intracerebral EEG recording in mice using a telemetry system. Brain Res. Protoc. 2005;14:154–164. doi: 10.1016/j.brainresprot.2004.12.006. - DOI - PubMed
    1. Tang X, Sanford LD. Telemetric Recording of Sleep and Home Cage Activity in Mice. Sleep. 2002;25:677–685. doi: 10.1093/sleep/25.6.677. - DOI - PubMed

Publication types