. 2019 Oct 23;10(1):4813.
doi: 10.1038/s41467-019-11891-6.

Altered dendritic spine function and integration in a mouse model of fragile X syndrome

Affiliations

Altered dendritic spine function and integration in a mouse model of fragile X syndrome

Sam A Booker et al. Nat Commun. .

Abstract

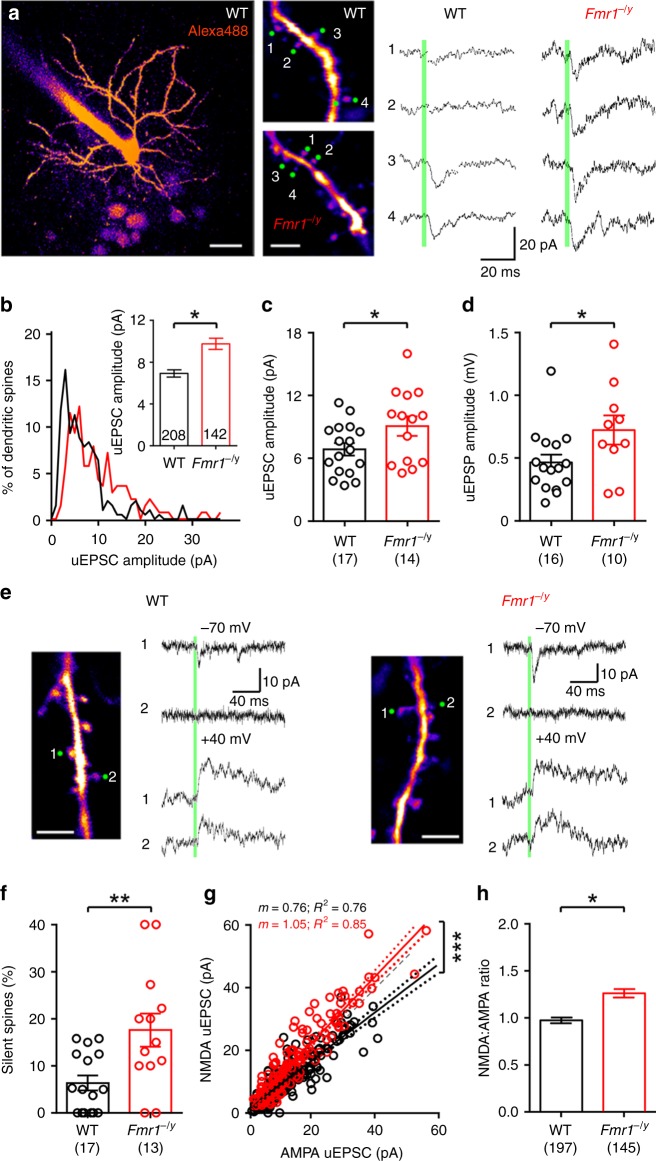
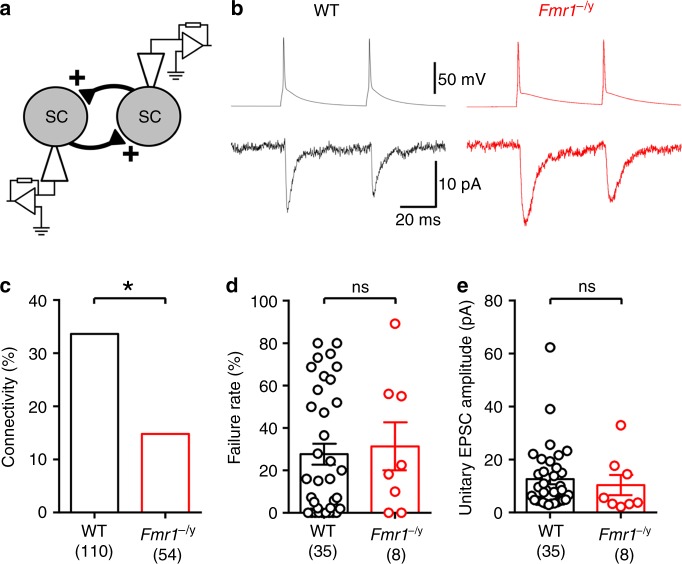
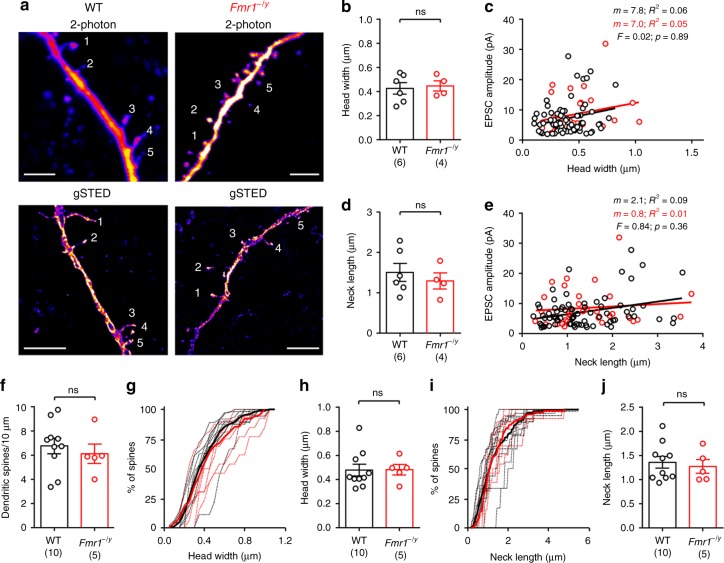
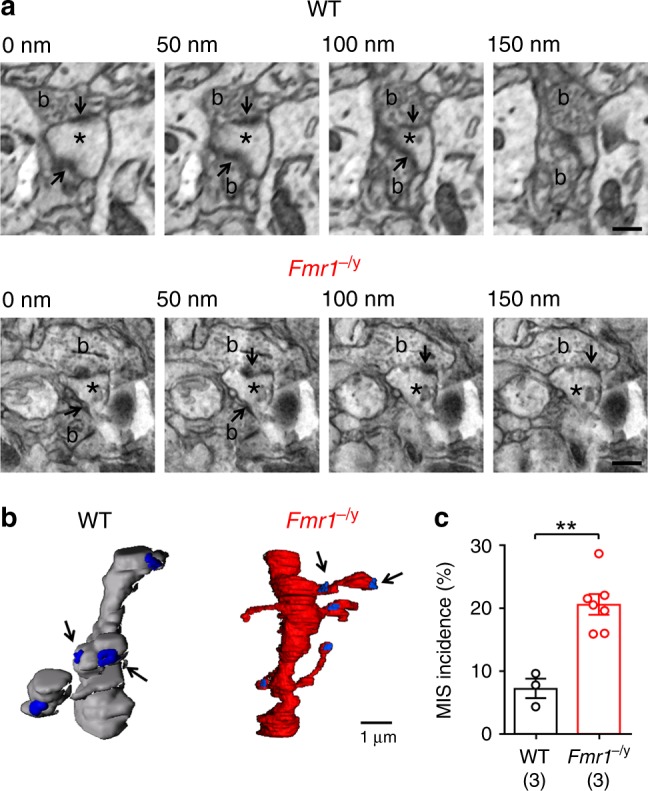
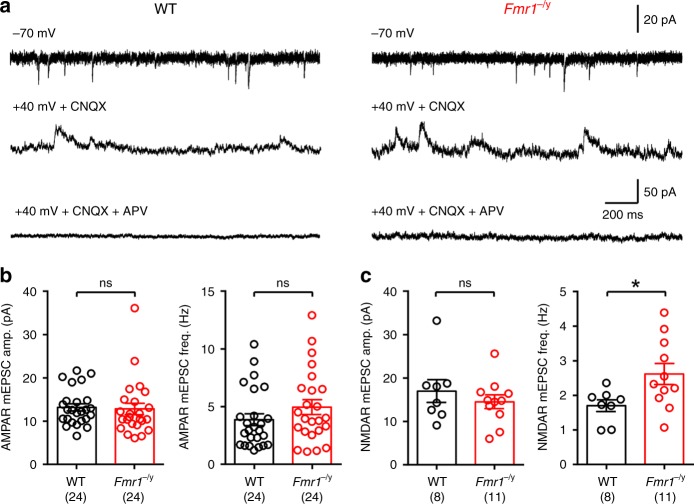
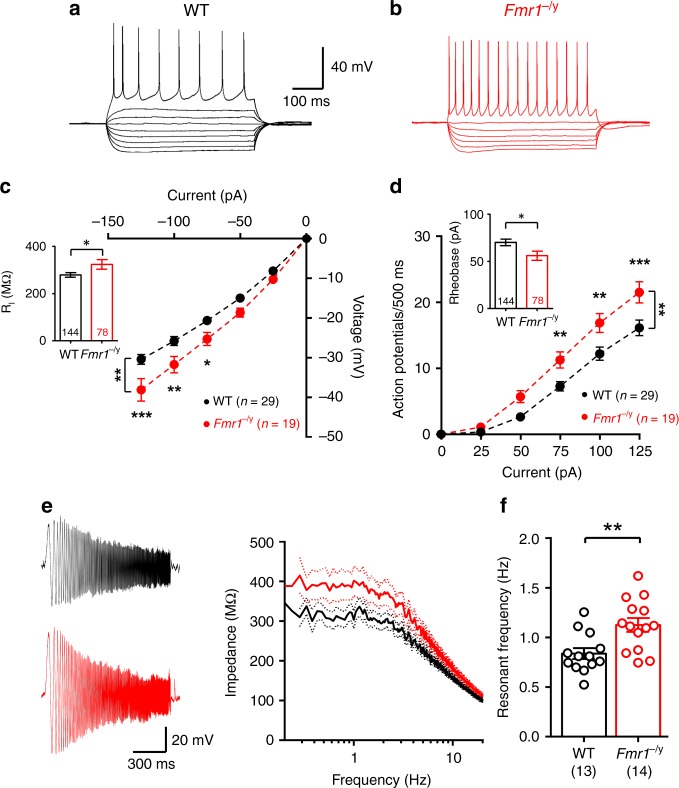
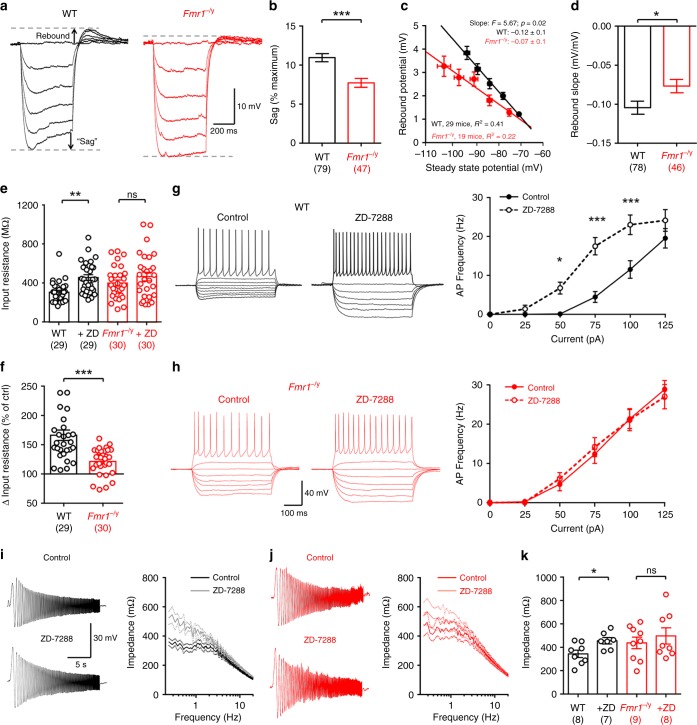
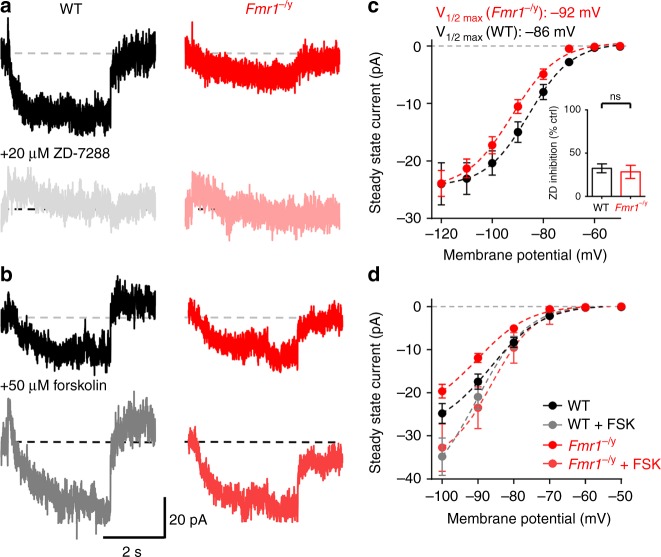
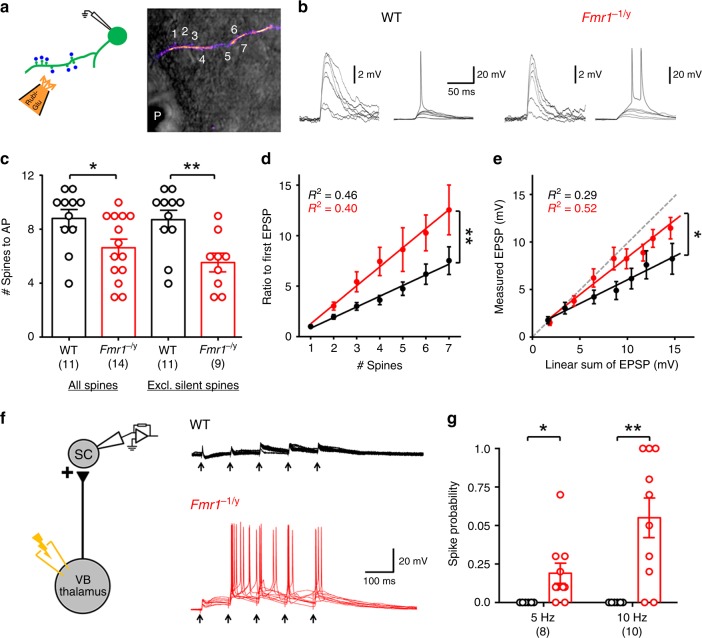
Cellular and circuit hyperexcitability are core features of fragile X syndrome and related autism spectrum disorder models. However, the cellular and synaptic bases of this hyperexcitability have proved elusive. We report in a mouse model of fragile X syndrome, glutamate uncaging onto individual dendritic spines yields stronger single-spine excitation than wild-type, with more silent spines. Furthermore, fewer spines are required to trigger an action potential with near-simultaneous uncaging at multiple spines. This is, in part, from increased dendritic gain due to increased intrinsic excitability, resulting from reduced hyperpolarization-activated currents, and increased NMDA receptor signaling. Using super-resolution microscopy we detect no change in dendritic spine morphology, indicating no structure-function relationship at this age. However, ultrastructural analysis shows a 3-fold increase in multiply-innervated spines, accounting for the increased single-spine glutamate currents. Thus, loss of FMRP causes abnormal synaptogenesis, leading to large numbers of poly-synaptic spines despite normal spine morphology, thus explaining the synaptic perturbations underlying circuit hyperexcitability.


Conflict of interest statement

The authors declare no competing interests.

Figures

Fig. 1
Fig. 1
L4 SC dendritic spines have larger uEPSCs with more silent synapses in Fmr1−/y mice. a 2-photon image of a L4 SC (left) with selected spines and AMPAR uEPSCs from WT and Fmr1−/y mice. Scale bars: 20 µm (left), 5 µm (right). b Single-spine uEPSCs from WT (black) and Fmr1−/y (red) mice shown as a histogram, with spine average shown (inset). Note that spines with no AMPA response, silent spines have not been included. c Animal average uEPSC amplitudes, excluding silent spines. Number of animals tested shown in parenthesis. d Animal average of uEPSP amplitudes. e AMPAR (upper) and NMDAR (lower) uEPSCs, illustrating silent spines. Scale: 5 µm. f Incidence of silent spines in WT and Fmr1−/y mice. g AMPAR and NMDAR uEPSCs for all spines, with NMDA/AMPA ratio (WT: 0.76 ± 0.03; Fmr1−/y; 1.05 ± 0.04; d.f.: 1, 331; F = 37.4; p < 0.0001; F-test). h Average NMDA/AMPA ratio plotted for all spines. Statistics shown: *p < 0.05, **p < 0.01, from LMM (b, d, h), unpaired t-test (c, f) and sum-of-least-squares F-test (g). Plots of individual spine data for panels c (inset) and h can be found in Supplementary Fig. 4. All data are shown as mean ± SEM and source data for all plots are provided as a Source Data file
Fig. 2
Fig. 2
Typical EPSC amplitude at unitary connections between L4 SCs. a Schematic paired recordings between synaptically coupled L4 SCs. b Representative presynaptic action potentials (top) produced unitary EPSCs in the second L4 SC (lower), from WT (black) and Fmr1−/y (red) mice. c Synaptic connectivity is reduced between L4 SCs in the Fmr1−/y mouse (d.f.: 162; p = 0.015; Fisher’s exact test; 110 pairs from 13 mice for WT mice and 54 pairs from 7 mice in Fmr1−/y mice were tested. d Failure rate was not different between genotypes when a connection was present. e Unitary EPSC amplitudes from L4 SC synapses were not different between genotypes. Statistics shown: ns p > 0.05, *p < 0.05 from Fisher’s exact test (c) and LMM (d, e). All data are shown as mean ± SEM and source data for all plots are provided as a Source Data file
Fig. 3
Fig. 3
Dendritic spines show no difference in nanoscale morphology, or structure–function relationship. a Dendrites from WT (left) and Fmr1−/y (right) mice under 2-photon microscopy (top), then post hoc STED imaging (bottom). Scale bar: 5 µm. b Average spine head width in WT (black) and Fmr1−/y (red) mice (WT: 0.43 ± 0.05; Fmr1−/y; 0.45 ± 0.04; d.f.: 8; t = 0.29; p = 0.78, T-test). Number of mice is indicated. c Comparison of spine head width and uEPSC amplitude (comparing slope: d.f.: 1, 100; F = 0.02; p = 0.89). WT spines showed a positive correlation (d.f.: 70, F = 4.27, p = 0.042, F-test). d Average spine neck length (WT: 1.52 ± 0.22; Fmr1−/y; 1.31 ± 0.20; d.f.: 8; t = 0.66; p = 0.53, T-test). e Comparison of spine neck-width and uEPSC amplitude (Slope: WT: 2.1 ± 0.8; Fmr1−/y; 0.8 ± 1.4; d.f.: 1, 101; F = 0.84; p = 0.36; F-test). f Spine density on L4 SCs (WT: 6.8 ± 0.7 spines/10 µm; Fmr1−/y: 6.1 ± 0.80 spines/10 µm; d.f.: 13; t = 0.60; p = 0.56; T-test). g Distribution of non-uncaged spine head-widths, as an average of all mice (bold) and individual mice (dashed). h Average head width of non-uncaged spines (WT: 0.48 ± 0.05 µm; Fmr1−/y: 0.48 ± 0.04 µm; d.f.: 13; U = 20.0; p = 0.59; Mann–Whitney U-test). i Distribution of spine neck length of non-uncaged spines. j Average of spine neck length in non-uncaged spines (WT: 1.36 ± 0.12 µm; Fmr1−/y: 1.27 ± 0.14 µm; d.f.: 13; U = 20.0; p = 0.55; Mann–Whitney U-test). Statistics shown: ns p > 0.05 from unpaired t-test (b, d, f, h, j) and sum-of-least-squares F-test (c, e). All data are shown as mean ± SEM and source data for all plots are provided as a Source Data file
Fig. 4
Fig. 4
L4 spines in Fmr1−/y mice form multiple synaptic contacts. a Serial electron micrographs in L4 from WT and Fmr1−/y mice, indicating spines (asterisk) contacted by multiple presynaptic boutons (b) each with a PSD (arrows); scale bar: 500 nm. b Reconstructed dendrites from WT (grey) and Fmr1−/y (red) mice, with PSDs (blue) and MIS indicated (arrows). c Incidence of MIS in WT and Fmr1−/y mice. Statistics shown: **p < 0.01 from unpaired t-test. All data are shown as mean ± SEM and source data for all plots are provided as a Source Data file
Fig. 5
Fig. 5
mEPSCs in Fmr1−/y L4 SCs show enrichment of NMDAR synapses. a mEPSCs recorded from L4 SCs for AMPAR at −70 mV (top), NMDAR at + 40 mV with CNQX (10 µM, middle), and following application of the NMDAR antagonist D-AP5 (50 µM, bottom) in the same cell; from WT (left) and Fmr1−/y (right) mice. b Quantification of AMPAR mEPSC amplitude (WT: 13.1 ± 0.8 pA; Fmr1−/y; 12.7 ± 1.3 pA) and frequency (WT: 3.9 ± 0.5 Hz; Fmr1−/y; 4.9 ± 0.6 Hz) in WT (black) and Fmr1−/y (red) mice. Number of mice indicated in parenthesis. c NMDAR mEPSC amplitude (WT: 16.9 ± 2.6 pA; Fmr1−/y; 14.4 ± 1.6 pA) and frequency (WT: 1.7 ± 0.17 Hz; Fmr1−/y; 2.6 ± 0.3) measured in WT and Fmr1−/y mice. Statistics shown: ns p > 0.05, *p < 0.05 from unpaired t-test. All data are shown as mean ± SEM and source data for all plots are provided as a Source Data file
Fig. 6
Fig. 6
Altered intrinsic physiology of L4 SCs in Fmr1−/y mice. Voltage responses to hyper- and depolarizing current steps (−125 to +125 pA, 25 pA steps, 500 ms duration) led to AP discharge in WT (a) and Fmr1−/y (b) mice. c The current–voltage response to hyperpolarizing currents with linear fit (dashed lines) in WT (black) and Fmr1−/y (red) mice. c (inset) RI measured from all L4 SCs tested. d Current–frequency plot showing AP discharge. d (inset) Average rheobase current measured in all cells. e Subthreshold membrane chirps (0.2–20 Hz, 50 pA, 20 s duration) in L4 SCs from WT (black) and Fmr1−/y mice. Right, frequency–impedance plot for both genotypes ± SEM, shown on a logarithmic frequency scale. f Resonant frequency of L4 SCs from both genotypes. Statistics shown: *p < 0.05, **p < 0.01, ***p ± < 0.001, from LMM (c and d insets, f) and two-way ANOVA (c and d, main). Summary plots of all cells recorded for c (inset) and d (inset) can be found in Supplementary Fig. 5. All data are shown as mean ± SEM and source data for all plots are provided as a Source Data file
Fig. 7
Fig. 7
Ih is reduced in L4 SCs from Fmr1−/y mice, resulting in hyperexcitability. a Hyperpolarizing steps in L4 SCs (0 to −125 pA, 25 pA steps, 500 ms duration) with voltage “sag” and rebound potential indicated, as measured in WT (black, left) and Fmr1−/y mice (red, right). b Quantification of voltage sag expressed as % of maximum voltage for WT and Fmr1−/y L4 SCs c plot of rebound potential, as a function of steady-state voltage for WT and Fmr1−/yS L4 SCs, fitted with linear regression and with fit values displayed. d quantification of the rebound slope of individual L4 SCs for both genotypes. e RI measured before and after bath application of the Ih blocker ZD-7288 (ZD; 20 µM) in WT and Fmr1−/y L4 SCs. f Change in RI change following ZD application (as 100% of control levels). g (left) Hyper- to depolarising current steps (−125 to + 125 pA, 25 pA steps, 500 ms duration) in WT L4 SCs before and after ZD application. g (right) Current–frequency plot of AP discharge before (solid lines) and after (dashed lines) ZD application. h The same analysis as in (g), but in Fmr1−/y L4 SCs. i Subthreshold membrane chirps (0.2–20 Hz, 50 pA, 20 s duration) and current–impedance plot for WT L4 SCs before (black) and after (grey) ZD application. j The same data as in (f), but in Fmr1−/y mice. k Impedance measured at peak resonant frequency in WT and Fmr1−/y L4 SCs before and after ZD (+ZD) application. Statistics shown: ns p > 0.05, *p < 0.05, **p < 0.01, ***p < 0.001, from LMM (b, d, e, f, k). Summary plots of all data shown in (b) and (d) can be found in Supplementary Fig. 7. All data are shown as mean ± SEM and source data for all plots are provided as a Source Data file
Fig. 8
Fig. 8
Altered Ih voltage sensitivity in Fmr1−/y L4 SCs, due to reduced cyclic-AMP. a Subtracted Ih traces recorded during a −50 mV step from −50 mV holding potential for WT (black) and Fmr1−/y (red) L4 SCs, and following ZD application (grey, light red, respectively). b Ih measured over the range of −50 to −120 mV for both WT and Fmr1−/y L4 SCs fitted with a sigmoidal curve (dashed lines). V1/2 max is indicated. Inset, Ih was blocked to a similar degree by ZD in both genotypes when tested on steps to −100 mV. c Ih recorded before (top) and after (bottom) application of forskolin. d Quantification of Ih responses over the range of −50 to −100 mV, fitted with a sigmoidal curve. All data are shown as mean ± SEM and source data for all plots are provided as a Source Data file
Fig. 9
Fig. 9
Enhanced dendritic integration of L4 SCs in Fmr1−/y mice. a Schema of near-simultaneous glutamate uncaging (Rubi-Glu) at multiple spines (blue dots/numbers). b Near-simultaneous glutamate uncaging produced subthreshold (inset, right) and suprathreshold uEPSPs (inset, left) along dendrites. c The number of spines required to evoke an AP, from all spines (left; WT: 8.8 ± 0.7; Fmr1−/y; 6.6 ± 0.6) and excluding “silent spines” (right; WT: 8.7 ± 0.7; Fmr1−/y; 5.6 ± 0.7). d Summation of near-simultaneous subthreshold uEPSPs normalized to the first EPSP in WT (black) and Fmr1−/y (red) L4 SCs (Slope: WT: 1.1 ± 0.13; Fmr1−/y; 1.9 ± 0.2; d.f.: 1, 170; F = 8.98; p = 0.003; F-test). e Summating uEPSPs plotted against the expected linear sum. Unity is indicated (grey). f Electrical stimulation of TCA at low frequency 10 Hz is shown. g Average spike probability in response to 5 and 10 Hz stimulation. Statistics shown: *p < 0.05, **p < 0.01. All data are shown as mean ± SEM and source data for all plots are provided as a Source Data file

References

    1. Contractor A, Klyachko VA, Portera-Cailliau C. Altered neuronal and circuit excitability in fragile X syndrome. Neuron. 2015;87:699–715. doi: 10.1016/j.neuron.2015.06.017. - DOI - PMC - PubMed
    1. Pfeiffer BE, Huber KM. Fragile X mental retardation protein induces synapse loss through acute postsynaptic translational regulation. J. Neurosci. 2007;27:3120–3130. doi: 10.1523/JNEUROSCI.0054-07.2007. - DOI - PMC - PubMed
    1. Irwin SA, Galvez R, Greenough WT. Dendritic spine structural anomalies in fragile-X mental retardation syndrome. Cereb. Cortex. 2000;10:1038–1044. doi: 10.1093/cercor/10.10.1038. - DOI - PubMed
    1. Brager DH, Johnston D. Channelopathies and dendritic dysfunction in fragile X syndrome. Brain Res. Bull. 2014;103:11–17. doi: 10.1016/j.brainresbull.2014.01.002. - DOI - PMC - PubMed
    1. Comery TA, et al. Abnormal dendritic spines in fragile X knockout mice: maturation and pruning deficits. Proc. Natl Acad. Sci. USA. 1997;94:5401–5404. doi: 10.1073/pnas.94.10.5401. - DOI - PMC - PubMed

Publication types

MeSH terms

Substances