. 2019 Oct;574(7779):543-548.
doi: 10.1038/s41586-019-1644-y. Epub 2019 Oct 23.

The microbiota regulate neuronal function and fear extinction learning

Affiliations

The microbiota regulate neuronal function and fear extinction learning

Coco Chu et al. Nature. 2019 Oct.

Abstract

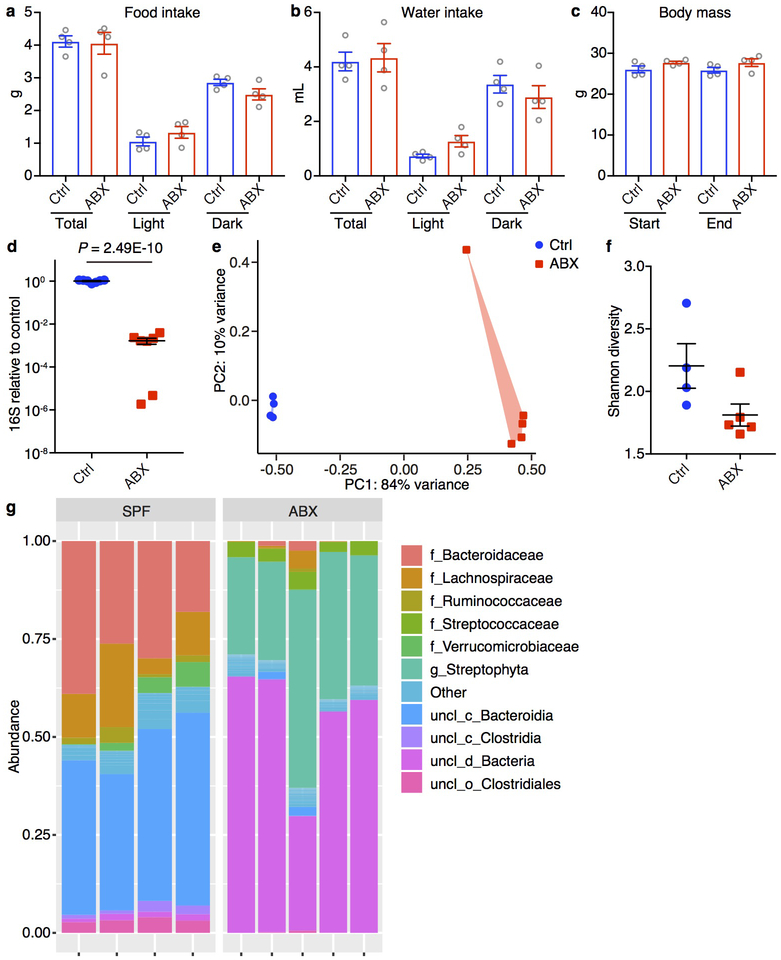
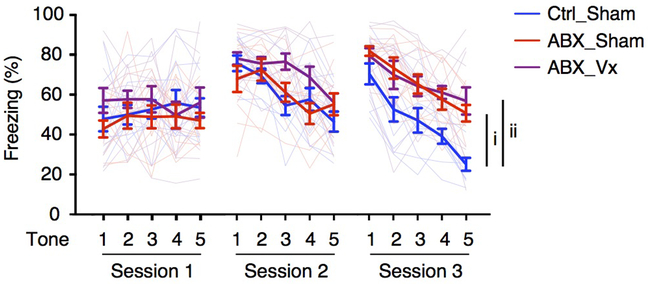
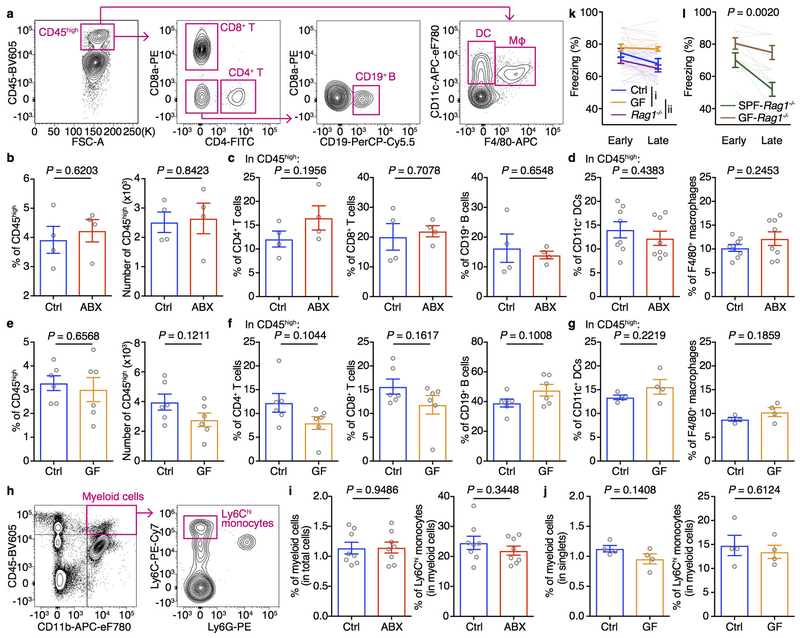
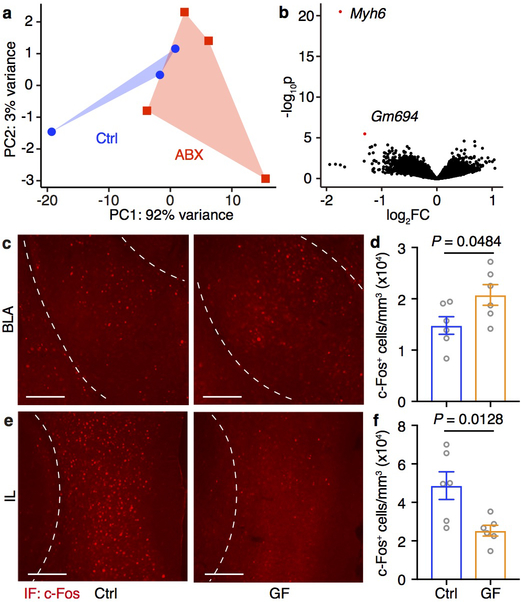
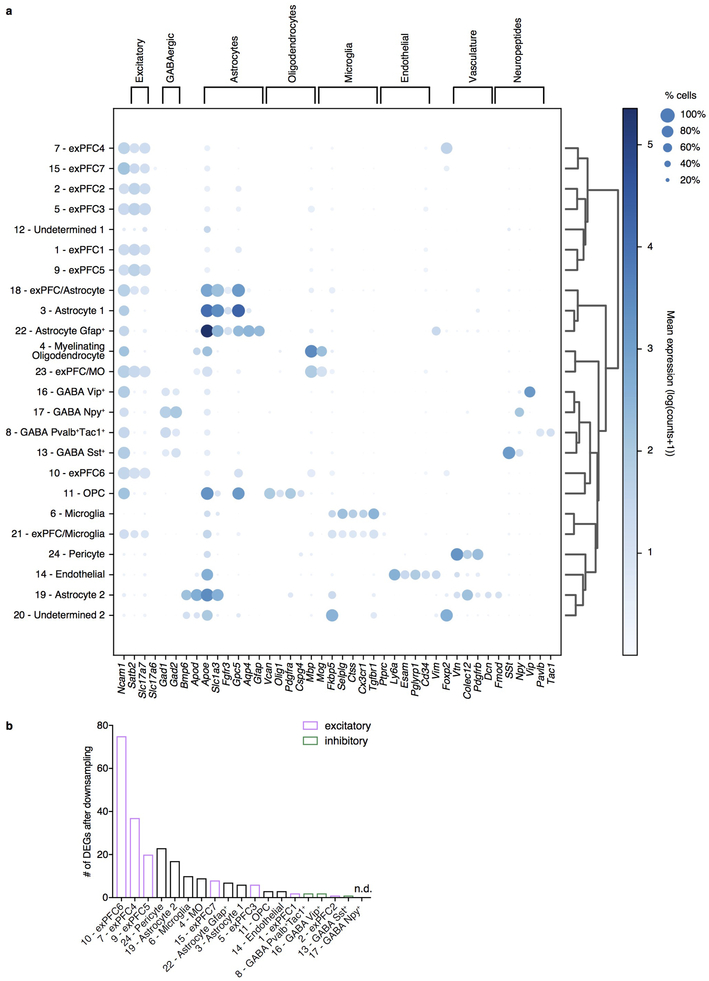
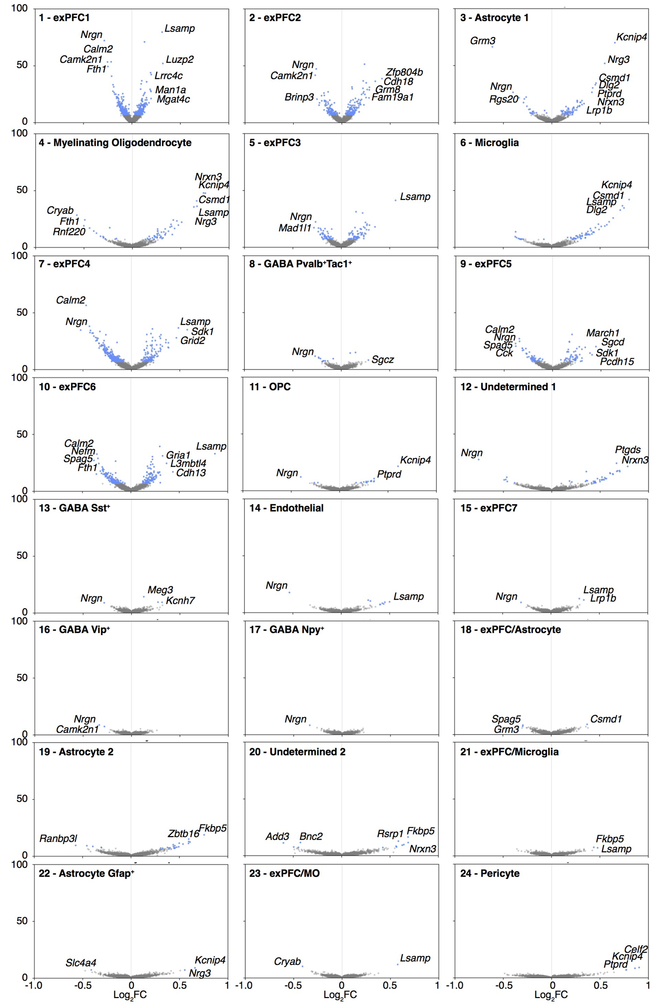
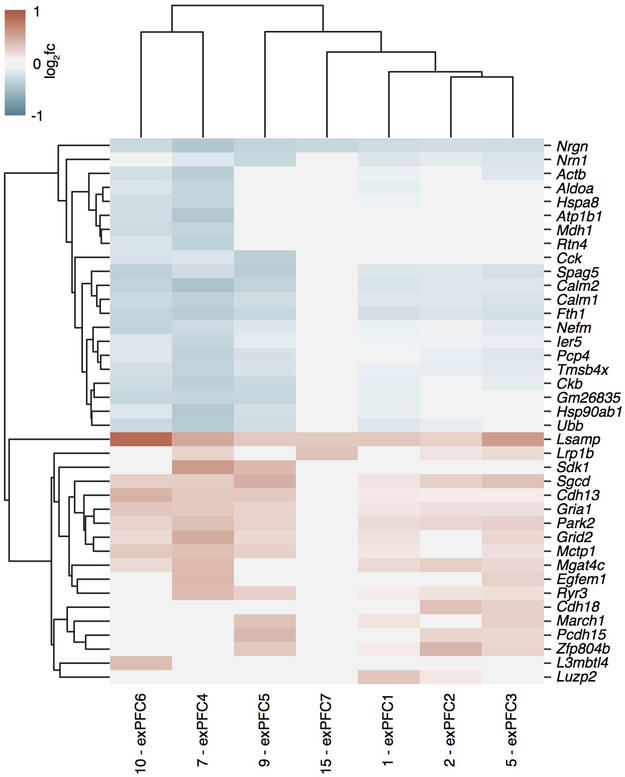
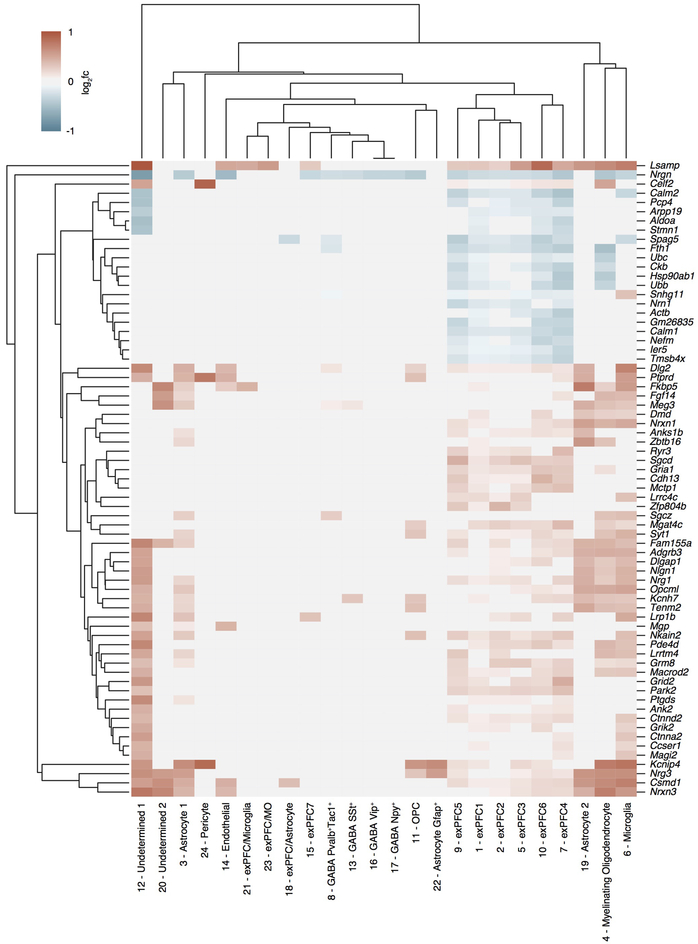
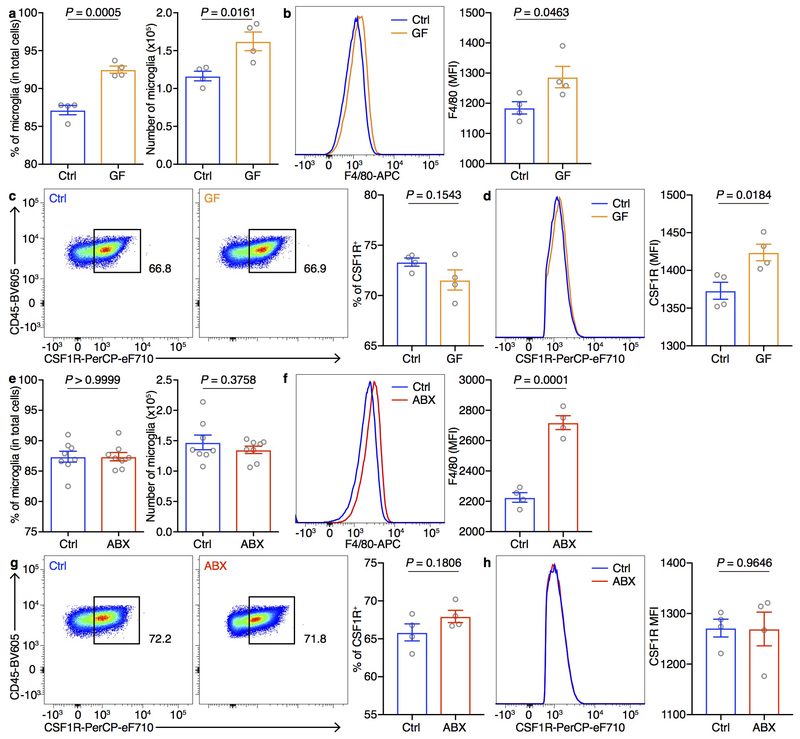
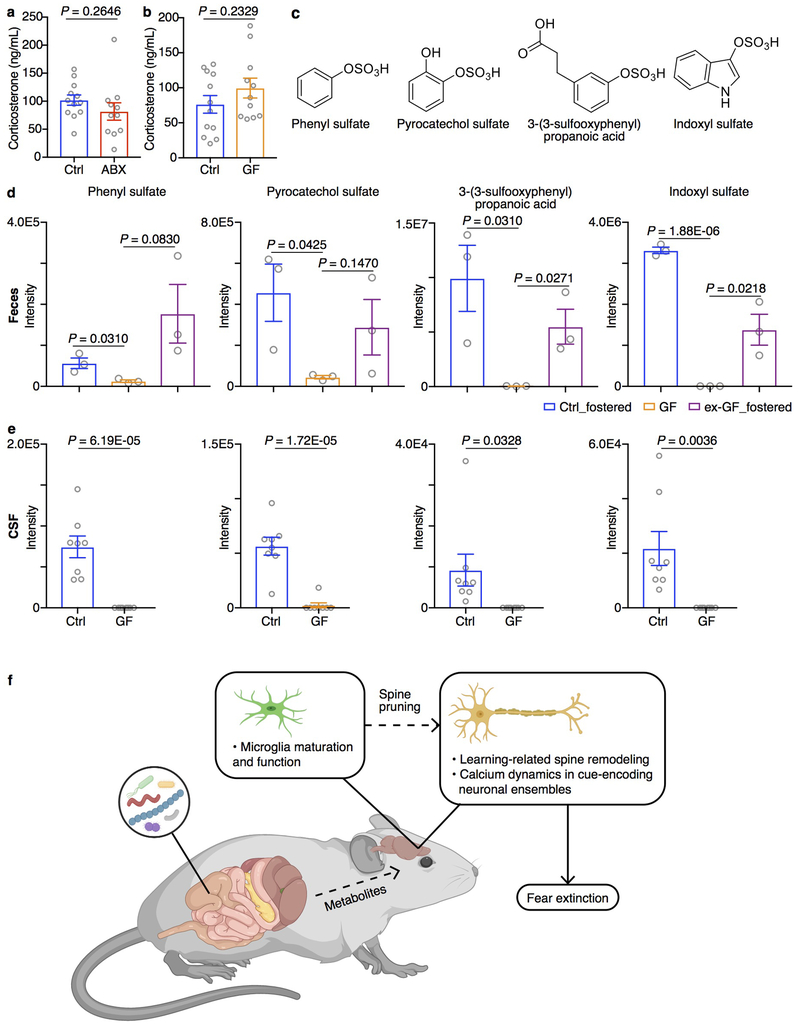
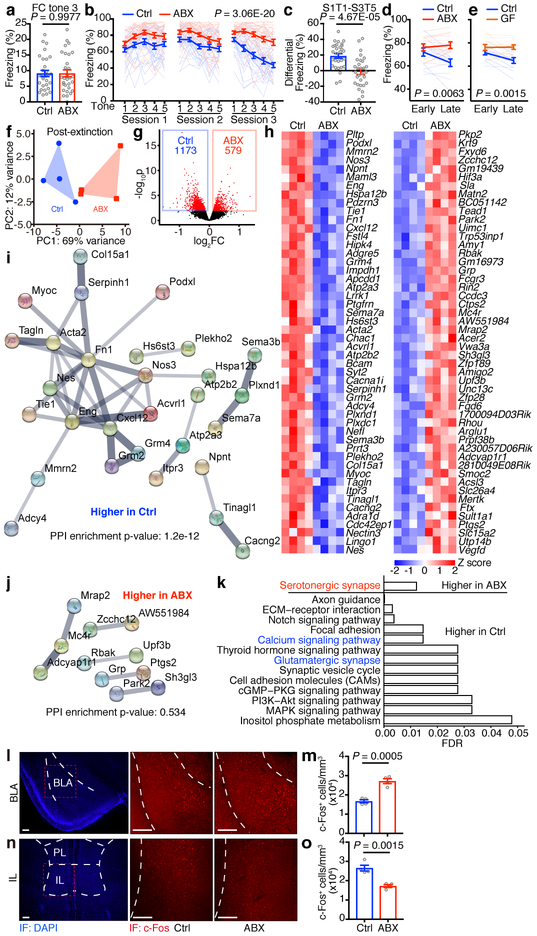
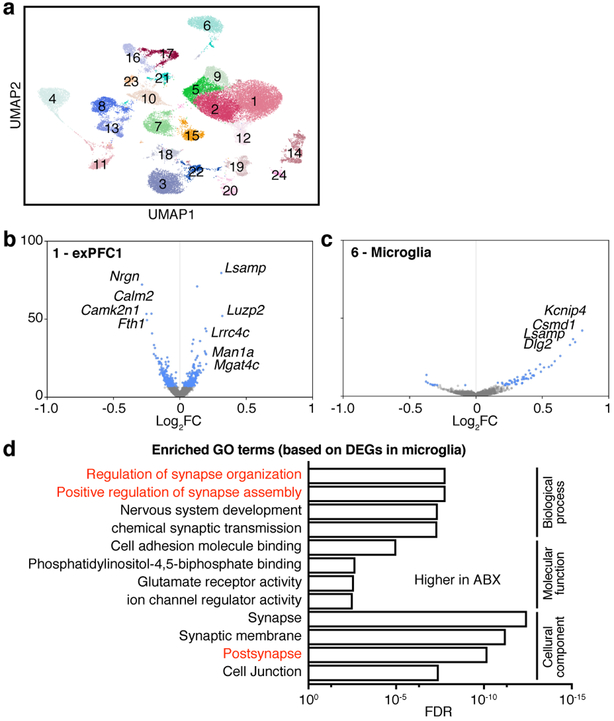
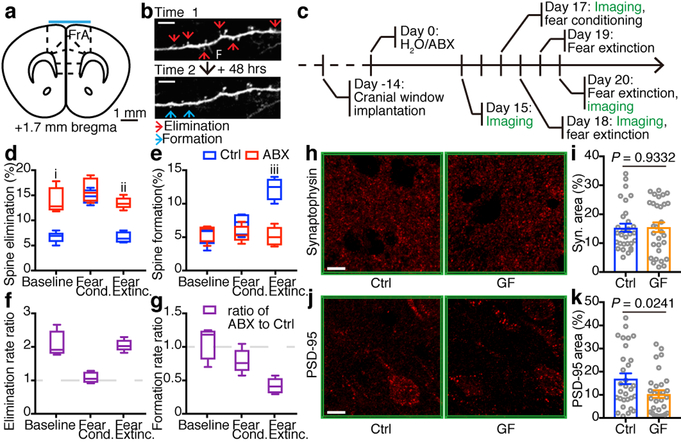
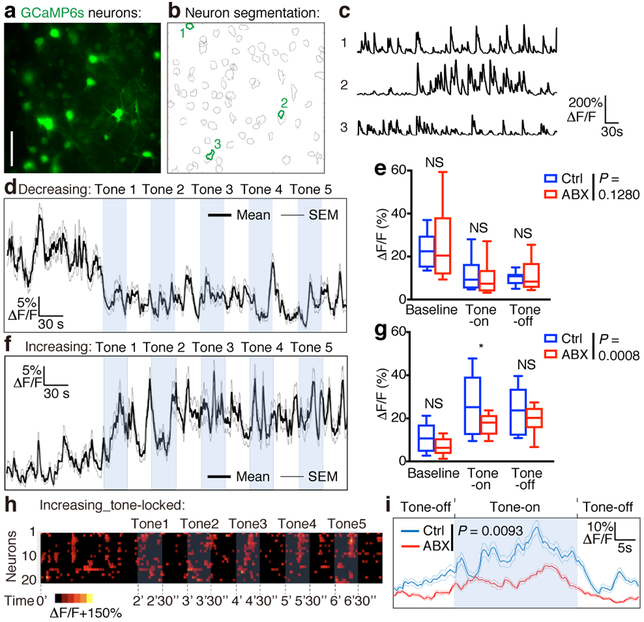
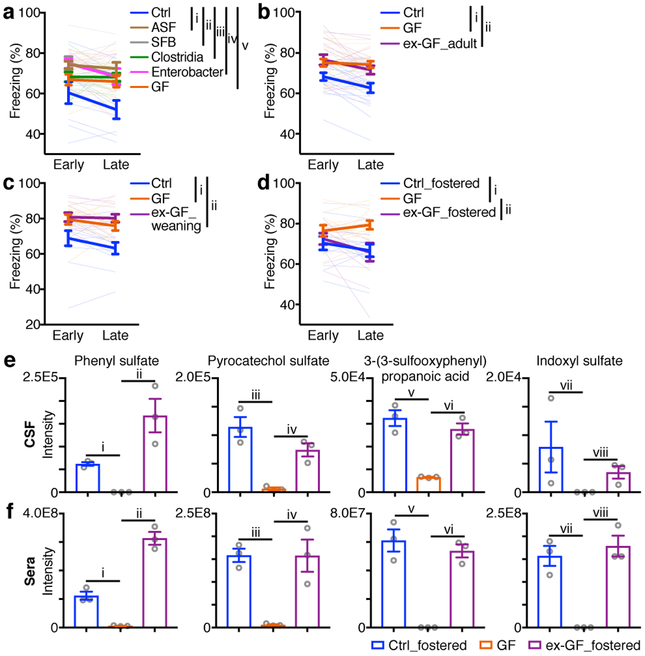
Multicellular organisms have co-evolved with complex consortia of viruses, bacteria, fungi and parasites, collectively referred to as the microbiota1. In mammals, changes in the composition of the microbiota can influence many physiologic processes (including development, metabolism and immune cell function) and are associated with susceptibility to multiple diseases2. Alterations in the microbiota can also modulate host behaviours-such as social activity, stress, and anxiety-related responses-that are linked to diverse neuropsychiatric disorders3. However, the mechanisms by which the microbiota influence neuronal activity and host behaviour remain poorly defined. Here we show that manipulation of the microbiota in antibiotic-treated or germ-free adult mice results in significant deficits in fear extinction learning. Single-nucleus RNA sequencing of the medial prefrontal cortex of the brain revealed significant alterations in gene expression in excitatory neurons, glia and other cell types. Transcranial two-photon imaging showed that deficits in extinction learning after manipulation of the microbiota in adult mice were associated with defective learning-related remodelling of postsynaptic dendritic spines and reduced activity in cue-encoding neurons in the medial prefrontal cortex. In addition, selective re-establishment of the microbiota revealed a limited neonatal developmental window in which microbiota-derived signals can restore normal extinction learning in adulthood. Finally, unbiased metabolomic analysis identified four metabolites that were significantly downregulated in germ-free mice and have been reported to be related to neuropsychiatric disorders in humans and mouse models, suggesting that microbiota-derived compounds may directly affect brain function and behaviour. Together, these data indicate that fear extinction learning requires microbiota-derived signals both during early postnatal neurodevelopment and in adult mice, with implications for our understanding of how diet, infection, and lifestyle influence brain health and subsequent susceptibility to neuropsychiatric disorders.


Conflict of interest statement

Competing interests

A.R. is an SAB member of ThermoFisher Scientific and Syros Pharmaceuticals and a co-founder and equity holder of Celsius Therapeutics. D.A. has contributed to scientific advisory boards at MedImmune, Pfizer, FARE, and the KRF. The other authors declare no competing interests.

Figures

Extended Data Figure 1.
Extended Data Figure 1.. Antibiotic treatment results in bacterial community restructuring.
a-c, Food intake (a), water intake (b) and weight gain (c) of the mice measured by the Promethion Metabolic Cage System. Antibiotic treatment was started 2 weeks prior to the experiment and continued for the duration of the experiment. For food (a) and water intake (b), the mice were acclimated to the system for the first 4 days followed by 1 day of data collection. Body mass (c) of the mice were measured at the beginning of (Start) and the end (End) of the 5-day experiment. n = 4/group. Data are mean ± SEM. Total, full day. Light/Dark, 12-hour light/dark cycle. d, 16S rDNA gene copies as quantified by real-time RT-PCR from stool pellets collected from Ctrl or ABX mice. Data are pooled from two independent experiments. n = 7/group. Data are mean ± SEM. Unpaired two-sided t tests were used. e-g, Principal coordinates analysis (PCoA) (e), alpha-diversity Shannon index (f) and taxonomic classification (g) of 16S rDNA in stool pellets collected from Ctrl or ABX mice. Ctrl n = 4, ABX n = 5. For PCoA plot PERMANOVA: F = 33.579, Df = 1, P = 0.00804. For phylogenetic classification ‘f_’, ‘g_’, ‘uncl_c_’, ‘uncl_d_’ and ‘uncl_o_’ stand for ‘family_’, ‘genus_’, ‘unclassified_class_’, ‘unclassified_domain_’ and ‘unclassified_order_’, respectively. ‘uncl_d_Bacteria’ matches exactly to mitochondria or chloroplasts, most likely from the food. Data are mean ± SEM in f.
Extended Data Figure 2.
Extended Data Figure 2.. Antibiotic-treated mice retain deficits in extinction learning after vagotomy.
Fear extinction in Ctrl_Sham, ABX_Sham and ABX_Vx mice over the course of 3 days/sessions. Ctrl_Sham n = 10, ABX_Sham n = 10, ABX_Vx n = 12. Data are mean ± SEM. The AUC was calculated for each mouse within each group, followed by unpaired two-sided t test between groups. P values are as follows: i = 2.57E-07, ii = 9.21E-08. Vx, vagotomized.
Extended Data Figure 3.
Extended Data Figure 3.. Comparable percentages and numbers of CD45high leukocytes in the brain of Control and ABX/GF mice.
a, Gating strategy of T cells, B cells, dendritic cells (DCs) and macrophages (Mφ) in the brain. b, Population frequencies and numbers of brain-resident CD45high leukocytes in Ctrl and ABX mice. c-d, Population frequencies of CD4+ T cells, CD8+ T cells, CD19+ B cells (c), CD11c+ DCs and F4/80+ macrophages (d) gated on brain-resident CD45high leukocytes in Ctrl and ABX mice. e, Population frequencies and numbers of brain-resident CD45high leukocytes in Ctrl and GF mice. f-g, Population frequencies of CD4+ T cells, CD8+ T cells, CD19+ B cells (f), CD11c+ DCs and F4/80+ macrophages (g) gated on brain-resident CD45high leukocytes in Ctrl and GF mice. h, Gating strategy of total myeloid cells and Ly6Chi monocytes in the brain. i,j, Population frequencies of total myeloid cells and Ly6Chi monocytes gated on brain-resident CD45high leukocytes in Ctrl and ABX (i) or GF (j) mice. Data in b, c, g and j are representative of three independent experiments. n = 4/group. Data in d and i are pooled from two independent experiments. n = 8/group. Data in e and f are pooled from two independent experiments. n = 6/group. Data are mean ± SEM. Unpaired two-sided t tests were used. P values are indicated on the figure. k, Fear extinction of Ctrl, GF and Rag1−/− mice in the single-session 30-tone fear extinction assay. Data are pooled from two independent experiments. Ctrl n = 18, GF n = 16, Rag1−/− n = 18. Data are mean ± SEM. The AUC was calculated for each mouse within each group followed by one-way ANOVA with Tukey’s multiple comparisons test. F (2, 49) = 8.558. P = 0.0006. Adjusted P values are as follows: i = 0.0343, ii = 0.0004. l, Fear extinction of SPF-Rag1−/− and GF-Rag1−/− mice in the single-session 30-tone fear extinction assay. n = 7/group. Data are mean ± SEM. The AUC was calculated for each mouse within each group followed by unpaired two-sided t test between groups. P value is indicated on the figure.
Extended Data Figure 4.
Extended Data Figure 4.. Comparable transcriptomes of mPFCs dissected from Control and ABX mice in the absence of fear conditioning and extinction.
a, Principle component analysis (PCA) of genome-wide transcriptional profiles of mouse mPFC in the absence of fear conditioning and extinction. Ctrl n = 3, ABX n = 4. PERMANOVA test was used: F = 2.52, Df = 1, P = 0.17. b, Volcano plot of differential expression between Ctrl (negative log2(fold change (FC))) and ABX (positive log2(FC)) groups. Differentially expressed genes (defined as False Discovery Rate (FDR) < 0.1, DESeq2 Wald test) are shown in red. c-f, Immunofluorescence staining of c-Fos (red) (c,e) and the density of c-Fos+ neurons (d,f) in the BLA (c,d) or IL (e,f) of Ctrl and GF mice 90 min after classical fear extinction session 3. Data are pooled from two independent experiments. n = 6/group. Data are mean ± SEM. Unpaired two-sided t tests were used. P values are indicated on the figure. BLA, basolateral amygdala; PL, prelimbic; IL, infralimbic. Scale bar, 200 μm.
Extended Data Figure 5.
Extended Data Figure 5.. Gene expression patterns of individual cell subsets in mPFC.
a, Proportion of expressing cells (dot size) and mean normalized expression of representative marker genes (columns) associated with the cell clusters of Fig. 2a (rows). Clusters are labeled with post facto annotation based on known marker genes. Ambiguous clusters expressing multiple canonical markers across cell types are annotated with both, e.g. exPFC/Astrocyte, and is likely due to doublets. b, Number of significantly differentially expressed genes (z-test calculated on coefficients of mixed linear model, Bonferroni-corrected P<10−7) by cluster after downsampling, ranked by highest to lowest (clusters of doublets and undetermined annotations not included). exPFC = glutamatergic excitatory neurons from the PFC, GABA = GABAergic interneurons, OPC = oligodendrocyte progenitor cells, MO = myelinating oligodendrocyte.
Extended Data Figure 6.
Extended Data Figure 6.. Differential gene expression between Control and ABX groups in individual clusters of mPFC.
Differential expression of ABX versus Ctrl (log2(fold change), x axis) in each cluster in Fig. 2a and the associated significance (-log10(P-value), y axis; linear regression, Methods). Blue: genes significantly differentially expressed (z-test calculated on coefficients of mixed linear model, Bonferroni-corrected P<10−7). exPFC = glutamatergic excitatory neurons from the PFC, GABA = GABAergic interneurons, OPC = oligodendrocyte progenitor cells, MO = myelinating oligodendrocyte.
Extended Data Figure 7.
Extended Data Figure 7.. Differentially expressed genes of ABX vs. Control mPFC samples shared by all excitatory neuronal subsets.
Mean fold change in expression in excitatory neurons (columns) in Fig. 2a of genes (rows) that were significantly differentially expressed (z-test calculated on coefficients of mixed linear model, Bonferroni-corrected P<10−7) in at least 2 of these clusters, and with absolute(log2fc) >= 0.31 in at least one cluster.
Extended Data Figure 8.
Extended Data Figure 8.. Differentially expressed genes of ABX versus Control mPFC samples shared by multiple cell types.
Mean fold change in expression across all cell clusters (columns) in Fig. 2a of genes (rows) that were significantly differentially expressed (z-test calculated on coefficients of mixed linear model, Bonferroni-corrected P<10−7) in at least 4 clusters, and with absolute(log2fc) >= 0.31 in at least one cluster.
Extended Data Figure 9.
Extended Data Figure 9.. Microglia in GF and ABX mice exhibit a developmentally immature phenotype.
a, Population frequencies and numbers of microglia in Ctrl and GF mice. b, Representative flow cytometry histogram and mean fluorescence intensity (MFI) of F4/80 staining on microglia from Ctrl and GF mice. c, Representative flow cytometry plots and population frequencies of CSF1R+ microglia in Ctrl and GF mice. d, Representative flow cytometry histogram and MFI of CSF1R expression gated on CSF1R+ microglia from Ctrl and GF mice. Data in a-d are representative of three independent experiments. n = 4/group. e, Population frequencies and numbers of microglia in Ctrl and ABX mice. f, Representative flow cytometry histogram and MFI of F4/80 staining on microglia from Ctrl and ABX mice. g, Representative flow cytometry plots and population frequencies of CSF1R+ microglia in Ctrl and ABX mice. h, Representative flow cytometry histogram and MFI of CSF1R expression gated on CSF1R+ microglia from Ctrl and ABX mice. Data in e are pooled from two independent experiments. n = 8/group. Data in f-h are representative of two independent experiments. n = 4/group. Data are mean ± SEM. Unpaired two-sided t tests were used. P values are indicated on the figure.
Extended Data Figure 10.
Extended Data Figure 10.. Downregulation of the metabolites in GF mice.
a, ELISA quantification of plasma corticosterone in Ctrl and ABX mice. Data are pooled from three independent experiments. Ctrl n=12. ABX n = 11. b, ELISA quantification of plasma corticosterone in Ctrl and GF mice. Data are pooled from three independent experiments. Ctrl n = 12. GF n = 11. Data are mean ± SEM. c, Structures of phenyl sulfate, pyrocatechol sulfate, 3-(3-sulfooxyphenyl)propanoic acid and indoxyl sulfate. d, Relative abundances of phenyl sulfate, pyrocatechol sulfate, 3-(3-sulfooxyphenyl)propanoic acid and indoxyl sulfate in fecal samples from Ctrl_fostered, GF and ex-GF_fostered mice as determined by LC-MS. n = 3/group. e, Relative abundances of phenyl sulfate, pyrocatechol sulfate, 3-(3-sulfooxyphenyl)propanoic acid and indoxyl sulfate in cerebrospinal fluid (CSF) samples from Ctrl and GF mice as determined by LC-MS. Data are representative of two independent experiments n = 8/group. Data are mean ± SEM. Unpaired two-sided t tests were used. P values are indicated on the figure. f, A schematic representation of the microbiota-gut-brain axis in fear extinction learning. Our data inform a model whereby alterations in the microbiota and their metabolites influence neuronal function and learning-related plasticity, which may be due to altered microglia-mediated synaptic pruning, and subsequently regulate fear extinction behavior.
Figure 1.
Figure 1.. ABX and GF mice are less prone to fear extinction.
a-c, Acquisition of fear conditioning (FC) (a), fear extinction over the course of 3 days/sessions (b) and after three days (c) in Ctrl and ABX mice. S, session. T, tone. d,e, Fear extinction of Ctrl versus ABX (d) or Ctrl versus GF (e) mice in the single-session 30-tone fear extinction assay. Data in (a-c) are pooled from two independent experiments, n = 30/group. Data in (d,e) are pooled from two independent experiments. n = 12/group. Data are mean ± SEM. Unpaired two-sided t tests were used in (a,c). The area under the curve (AUC) was calculated for each mouse within each group in (b,d,e), followed by unpaired two-sided t test between groups. f, Principle component analysis (PCA) of mouse mPFC transcriptome post fear extinction. n = 4/group. PERMANOVA: F = 5.00, Df = 1, P = 0.027. g, Volcano plot of differential expression of ABX versus Ctrl groups in (f). Red dots: differentially expressed genes (DESeq2 Wald test, FDR < 0.1). FC, fold change. h, Heatmaps showing the top 50 most significantly downregulated or upregulated genes in (g). Lowly-expressed genes with mean normalized counts in the bottom 20th percentile were excluded. i,j, STRING network visualization of the genes in (h). Edges represent protein-protein associations. Disconnected nodes were excluded. k, Significantly enriched KEGG pathways based on all differentially expressed genes in (g). l-o, Immunofluorescence staining (l,n) and the density of c-Fos+ neurons (m,o) in the BLA (l,m) or IL (n,o) of Ctrl and ABX mice after fear extinction session 3. Data are representative of two independent experiments. n = 4/group. Data are mean ± SEM. Unpaired two-sided t tests were used. BLA, basolateral amygdala; PL, prelimbic; IL, infralimbic. Scale bar, 200 μm.
Figure 2.
Figure 2.. Excitatory neurons and microglia are affected in ABX mice.
a, Single nucleus profiles colored by cell type (see Extended Data Fig. 5 for annotations). n = 2/group. b,c, Differentially expressed genes (blue dots: z-test calculated on coefficients of mixed linear model, Bonferroni-corrected P<10−7) of ABX versus Ctrl in excitatory neuron subset 1 (exPFC1) (b) or microglia (c). d, GO terms significantly enriched among the differentially expressed genes in microglial cluster in (c).
Figure 3.
Figure 3.. Defective extinction learning-related dendritic spine formation in ABX mice
a, Diagrammatic representation of a coronal section of mPFC showing the imaging site (cyan bar). FrA, frontal association cortex. b, Example images of neuronal dendritic branch segments at two consecutive imaging time points. Red arrows, spine elimination. Blue arrows, spine formation. Scale bar, 5 μm. F, filopodia. c, Timeline of transcranial two-photon spine imaging. d,e, Percentage of spine elimination (d) and formation (e) at baseline, during fear conditioning and during fear extinction, respectively. f,g, Ratio of ABX to Ctrl on spine elimination rate (f) and spine formation rate (g). Data in (d-g) are pooled from three independent experiments, n = 5/group. Center line, median; box, 25th and 75th percentiles; whiskers, mean to max. Unpaired two-sided t tests were used in (d,e). P values: i, 0.0010. ii, 4.38E-05. Iii, 0.0002. h-k, Immunofluorescence staining and the area of synaptophysin (h,i) or PSD-95 (i,k) in the mPFC of Ctrl and GF mice. Data are pooled from two independent experiments. n = 6/group. Each symbol represents one region of interest (ROI). 5 ROIs per mouse. Data are mean ± SEM. Unpaired two-sided t tests were used. Scale bar, 10 μm.
Figure 4.
Figure 4.. Defective ensemble calcium dynamics in the mPFC of ABX mice.
a, Example false-color image (mean projection over time) of GCaMP6s-expressing neurons in mPFC. Scale bar, 50 μm. b, Segmentation of the neurons in (a). c, Neuronal activity (ΔF/F) extracted from the 3 example neurons outlined in (b). d-g, Population activity trace (mean ΔF/F ± SEM) for neurons exhibiting decreased (d) or increased (f) activity during tone presentations in fear extinction session 3. Mean activity (ΔF/F) during each task epoch (baseline, tone-on, tone-off) (e) for the neuronal population depicted in (d) presents a significant decrease in activity (repeated measures ANOVA: main effect of time: F(10,1600) = 3.138, P = 0.007) but no significant difference between groups (group-by-time interaction: F(10,1600) = 2.736, P = 0.1280). NS, not significant (baseline, 0.285; tone-on, 0.595; tone-off, 0.578). Mean activity (ΔF/F) during each task epoch (g) for the neuronal population depicted in (f) presents a significant increase in activity (repeated measures ANOVA: main effect of time: F(10,1770) = 4.945, P < 0.0001) and a significant group-by-time interaction (F(10,1770) = 3.806, P = 0.0008). *, 0.013, significant group difference in post-hoc contrast. NS, not significant (baseline, 0.128; tone-off, 0.601). Center line, median; box, 25th and 75th percentiles; whiskers, mean to max in (e,g). h, Raster plot of neuronal activity for cells that encoded the timing of tones by increasing and decreasing activity in response to tone onset and offset, respectively. Each row indicates one neuron. i, Population activity trace (mean ΔF/F ± SEM) for neurons depicted in (h), timelocked to tone onset and averaged across tones. Repeated measures ANOVA: main effect of time: F(179,8234) = 7.033, P < 0.0001; group by time interaction: F(179,8234) = 2.749, P = 0.0093. Data in (d-i) are based on 1,204 total cells pooled from three independent experiments, from n = 7 Ctrl mice and n = 8 ABX mice.
Figure 5.
Figure 5.. Extinction learning deficits in GF mice are associated with alterations in microbiota-derived metabolites.
d, Fear extinction of Ctrl, GF and gnotobiotic mice colonized by SFB, Clostridia, Enterobacter or ASF bacterium(-a) (a), Ctrl, GF and ex-GF_adult mice (b), Ctrl, GF and ex-GF_weaning mice (c), or Ctrl, GF and ex-GF_fostered mice (d) in the single-session 30-tone fear extinction assay. Data in (a,b,d) are pooled from three independent experiments, and data in (c) are pooled from two independent experiments. (a) n = 9, 13, 9, 12, 7 and 9 for Ctrl, GF, SFB, Clostridia, Enterobacter and ASF, respectively. (b) n = 18/group. (c) n = 12/group. (d) n = 10, 11 and 12 for Ctrl_fostered, GF, and GF_fostered, respectively. Data are mean ± SEM. The AUC was calculated for each mouse within each group followed by one-way ANOVA with Tukey’s multiple comparisons test. (a) F (5, 53) = 7.046, P = 4.10E-05. Adjusted P values: i, 6.34E-05. ii, 0.0002. iii, 0.0042. iv, 0.0010. v, 0.0189. (b) F (2, 51) = 11.92, P = 5.66E-05. Adjusted P values: i, 0.0002. ii, 0.0005. (c) F (2, 33) = 12.64, P = 8.40E-05. Adjusted P values: i, 0.0016. ii, 0.0001. (d) F (2, 30) = 5.131, P = 0.0121. Adjusted P values: i, 0.0228. ii, 0.0273. e,f, Relative abundances of four compounds in cerebrospinal fluid (CSF) (e) and serum (f) samples from Ctrl_fostered, GF and GF_fostered mice. n = 3/group. Unpaired two-sided t tests were used. (e) i, 9.54E-05. ii, 0.0102. iii, 0.0036. iv, 0.0044. v, 0.0018. vi, 0.0011. vii, 0.1493. viii, 0.0331. (f) i, 0.0017. ii, 0.0002. iii, 0.0005. iv, 0.0128. v, 0.0014. vi, 0.0003. vii, 0.0020. viii, 0.0014.

Comment in

References

    1. Maren S Neurobiology of Pavlovian fear conditioning. Annu Rev Neurosci 24, 897–931, doi:10.1146/annurev.neuro.24.1.897 (2001). - DOI - PubMed
    1. VanElzakker MB, Dahlgren MK, Davis FC, Dubois S & Shin LM From Pavlov to PTSD: the extinction of conditioned fear in rodents, humans, and anxiety disorders. Neurobiol Learn Mem 113, 3–18, doi:10.1016/j.nlm.2013.11.014 (2014). - DOI - PMC - PubMed
    1. Mielcarz DW & Kasper LH The gut microbiome in multiple sclerosis. Curr Treat Options Neurol 17, 344, doi:10.1007/s11940-015-0344-7 (2015). - DOI - PubMed
    1. Krajmalnik-Brown R, Lozupone C, Kang DW & Adams JB Gut bacteria in children with autism spectrum disorders: challenges and promise of studying how a complex community influences a complex disease. Microb Ecol Health Dis 26, 26914, doi:10.3402/mehd.v26.26914 (2015). - DOI - PMC - PubMed
    1. Zheng P et al. Gut microbiome remodeling induces depressive-like behaviors through a pathway mediated by the host’s metabolism. Mol Psychiatry 21, 786–796, doi:10.1038/mp.2016.44 (2016). - DOI - PubMed

MeSH terms