

Heterogeneity in old fibroblasts is linked to variability in reprogramming and wound healing
- PMID: 31645721
- PMCID: PMC7253295
- DOI: 10.1038/s41586-019-1658-5
Heterogeneity in old fibroblasts is linked to variability in reprogramming and wound healing
Abstract
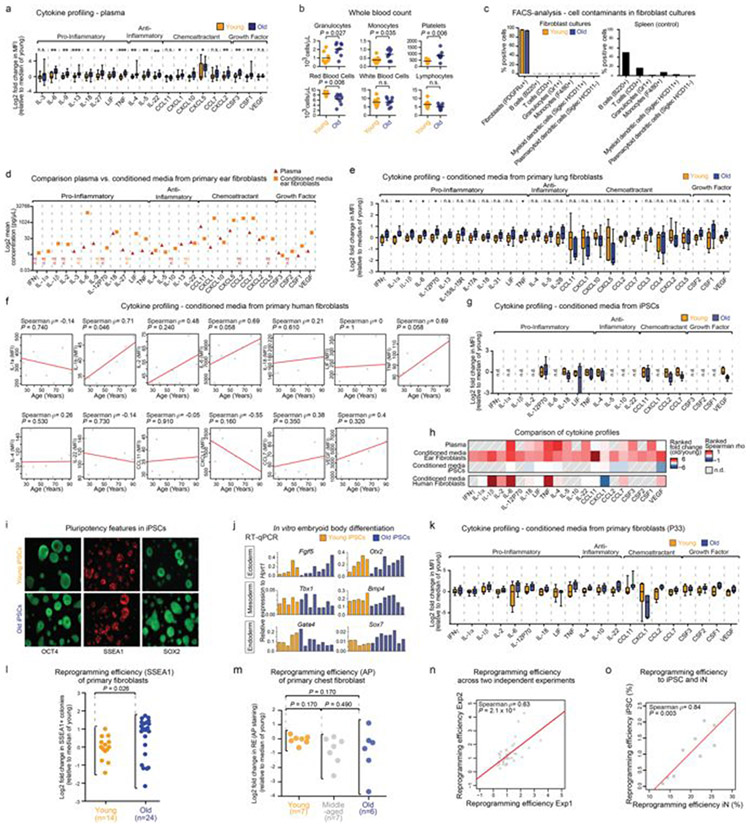
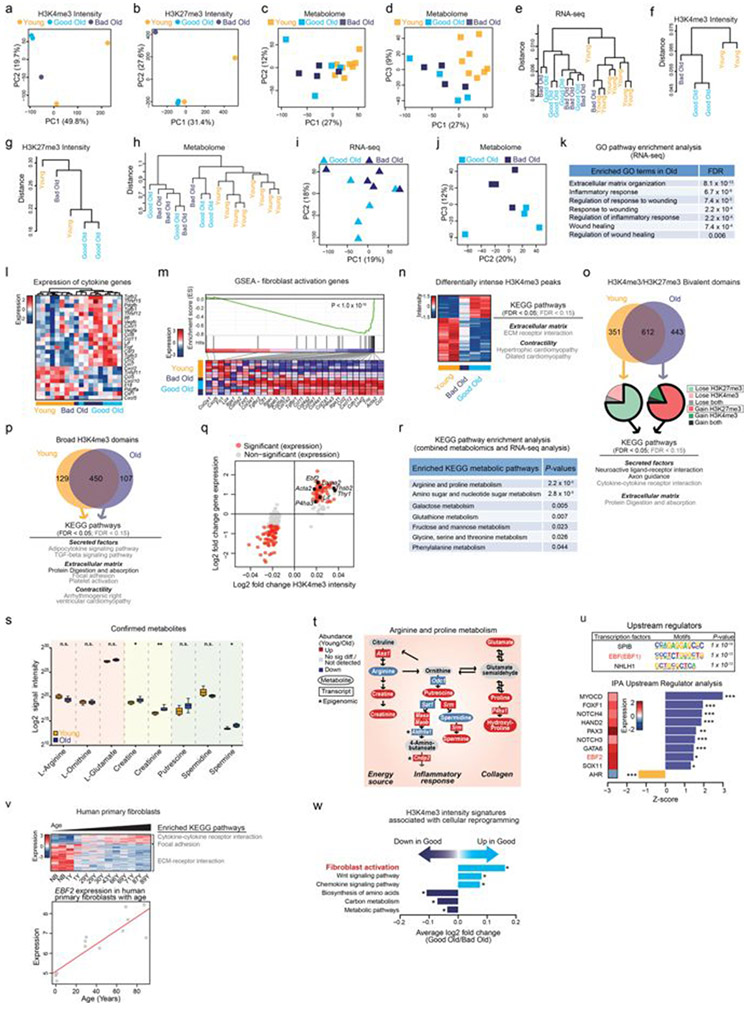
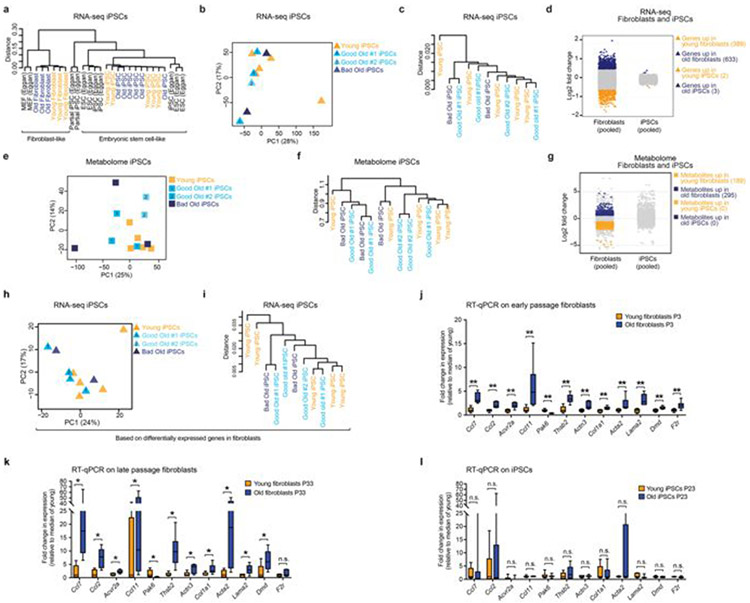
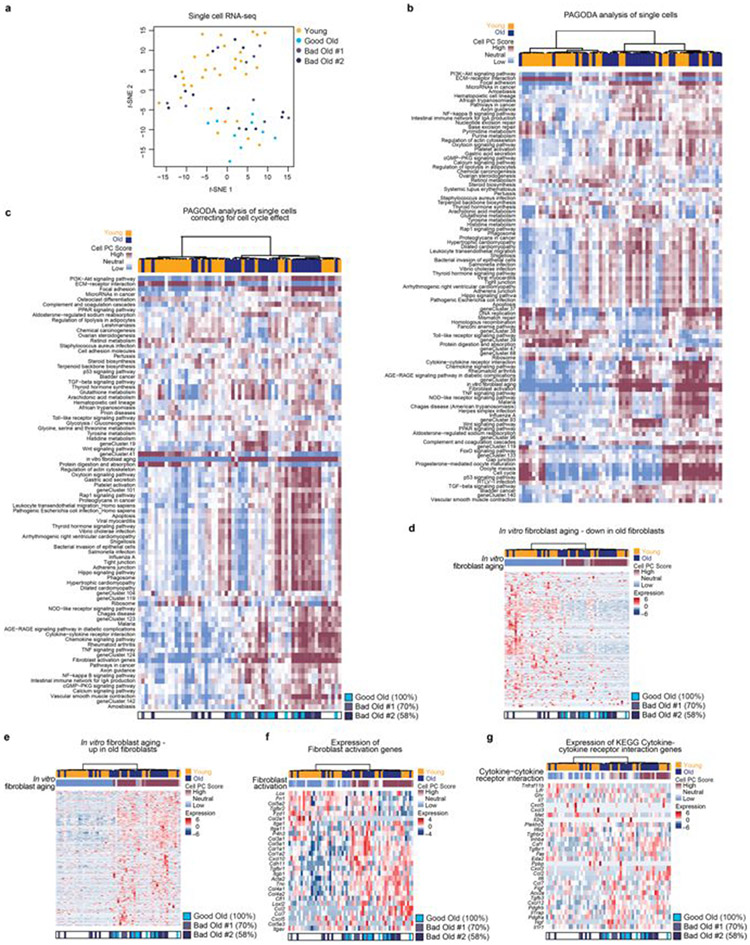
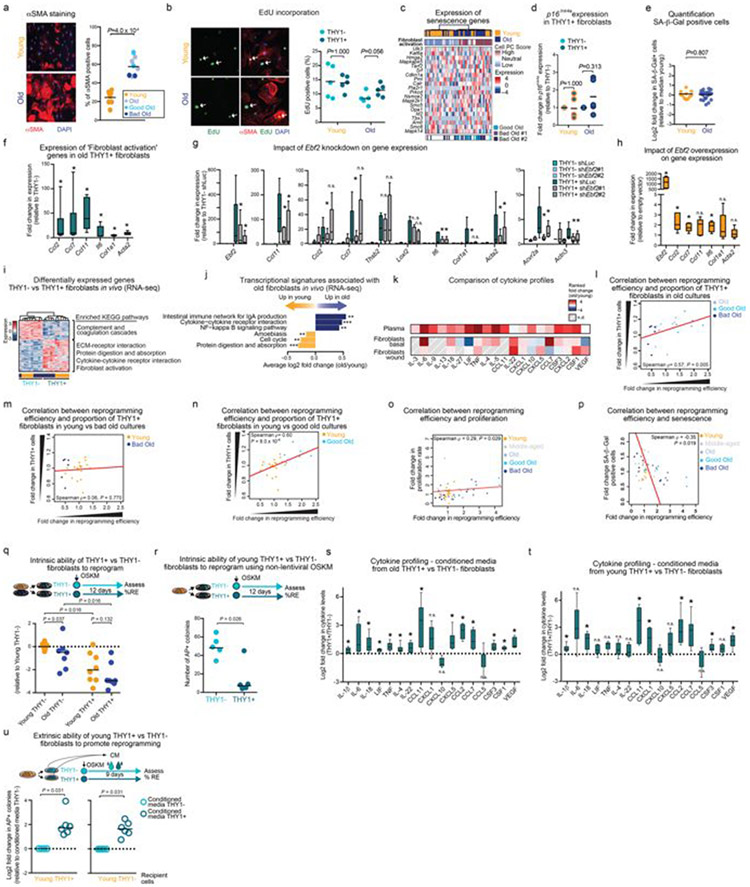
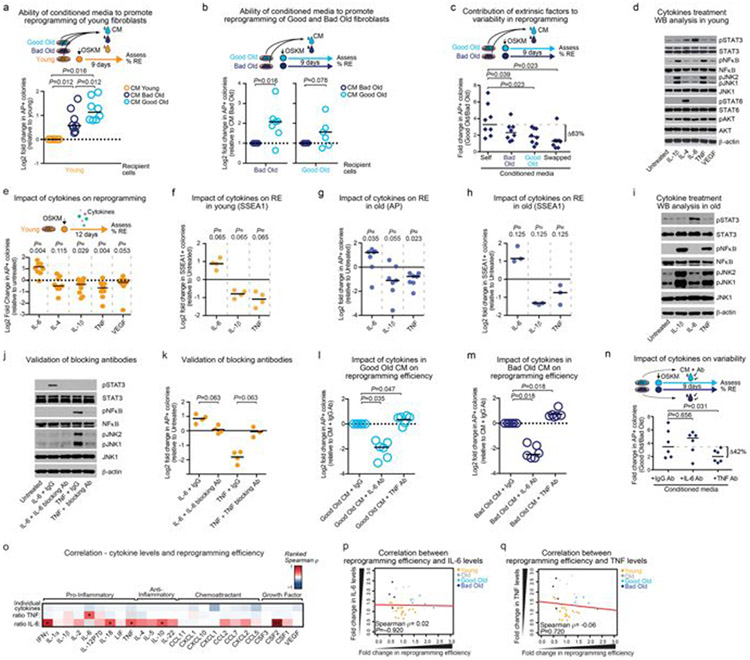
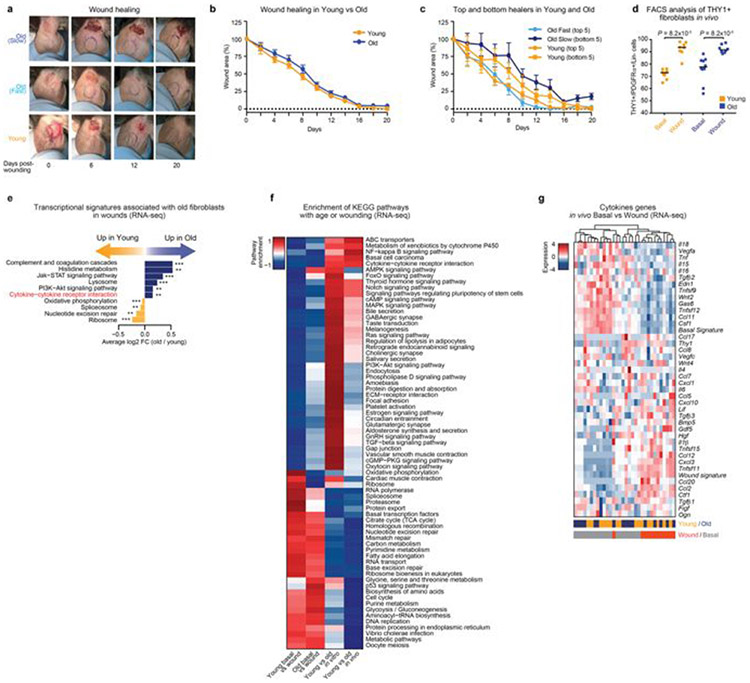
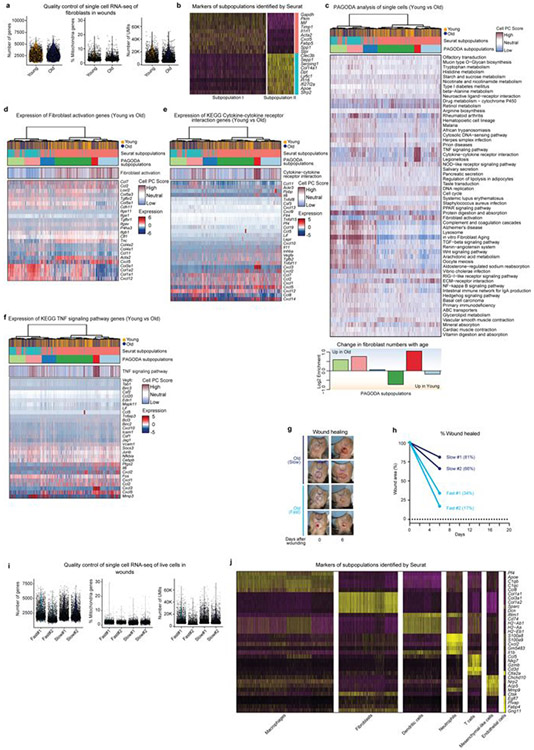
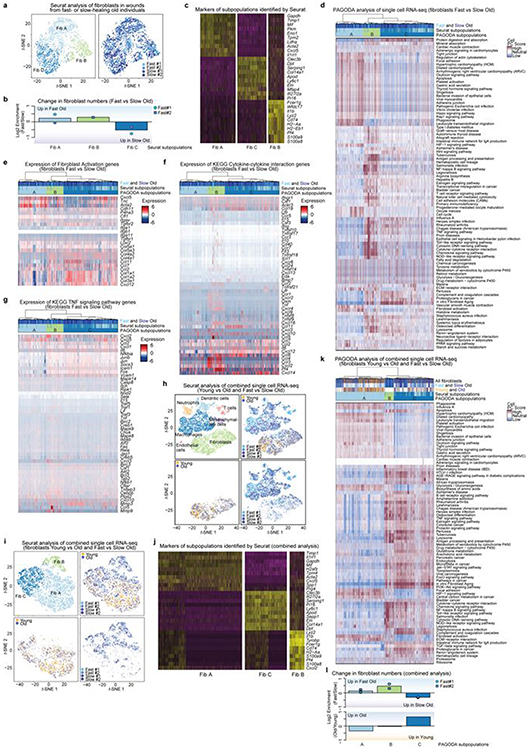
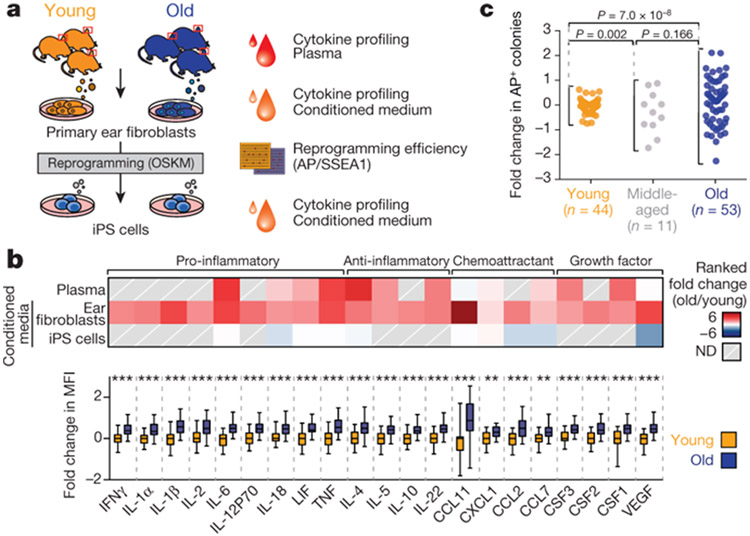
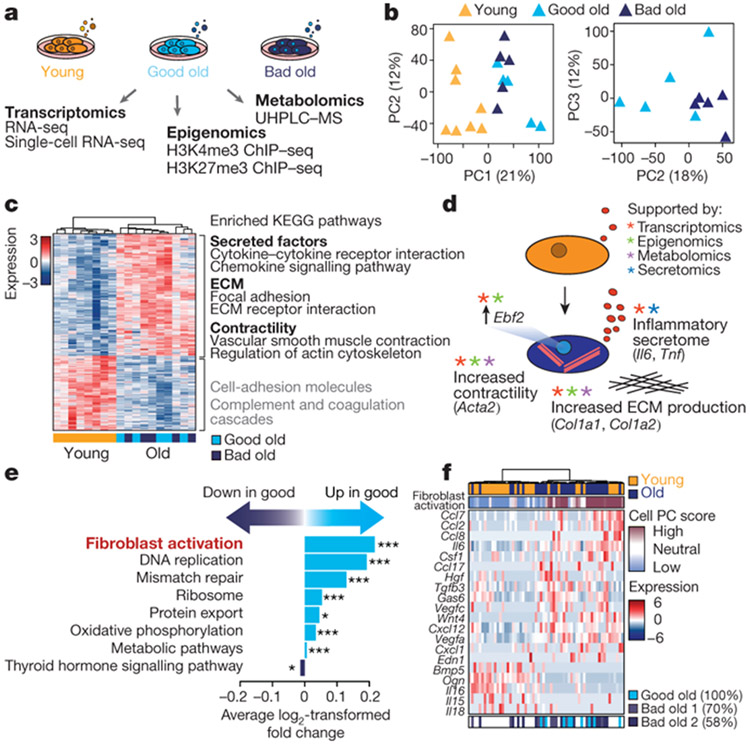
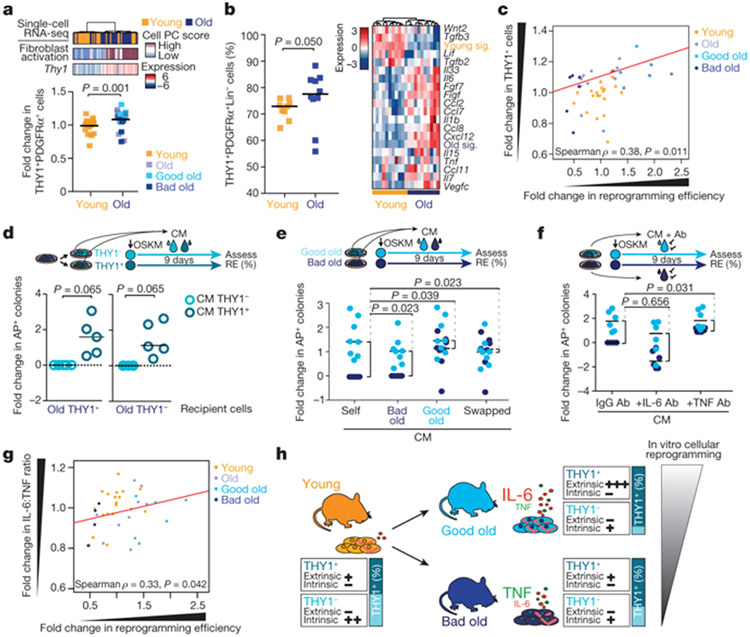
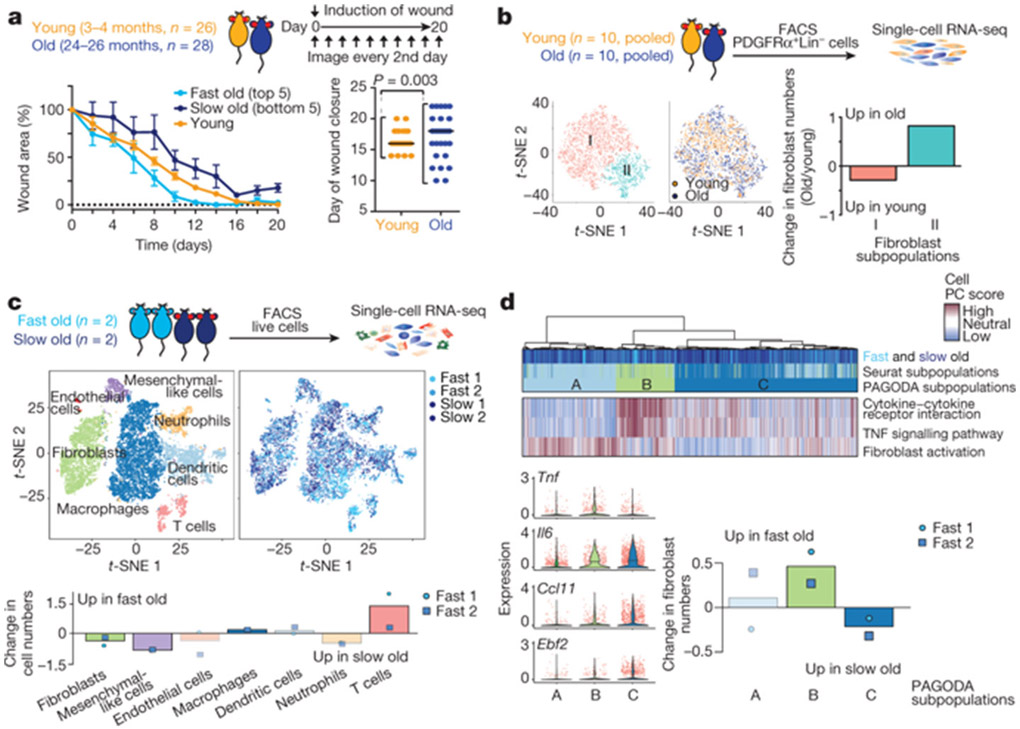
Age-associated chronic inflammation (inflammageing) is a central hallmark of ageing1, but its influence on specific cells remains largely unknown. Fibroblasts are present in most tissues and contribute to wound healing2,3. They are also the most widely used cell type for reprogramming to induced pluripotent stem (iPS) cells, a process that has implications for regenerative medicine and rejuvenation strategies4. Here we show that fibroblast cultures from old mice secrete inflammatory cytokines and exhibit increased variability in the efficiency of iPS cell reprogramming between mice. Variability between individuals is emerging as a feature of old age5-8, but the underlying mechanisms remain unknown. To identify drivers of this variability, we performed multi-omics profiling of fibroblast cultures from young and old mice that have different reprogramming efficiencies. This approach revealed that fibroblast cultures from old mice contain 'activated fibroblasts' that secrete inflammatory cytokines, and that the proportion of activated fibroblasts in a culture correlates with the reprogramming efficiency of that culture. Experiments in which conditioned medium was swapped between cultures showed that extrinsic factors secreted by activated fibroblasts underlie part of the variability between mice in reprogramming efficiency, and we have identified inflammatory cytokines, including TNF, as key contributors. Notably, old mice also exhibited variability in wound healing rate in vivo. Single-cell RNA-sequencing analysis identified distinct subpopulations of fibroblasts with different cytokine expression and signalling in the wounds of old mice with slow versus fast healing rates. Hence, a shift in fibroblast composition, and the ratio of inflammatory cytokines that they secrete, may drive the variability between mice in reprogramming in vitro and influence wound healing rate in vivo. This variability may reflect distinct stochastic ageing trajectories between individuals, and could help in developing personalized strategies to improve iPS cell generation and wound healing in elderly individuals.
Figures
Comment in
-
Ageing is associated with increased variability of cellular reprogramming and wound healing.Cardiovasc Res. 2020 Nov 1;116(13):e171-e174. doi: 10.1093/cvr/cvaa294. Cardiovasc Res. 2020. PMID: 33096562 No abstract available.
References
-
- Franceschi C & Campisi J Chronic inflammation (inflammaging) and its potential contribution to age-associated diseases. J. Gerontol. A Biol. Sci. Med. Sci 69, S4–S9 (2014). - PubMed
-
- Ocampo A, Reddy P & Belmonte JCI Anti-aging strategies based on cellular reprogramming. Trends Mol. Med 22, 725–738 (2016). - PubMed
MeSH terms
Substances
Grants and funding
LinkOut - more resources
Full Text Sources
Medical
Research Materials
