. 2019 Oct;574(7779):549-552.
doi: 10.1038/s41586-019-1662-9. Epub 2019 Oct 23.

Bacterial biodiversity drives the evolution of CRISPR-based phage resistance

Affiliations

Bacterial biodiversity drives the evolution of CRISPR-based phage resistance

Ellinor O Alseth et al. Nature. 2019 Oct.

Abstract

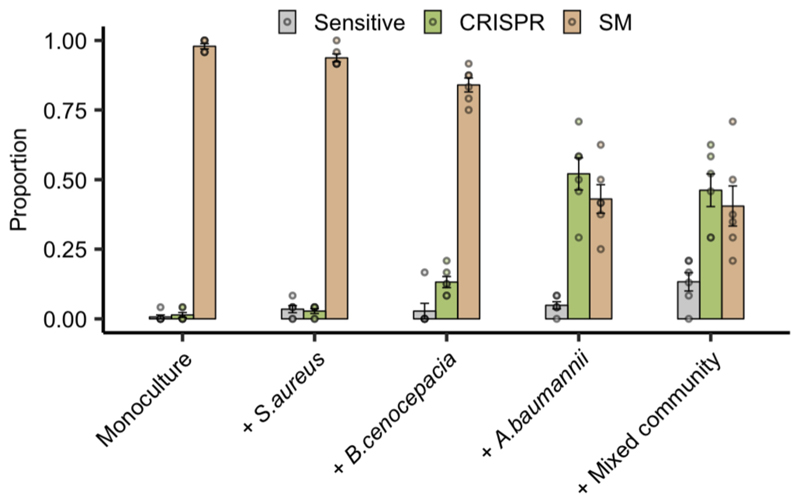
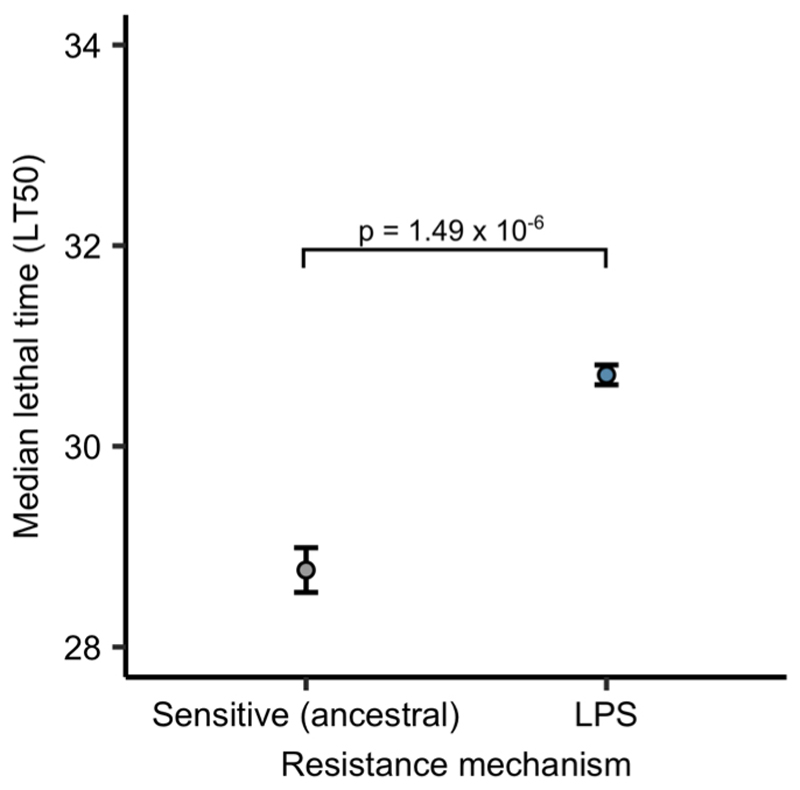
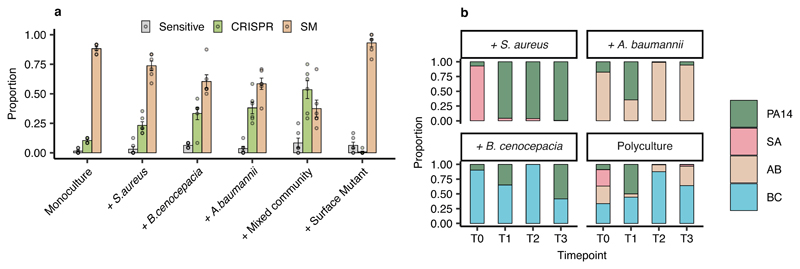
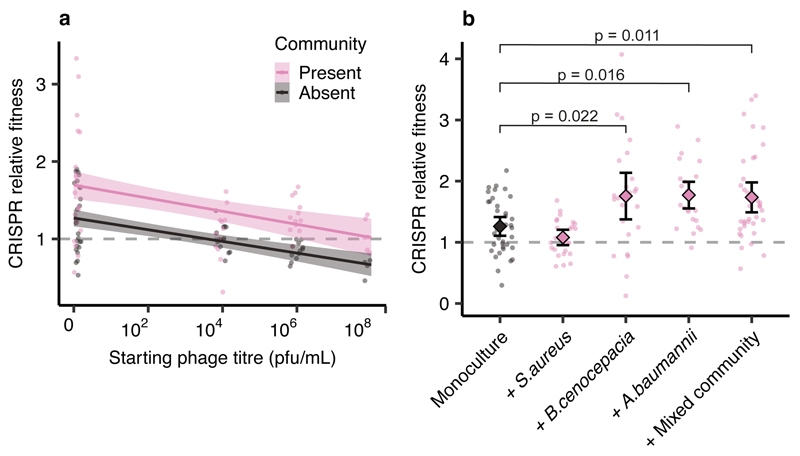
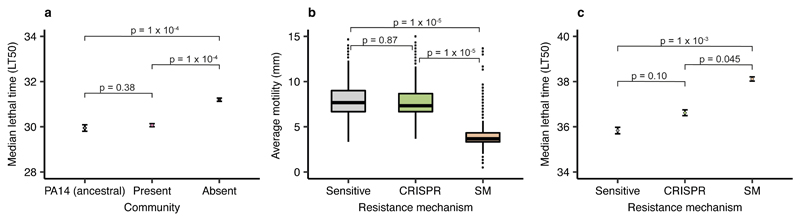
About half of all bacteria carry genes for CRISPR-Cas adaptive immune systems1, which provide immunological memory by inserting short DNA sequences from phage and other parasitic DNA elements into CRISPR loci on the host genome2. Whereas CRISPR loci evolve rapidly in natural environments3,4, bacterial species typically evolve phage resistance by the mutation or loss of phage receptors under laboratory conditions5,6. Here we report how this discrepancy may in part be explained by differences in the biotic complexity of in vitro and natural environments7,8. Specifically, by using the opportunistic pathogen Pseudomonas aeruginosa and its phage DMS3vir, we show that coexistence with other human pathogens amplifies the fitness trade-offs associated with the mutation of phage receptors, and therefore tips the balance in favour of the evolution of CRISPR-based resistance. We also demonstrate that this has important knock-on effects for the virulence of P. aeruginosa, which became attenuated only if the bacteria evolved surface-based resistance. Our data reveal that the biotic complexity of microbial communities in natural environments is an important driver of the evolution of CRISPR-Cas adaptive immunity, with key implications for bacterial fitness and virulence.


Conflict of interest statement

The authors declare no competing interests.

Figures

Extended Data Figure 1
Extended Data Figure 1. Only P. aeruginosa adsorbs phage DMS3vir.
Phage levels, given in plaque-forming units per millilitre, in minutes post infection of P. aeruginosa PA14 and three other bacterial species (n = 252 biologically independent samples). Controls were carried out in the absence of bacteria. Here, the lines are regression slopes with shaded areas corresponding to 95% confidence intervals. Linear model: Effect of P. aeruginosa on phage titre over time; t = -3.37, p = 0.0009; S. aureus; t = 1.63, p = 0.11; A. baumannii; t = 1.20, p = 0.23; B. cenocepacia; t = -0.27, p = 0.79; Overall model fit; F9,235= 4.33, adjusted R2 = 0.11, p = 3.17 × 10⁻⁵.
Extended Data Figure 2
Extended Data Figure 2. Enhanced CRISPR resistance evolution in artificial sputum medium.
Proportion of P. aeruginosa that acquired surface modification (SM) or CRISPR-based immunity (or remained sensitive) at 3 days post infection with phage DMS3vir when grown in artificial sputum medium (6 replicates per treatment, with 24 colonies screened from each replicate, n = 720 biologically independent samples). Deviance test: Relationship between community composition and CRISPR; Residual deviance(25, n = 30) = 1.26, p = 2.2 × 10⁻¹⁶; Tukey contrasts: Monoculture v Mixed; z = -5.30, p = 1 × 10⁻⁴; Monoculture v A. baumannii; z = -5.60, p = 1 × 10⁻⁴; Monoculture v B. cenocepacia; z = -2.80, p = 0.02; Monoculture v S. aureus; z = -0.76, p = 0.93. Error bars correspond to ± one standard error, with the mean as the measure of centre.
Extended Data Figure 3
Extended Data Figure 3. Increased CRISPR-based resistance evolution across a range of microbial community compositions over time.
Proportion of P. aeruginosa that acquired surface modification (SM) or CRISPR-based immunity (or remained sensitive) at up to 3 days post infection (d.p.i.) with phage DMS3vir when grown either in monoculture (100%), or in polyculture mixtures consisting of the mixed microbial community but with varying starting percentages of P. aeruginosa based on volume. (6 replicates for most samples, with 24 colonies per replicate, n = 2784 biologically independent replicates). (a) Resistance evolution at 1 d.p.i. Error bars correspond to ± one standard error, with the mean as the measure of centre. Deviance test: Relationship between CRISPR and P. aeruginosa starting percentage at timepoint 1; Residual deviance(34, n = 41) = 4.42, p = 0.004; 1%; z = -3.27, p = 0.002; 10%; z = 1.21, p = 0.23; 25%; z = 1.62, p = 0.11; 50%; z = 2.20, p = 0.034; 90%; z = 2.07, p = 0.046; 99%; z = 0.47, p = 0.65; 100%; z = 1.47, p = 0.15. (b) Resistance evolution at 2 d.p.i. Error bars correspond to ± one standard error, with the mean as the measure of centre. Deviance test: Relationship between CRISPR and P. aeruginosa starting percentage at timepoint 2; Residual deviance(25, n = 32) = 3.86, p = 2.51 × 10⁻⁶; 1%; z = -2.14, p = 0.04; 10%; z = 1.19, p = 0.25; 25%; z = 2.07, p = 0.049; 50%; z = 1.89, p = 0.07; 90%; z = 1.12, p = 0.27; 99%; z = 1.21, p = 0.24; 100%; z = 1.11, p = 0.28. (c) Resistance evolution at 3 d.p.i. Error bars correspond to ± one standard error, with the mean as the measure of centre. Deviance test: Relationship between CRISPR and P. aeruginosa starting percentage at Timepoint 3; Residual deviance(35, n = 42) = 8.24, p = 0.0004; 1%; z = -3.38, p = 0.002; 10%; z = 2.12, p = 0.04; 25%; z = 2.77, p = 0.009; 50%; z = 3.07, p = 0.004; 90%; z = 2.46, p = 0.019; 99%; z = 1.55, p = 0.13; 100%; z = 0.87, p = 0.39.
Extended Data Figure 4
Extended Data Figure 4. Microbial community composition impacts phage epidemic size.
The DMS3vir phage titres (in plaque-forming units per millilitre) over time up to 3 days post infection of P. aeruginosa grown either in monoculture (100%), or in polyculture mixtures as shown in Extended Data Fig. 3. Each data point represents the mean, with error bars corresponding to ± one standard error (n = 171 independent biological samples). Two-way ANOVA: Overall effect of P. aeruginosa starting percentage on phage titre; F6,105 = 14.84, p = 1.1 × 10⁻¹².
Extended Data Figure 5
Extended Data Figure 5. No correlation between phage epidemic size and evolution of CRISPR resistance.
The correlation between the proportion evolved phage resistant clones with CRISPR-based resistance and the phage epidemic sizes (in plaque-forming units per millilitre) in the presence of other bacterial species, using data taken from experiments shown in Fig. 1, Extended Data Fig. 2, Extended Data Fig. 3c and Extended Data Fig. 6 (n = 137 biologically independent samples per timepoint). Correlations are separated by day, as phage titres were measured daily. Here, the lines are regression slopes, with shaded areas corresponding to 95% confidence intervals. Pearson’s Product-Moment Correlation tests between phage titres (at each day post infection) and levels of CRISPR-based resistance: T = 1; t136 = -0.02, p = 0.98, R2 = -0.002; T = 2; t136 = 0.59, p = 0.55, R2 = 0.05; T = 3; t136 = -0.90, p = 0.37, R2 = -0.08.
Extended Data Figure 6
Extended Data Figure 6. Starting phage titre does not affect CRISPR evolution in the presence of a microbial community.
Proportion of P. aeruginosa that acquired CRISPR-based resistance at 3 days post infection with varying starting titres of phage DMS3vir when grown in polyculture (n = 127 biologically independent samples). Deviance test: Start phage and CRISPR; Residual deviance(20, n = 24) = 2.00, p = 0.13; Tukey contrasts: 102 v 104; z = -1.52, p = 0.42; 104 v 106; z = -0.76, p = 0.87; 106 v 108; z = 1.31, p = 0.56; 102 v 106; z = -2.24, p = 0.11; 102 v 108; z = -0.99, p = 0.75; 104 v 108; z = 0.56, p = 0.94. Error bars correspond to ± one standard error, with the mean as the measure of centre.
Extended Data Figure 7
Extended Data Figure 7. LPS-based phage resistance also affects in vivo virulence.
Time to death (given as the median ± one standard error) for Galleria mellonella larvae infected with PA14 clones that evolved phage resistance through LPS modification, compared to the phage-sensitive ancestral (n = 209 biologically independent samples). Cox proportional hazards model with Tukey contrasts: Sensitive (ancestral) v LPS ; z = 4.81, p = 1.49 × 10⁻⁶. Overall model fit; LRT3 = 44.94, p = 1 × 10⁻⁹
Figure 1
Figure 1. Biodiversity affects the evolution of phage resistance.
(a) Proportion of P. aeruginosa that acquired surface- (SM) or CRISPR-based resistance, or remained sensitive at 3 d.p.i. with phage DMS3vir when grown in monoculture or polycultures, or with an isogenic surface mutant (6 replicates per treatment, with 24 colonies per replicate, n = 864 biologically independent samples). Error bars ± one SE, with the mean as centre. (b) Microbial community composition over time for the mixed-species infection experiments. Legend abbreviations: PA14 = P. aeruginosa, SA = S. aureus, AB = A. baumannii, and BC = B. cenocepacia.
Figure 2
Figure 2. Biodiversity amplifies fitness costs associated with surface-based resistance.
Relative fitness of a P. aeruginosa clone with CRISPR-based resistance after competing for 24h against a surface modification clone at (a) varying levels of phage DMS3vir in the presence or absence of a mixed microbial community. Regression slopes with shaded areas corresponding to 95% CI (n = 144 biologically independent samples). (b) Relative fitness after competition in the absence of phage, but in the presence of other bacterial species individually or as a mixture. Error bars 95% CI and the mean as centre (n = 144 biologically independent samples).
Figure 3
Figure 3. Evolution of phage resistance affects in vivo virulence.
(a) Time to death (given as the median ± one standard error) following infection with PA14 clones that evolved phage resistance either in the presence or absence of a mixed microbial community (n = 376 biologically independent samples, analysed using a Cox proportional hazards model with Tukey contrasts). Type of evolved phage resistance (CRISPR- or surface-based (SM)) drastically impacted (b) bacterial motility (n = 981 biologically independent samples). Boxplots show the median with the upper and lower 25th and 75th percentiles, the inter-quartile range, and outliers shown as dots. (c) Type of resistance also affected in vivo virulence (time to death, given as the median ± one standard error, n = 981, analysed using a Cox proportional hazards model with Tukey contrasts).

References

    1. Grissa I, Vergnaud G, Pourcel C. CRISPRcompar: a website to compare clustered regularly interspaced short palindromic repeats. Nucleic Acids Res. 2008;36:52–57. - PMC - PubMed
    1. Barrangou R, et al. CRISPR provides acquired resistance against viruses in prokaryotes. Science. 2007;315:1709–12. - PubMed
    1. Andersson AF, Banfield JF. Virus population dynamics and acquired virus resistance in natural microbial communities. Science. 2008;320:1047–1050. - PubMed
    1. Laanto E, Hoikkala V, Ravantti J, Sundberg LR. Long-term genomic coevolution of host-parasite interaction in the natural environment. Nat Commun. 2017;8 - PMC - PubMed
    1. Westra ER, et al. Parasite exposure drives selective evolution of constitutive versus inducible defense. Curr Biol. 2015;25:1043–1049. - PubMed

Publication types

MeSH terms

Substances