. 2019 Oct;574(7780):717-721.
doi: 10.1038/s41586-019-1700-7. Epub 2019 Oct 23.

Alcohol metabolism contributes to brain histone acetylation

Affiliations

Alcohol metabolism contributes to brain histone acetylation

P Mews et al. Nature. 2019 Oct.

Abstract

Emerging evidence suggests that epigenetic regulation is dependent on metabolic state, and implicates specific metabolic factors in neural functions that drive behaviour1. In neurons, acetylation of histones relies on the metabolite acetyl-CoA, which is produced from acetate by chromatin-bound acetyl-CoA synthetase 2 (ACSS2)2. Notably, the breakdown of alcohol in the liver leads to a rapid increase in levels of blood acetate3, and alcohol is therefore a major source of acetate in the body. Histone acetylation in neurons may thus be under the influence of acetate that is derived from alcohol4, with potential effects on alcohol-induced gene expression in the brain, and on behaviour5. Here, using in vivo stable-isotope labelling in mice, we show that the metabolism of alcohol contributes to rapid acetylation of histones in the brain, and that this occurs in part through the direct deposition of acetyl groups that are derived from alcohol onto histones in an ACSS2-dependent manner. A similar direct deposition was observed when mice were injected with heavy-labelled acetate in vivo. In a pregnant mouse, exposure to labelled alcohol resulted in the incorporation of labelled acetyl groups into gestating fetal brains. In isolated primary hippocampal neurons ex vivo, extracellular acetate induced transcriptional programs related to learning and memory, which were sensitive to ACSS2 inhibition. We show that alcohol-related associative learning requires ACSS2 in vivo. These findings suggest that there is a direct link between alcohol metabolism and gene regulation, through the ACSS2-dependent acetylation of histones in the brain.


Conflict of interest statement

Competing interests

The authors declare no competing financial interests.

Figures
Extended Data Figure 1 |
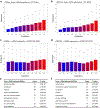
Ethanol-derived acetyl groups are rapidly incorporated into brain histone acetylation. a, Mass spec analysis of serum acetate shows rapidly increasing levels of acetate in alcohol-injected animals, at 30 minutes post-injection (n = 3 for saline, n = 4 for acetate group; data are mean ± s.e.m., two-tailed unpaired T test, P = 0.0258). b, d6-EtOH is readily metabolized and thus labels blood acetate pools (d3-acetate detected by mass spec, n = 4 per group; data are mean ± s.e.m., two-tailed unpaired T test, P = 0.0016). c, d6-EtOH label incorporation into cortical histone acetylation shows a similar pattern to the hippocampus. The Arachne plot axis represents the % of the third isotope for the acetylated peptide, corresponding to the D3 labeled form; the natural relative abundance of that isotope is apparent in the ‘none’ and ‘saline 1h’ treatment groups. d, Histone acetylation is relatively independent of alcohol metabolism in skeletal muscle, a tissue with low expression of ACSS2. e, f, Mass spectra (representative from three biological replicates) showing the relative abundance of deuterated histone H4-triacetyl peptide (aa 4–17) in hippocampus of wild-type mice at baseline and 4 hours following d6-EtOH injection. Increases of the M+1 (blue lines), M+2 (green lines) and M+3 (red lines) isotopes are shown in (e) and indicate a major increase of M+3. The contribution of singly (orange), doubly (grey) and triply (yellow) deuterated peptides to the isotopic distribution is shown in (f). The relative abundance of the M+3 isotope is increased about 6-fold at 4 hours following d6-EtOH injection, and is overwhelming due to the triply deuterated peptides; in comparison, the contribution of singly and doubly deuterated peptides to the M+3 isotope is minimal. The experiment was performed with 3 biological replicates per group. g, The relative abundance of the first four isotopes of each of the seven peptides in the untreated samples corresponds to the theoretical isotopic distribution of the peptides (calculated using enviPat; samples not treated with d6-EtOH n = 20 data are mean ± s.d.). h, Natural abundance-corrected contribution of M+1, M+2 and M+3 isotopes to histone acetylation labeling in liver and hippocampus following i.p. injection of d6-ethanol (calculated using FluxFix; n = 3 per group; data are mean ± s.d.).
Extended Data Figure 2 |
Dynamics of ethanol and acetate-induced heavy label incorporation. a, b, Relative abundance of deuterated histone acetylation in dorsal Hippocampus (dHPC), ventral Hippocampus (vHPC), Cortex, Liver, and Muscle at 8 hours (a) and at 24 hours (b) after i.p. injection of d6-EtOH. c, C13-EtOH (carbon 1 heavy labeled) introduced via intraperitoneal injection readily labels hippocampal histone acetylation (% increase over natural abundance of 13C acetyl groups in saline-injected animals, n = 1). d, In contrast to heavy d6-EtOH, non-labeled EtOH control does not increase the natural abundance of heavy histone acetylation in the hippocampus. e, Histone acetylation is relatively independent of liver alcohol metabolism in skeletal muscle. Relative abundance of deuterated histone acetylation in skeletal muscle tissue at 30 minutes and 4 hours in WT mice, and 30 minutes in hippocampal ACSS2 KD mice. f, g, Heavy acetate introduced via intraperitoneal injection readily labels histone acetylation in the dorsal hippocampus (f), and in the cortex (g). (n = 2 at 30 min, n = 3 per group at other time points; data are mean ± s.e.m.). h, Acetate levels measured mass spec in hippocampal tissue following acetate and ethanol injections (n = 3 per group; data are mean ± s.e.m., two-tailed unpaired T test, 30min Acetate vs. Saline, P = 0.0335; two-tailed unpaired T test, 30 min EtOH vs. saline, P = 0.0285).
Extended Data Figure 3 |
Metabolite labeling in hippocampal tissue 30 min following i.p. d6-EtOH injection. a-f, Mass spec quantification of metabolite labeling in hippocampal tissue at 30 minutes following i.p. d6-EtOH injection. d6-EtOH label was incorporated into hippocampal acetate pools (a). In contrast, d6-EtOH did not contribute to glucose pool (b) not to 3-hydroxybutyrate (d) in hippocampus, and only minimally to lactate (c). Labeling of 3-Hydroxybutyrate was not observed, in contrast to hippocampal Glutamine (e) and Isocitrate/Citrate (f) pools.
Extended Data Figure 4 |
Representative H3K9ac and H3K27ac dorsal hippocampal ChIPseq tracks in control and EtOH-treated wild-type and ACSS2 knock-down mice. a-c, ChIP-seq for H3K9ac and H3K27ac in untreated and EtOH-treated WT and ACSS2 KD animals. Genome-browser track views show the (a) Cep152 gene locus (Chr2:125,603,000–125,626,000), (b) Uimc gene locus (Chr5: 55,064,000–55,089,000), and (c) Nsmaf gene locus (Chr4: 6,425,000–6,464,000). The experiment was performed with 3 independent biological replicates per group.
Extended Data Figure 5 |
Dorsal hippocampal epigenetic and transcriptional changes in control and EtOH-treated wild-type and ACSS2 knock-down mice. a-d, Decile plots of genes enriched in H3K9ac (a) and H3K27ac (b) show correlation with mRNA expression levels in hippocampus, in WT animals 1 hour following injection with EtOH. In contrast, in ACSS2 KD animals, the correlation between histone H3K9 acetylation (c) and H3K27 acetylation (d) and alcohol-related mRNA expression is largely lost (box-and-whisker plots show median value with whiskers extending to 1.5x the interquartile range; n = 16,553 genes (population) arranged into ten equal-sized deciles by acetylation ChIP-seq enrichment) e-f, GO analysis on H3K9ac/H3K27ac peaks that are induced by EtOH in WT but not ACSS2 KD animals (n = 332 H3K9ac peaks and n = 480 H3K27ac peaks; Gene Ontology enrichment analysis performed using a modified Fisher’s exact test (EASE) with the FDR controlled by the Yekutieli procedure, -log10 of nominal P values are shown).
Extended Data Figure 6 |
Transcriptional changes in primary hippocampal neurons treated with supraphysiological levels of acetate. a, ACSS2i structure (C20H18N4O2S2) b, RNAseq showing differentially regulated genes in primary hippocampal neurons treated with 5 mM acetate (n = 4 replicates per group; volcano plot of likelihood ratio test employed by DESeq2 (two-sided), FDR controlled for multiple hypothesis testing). c,d, Gene ontology (GO) analysis of significantly upregulated (c) (n = 3613 genes) and significantly downregulated (d) (n = 3987 genes) genes (GO analysis performed with GOrilla, using a minimal hypergeometric test). e, RNA-seq in primary hippocampal neurons isolated from C57/Bl6 mouse embryos and treated with acetate (5 mM) in the presence or absence of a small molecular inhibitor of ACSS2 (ACSS2i). 2107 of the 3613 acetate-induced genes fail to be upregulated in the presence of ACSS2i (box-and-whisker plots show median value with whiskers extending to 1.5x the interquartile range; n = 3,613 induced genes (population) or 3,613 randomly sampled genes (population) tested using two-sided Mann-Whitney rank-sum test, P < 2.2E-16)). f, Shown in blue are acetate-induced genes in primary hippocampal neurons, together with the GO term analysis of ACSS2i sensitive genes (non-overlapping with yellow, which represents the genes that are upregulated by acetate in the presence of ACSS2i; n = 2107, Gene Ontology enrichment analysis performed using a modified Fisher’s exact test (EASE) with the FDR controlled by the Yekutieli procedure, -log10 of nominal P values are shown).
Extended Data Figure 7 |
Representative RNA-seq tracks in control and acetate-treated primary hippocampal neurons in the presence or absence of ACSS2 inhibitors. a-d, Genome-browser track views showing examples of gene up-regulation upon acetate treatment in hippocampal neurons, and diminished induction with ACSS2i treatment (n = 4 per cohort). RNA-seq track views show the (a) Slc17a7 gene locus (Chr7: 45,162,500–45,179,000), the (b) Ccnil gene locus (Chr11: 43,525,000–43,595,000), the (c) the Cpne7 gene locus (Chr8: 123,152,500–123,137,500), and the (d) Ndufv3 gene locus (Chr17: 31,523,000–31,534,000).
Extended Data Figure 8 |
Acetate-induced transcriptional changes in primary hippocampal neurons relate to in vivo ACSS2 peaks and in vivo gene expression changes induced by ethanol. a, Cumulative number of ACSS2 peaks near the transcription start site (TSS) of acetylated ACSS2i sensitive genes, indicating that the majority ACSS2 binding events occurs over or proximal to the gene promoter. b, GO analysis for the 830 overlapping genes between the in vivo RNA-seq and ex vivo hippocampal neuron RNAseq (n = 830 genes (population), Gene Ontology enrichment analysis performed using a modified Fisher’s exact test (EASE) with the FDR controlled by the Yekutieli procedure).
Extended Data Figure 9 |
Behavioral importance of dorsal hippocampal ACSS2 expression and heavy label incorporation in the fetal brain. a, Representative image showing virus localization to the dorsal hippocampus (dHPC) and Western blot (n = 4 animals) showing dHPC ACSS2 levels in WT and ACSS2 KD mice (a.u. – arbitrary units; for gel source data, see Supplementary Figure 1. b, Quantification of ACSS2 protein levels in the dHPC and cortex of WT and dHPC ACSS2 KD mice (n = 4 animals; data are mean ± s.e.m., multiple T test, dHPC ACSS2 KD vs. WT, P = 0.0001, q value = 0.0001; Cortex ACSS2 KD vs. WT, P = 0.2666, q value = 0.1347). c, ACSS2 is required for alcohol-induced associative learning. Mean time (seconds/minute) spent in unconditioned and ethanol-conditioned chambers following ethanol-induced conditioned place preference training in WT (n = 8) and dorsal hippocampal ACSS2 knock-down mice (n = 10). Bar graphs represent mean ± s.e.m. and show data points corresponding to individual animals. d, Heavy label incorporation into histone acetylation in the fetal brain. Data represent the second of two pools of embryos (n = 4 per pool) from maternal d6-EtOH injection. The Arachne plot axes represent the percentage of the third isotope of the acetylated peptide, corresponding to the D3 labeled form.
Figure 1 |
Figure 1 |
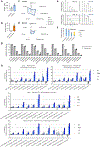
Alcohol metabolites feed histone acetylation in the brain. a, Experimental outline of in vivo d6-EtOH mass spectrometry. b, Metabolized heavy d6-EtOH is incorporated into histone acetylation in hippocampus. The Arachne plot axis represents the % of the third isotope for the acetylated peptide, corresponding to the D3 labeled form; the natural relative abundance of that isotope is apparent in the ‘none’ and ‘saline 1h’ treatment groups. c, Label incorporation into histone acetylation occurs earlier in the liver, the principal site of alcohol metabolism.
Figure 2 |
Figure 2 |
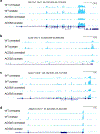
Mass spectrometry analysis of d6-EtOH in dHPC ACSS2 KD. a, Knockdown of ACSS2 expression in dorsal hippocampus prevents incorporation of the heavy label into histone acetylation. b, In the same animal, incorporation of the heavy label in the ventral hippocampus (where ACSS2 levels are normal) is not changed when compared to control mice. c, ChIP-seq for H3K9ac and H3K27ac in untreated and EtOH-treated WT and ACSS2 KD animals (n = 3 independent replicates). Genome-browser track view shows the Fstl1 gene locus (Chr16: 37,776,000–37,793,000). d, e, ChIP-seq for H3K9ac (d) and H3K27ac (e) in vivo shows increased acetylation genome-wide following EtOH injection (339/458 H3K9ac peaks, 490/816 H3K27ac peaks; called with MACS2, 10% FDR threshold DiffBind; box-and-whisker plots show the first and third quartile values and the median (center) value with whiskers extending to 1.5x the interquartile range; two-sided Mann-Whitney rank-sum test, P < 2.2E-16 (d), P = 8.42e-11 (e)). f, g, Induction of H3K9ac (f) and H3K27ac (g) is diminished in ACSS2 KD (458 H3K9ac peaks, 816 H3K27ac peaks; box-and-whisker plots show median value with whiskers extending to 1.5x the interquartile range; two-sided Mann-Whitney rank-sum test, P-value < 2.2E-16 (f), P = 2.22e-6 (g)).
Figure 3 |
Figure 3 |
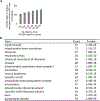
ACSS2 mediated acetate-induced transcription in primary hippocampal neurons. a, RNA-seq in primary hippocampal neurons isolated from C57/Bl6 mouse embryos and treated with acetate (5 mM) in the presence or absence of a small molecular inhibitor of ACSS2 (ACSS2i). Heatmap showing 7,600 genes differentially expressed upon acetate treatment, and a third column showing the behavior of those genes under in the presence of the ACSS2 inhibitor. 2107 of the 3613 acetate-induced genes fail to be upregulated in the presence of ACSS2i (n = 4 per group). b, GO term analysis of genes that are both sensitive to acetate and directly bound by ACSS2 (from ACSS2 ChIP-seq; n = 429 genes, population assessment using modified Fisher’s exact test (EASE) with the FDR corrected by the Yekutieli procedure, -log10 of nominal P values are shown). c, HOMER unsupervised de novo motif analysis of ACSS2 hippocampal binding sites targeting acetate-sensitive genes (de novo motif analysis of 751 ACSS2 peaks, hypergeometric test for each motif comparing background set of ACSS2 peaks that do not target acetate sensitive genes). d, Overlap of genes upregulated by EtOH in vivo (dHPC) and acetate in vitro (n = 830; hypergeometric test of gene set overlap, P = 3.48e-237). e, f, ACSS2 target genes with alcohol-induced H3K9ac (e) and H3K27ac (f) in vivo are upregulated by acetate in HPC neurons in vitro. ACSS2i blocks this gene induction (box-and-whisker plots show median value with whiskers extending to 1.5x the interquartile range; n = 285 genes (e) and n= 362 genes (f) tested against an equal number of control genes using two-sided Mann-Whitney rank-sum test; P = 0.0077 (e), P = 0.0013 (f)).
Figure 4 |
Figure 4 |
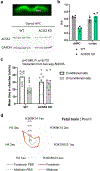
ACSS2 is required for alcohol-induced associative learning. a, Schematic of ethanol-induced conditioned place preference (CPP). b, Preference scores for the ethanol-paired chamber in wild-type (WT) mice (n = 8; data are mean ± s.e.m., Wilcoxon matched-pairs signed rank test, P = 0.0391) and for the ethanol-paired chamber in mice with dorsal hippocampal knock-down (KD) of ACSS2 (n = 10; data are mean ± s.e.m., Wilcoxon matched-pairs signed rank test, P = 0.4316). c, Model. Acetate from hepatic alcohol breakdown is activated by neuronal ACSS2 in the brain and readily induces gene-regulatory histone acetylation. d, Metabolized heavy d6-EtOH is incorporated into histone acetylation in the maternal brain. e, Heavy label incorporation into histone acetylation in the fetal brain. Data represent the second of two pools of embryos (n = 4 per pool) from maternal d6-EtOH injection. The Arachne plot axes represent the percentage of the third isotope of the acetylated peptide, corresponding to the D3 labeled form.

Comment in

References

    1. Li X, Egervari G, Wang Y, Berger SL & Lu Z Regulation of chromatin and gene expression by metabolic enzymes and metabolites. Nature Reviews Molecular Cell Biology (2018). doi:10.1038/s41580-018-0029-7 - DOI - PMC - PubMed
    1. Mews P et al. Acetyl-CoA synthetase regulates histone acetylation and hippocampal memory. Nature 546, 381–386 (2017). - PMC - PubMed
    1. Sarkola T, Iles MR, Kohlenberg-Mueller K & Eriksson CJP Ethanol, acetaldehyde, acetate, and lactate levels after alcohol intake in white men and women: effect of 4-methylpyrazole. Alcohol. Clin. Exp. Res. 26, 239–245 (2002). - PubMed
    1. Soliman ML & Rosenberger T a. Acetate supplementation increases brain histone acetylation and inhibits histone deacetylase activity and expression. Mol. Cell. Biochem. 352, 173–80 (2011). - PubMed
    1. Pandey SC, Kyzar EJ & Zhang H Epigenetic basis of the dark side of alcohol addiction. Neuropharmacology 122, 74–84 (2017). - PMC - PubMed

Publication types