. 2019 Oct 8;10(56):5780-5816.
doi: 10.18632/oncotarget.27209.

Mechanisms by which PE21, an extract from the white willow Salix alba, delays chronological aging in budding yeast

Affiliations

Mechanisms by which PE21, an extract from the white willow Salix alba, delays chronological aging in budding yeast

Younes Medkour et al. Oncotarget. .

Abstract

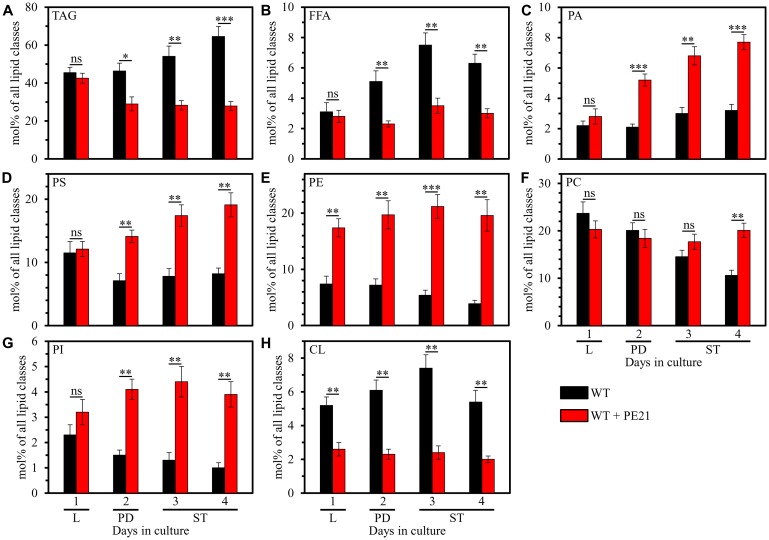
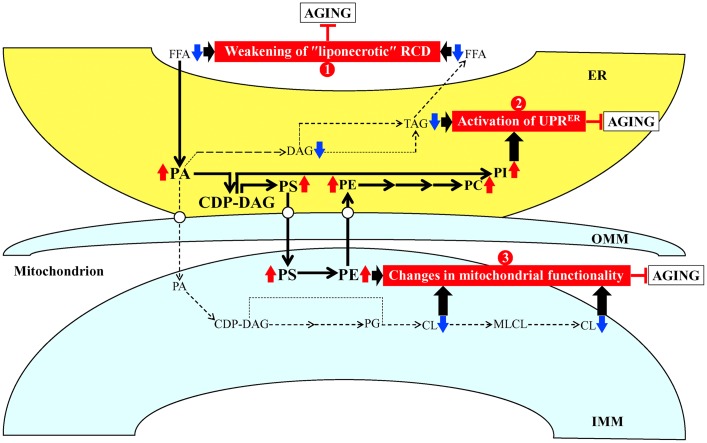
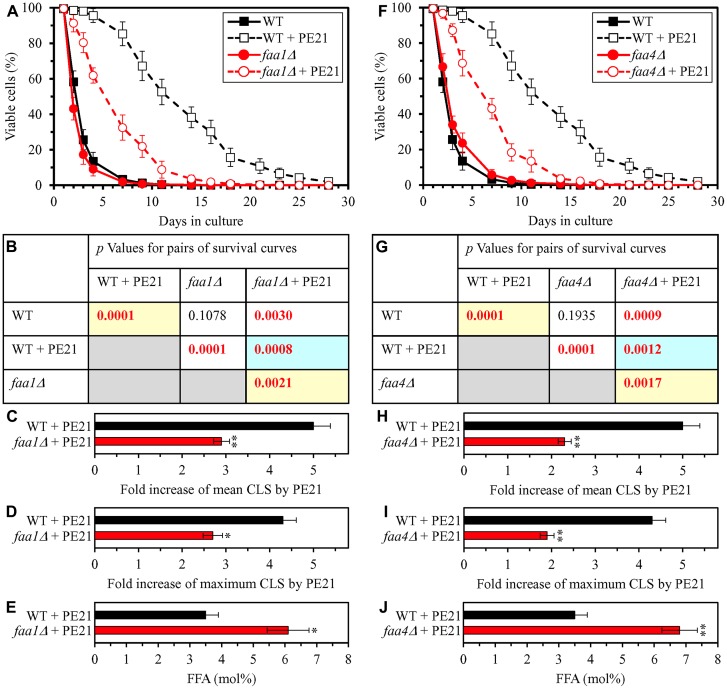
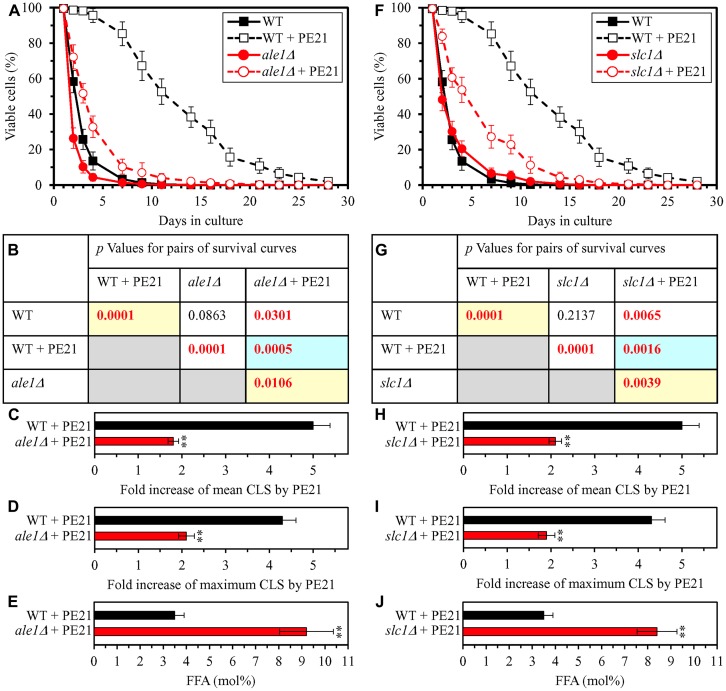
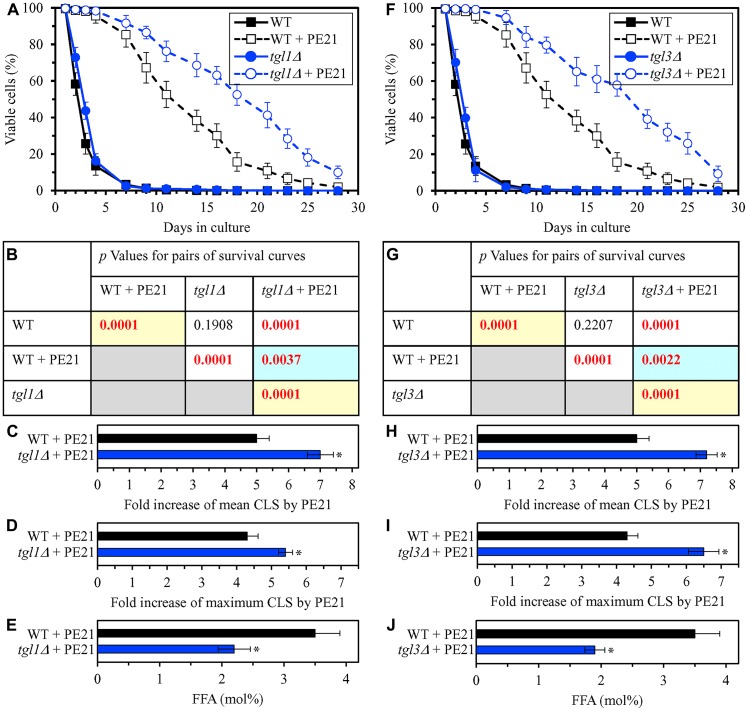
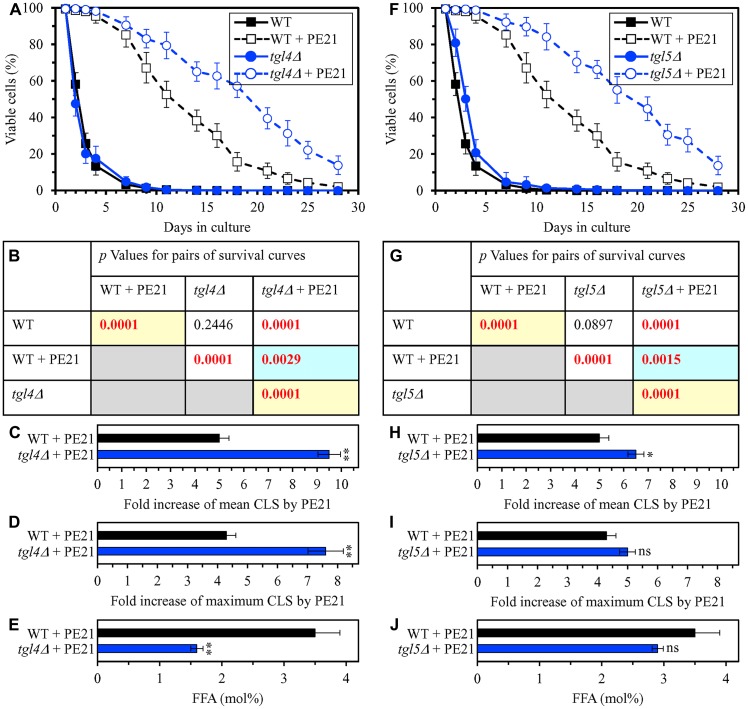
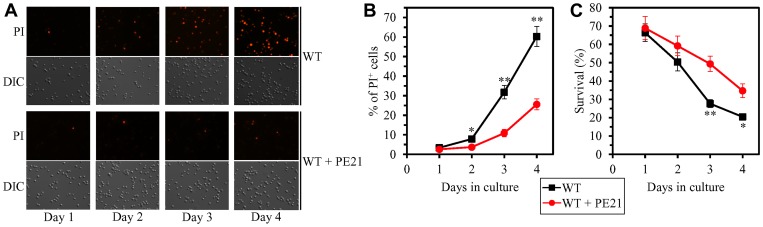
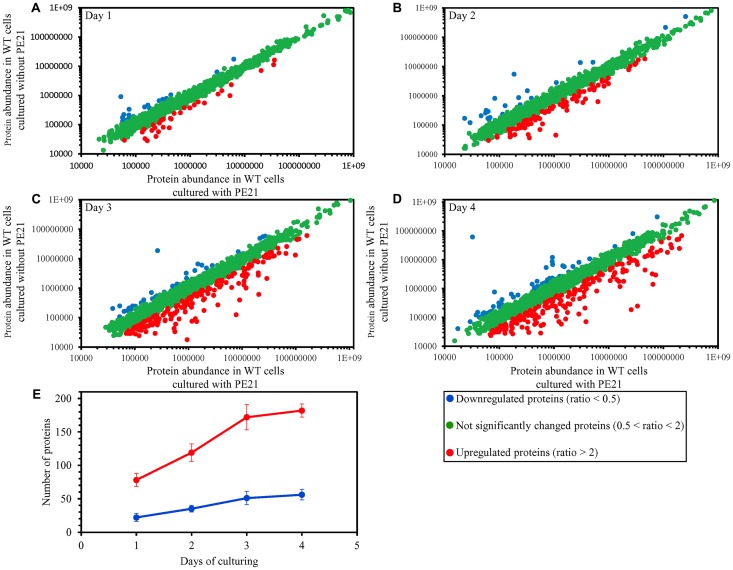
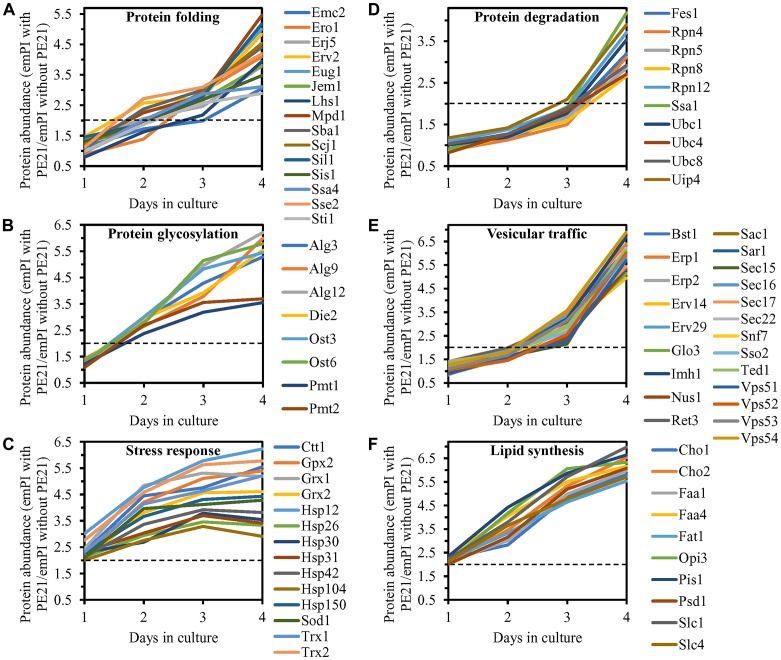
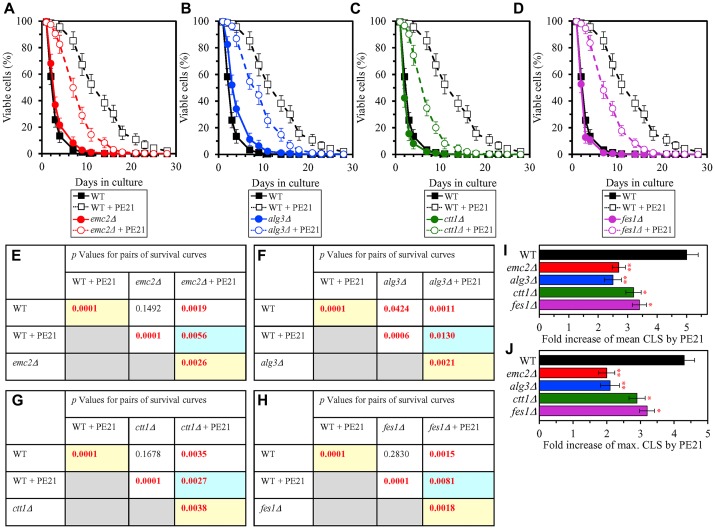
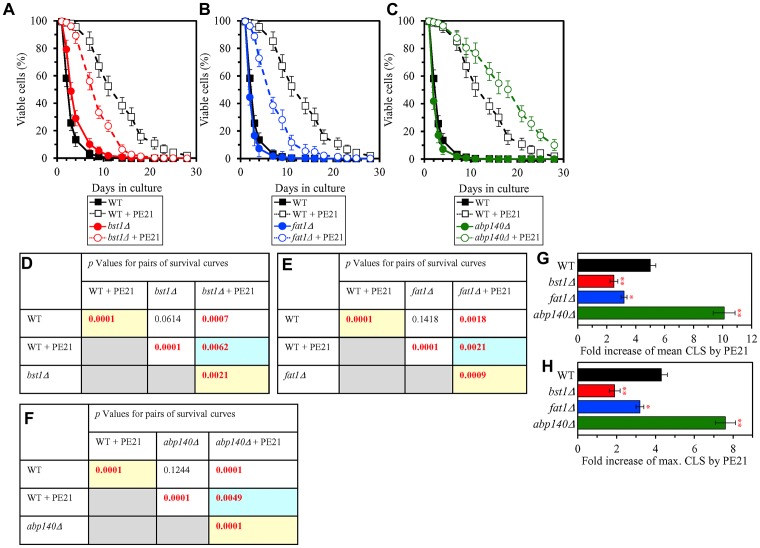
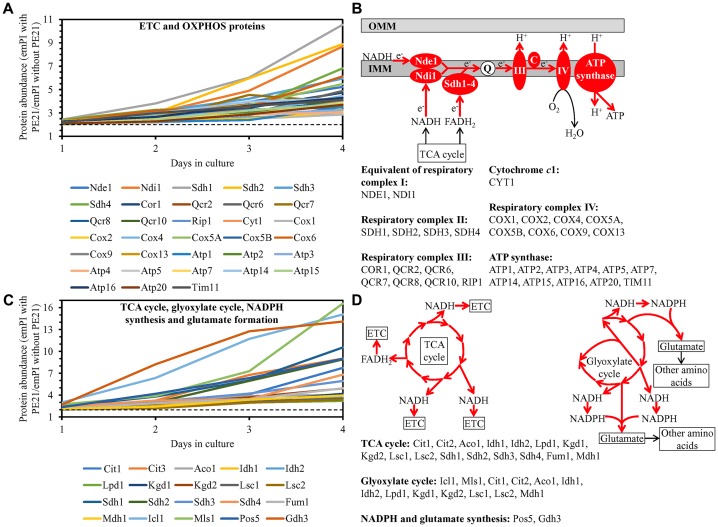
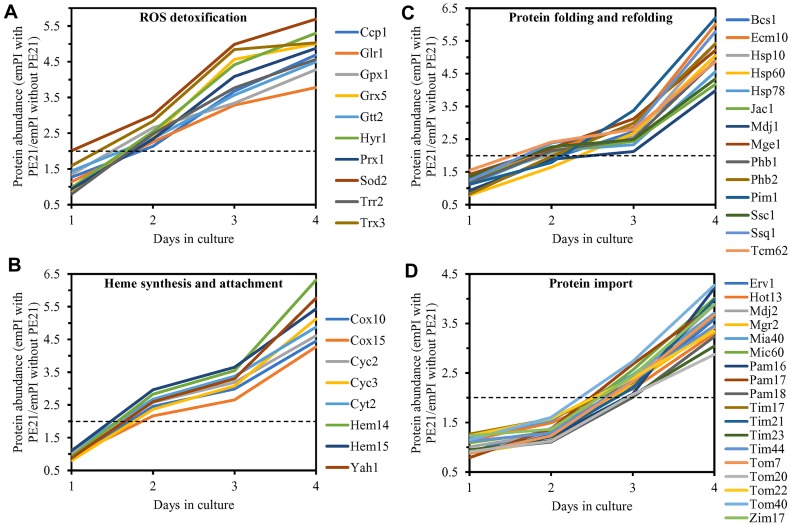
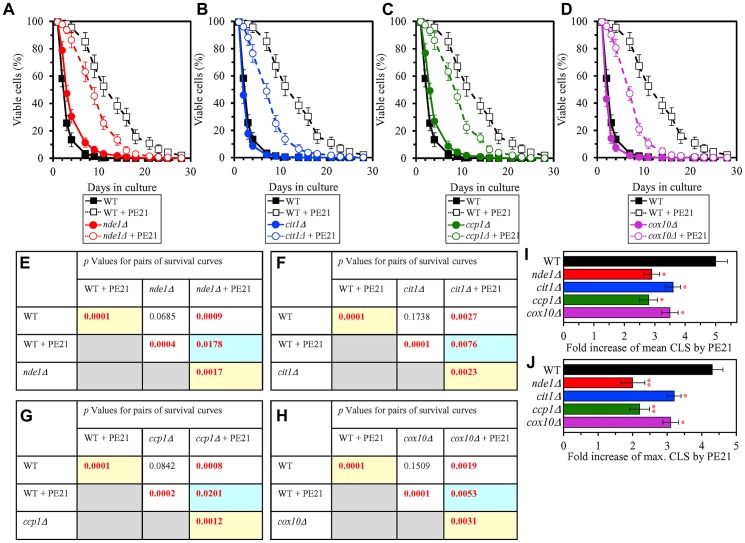
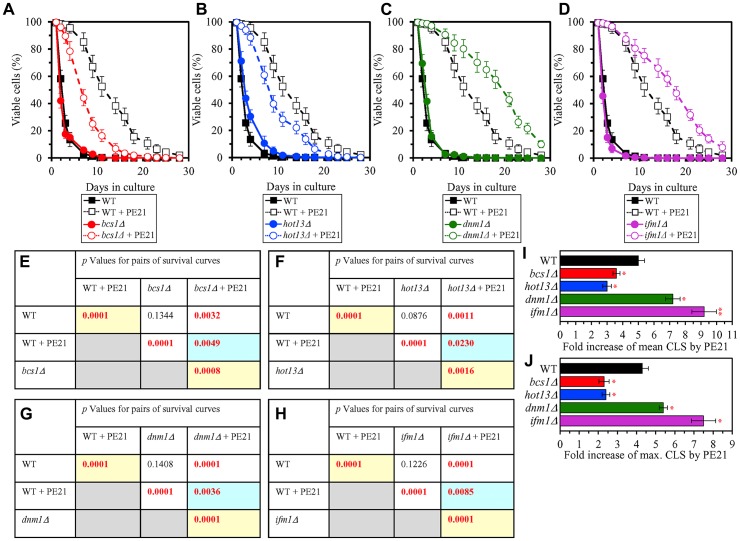
We have recently found that PE21, an extract from the white willow Salix alba, slows chronological aging and prolongs longevity of the yeast Saccharomyces cerevisiae more efficiently than any of the previously known pharmacological interventions. Here, we investigated mechanisms through which PE21 delays yeast chronological aging and extends yeast longevity. We show that PE21 causes a remodeling of lipid metabolism in chronologically aging yeast, thereby instigating changes in the concentrations of several lipid classes. We demonstrate that such changes in the cellular lipidome initiate three mechanisms of aging delay and longevity extension. The first mechanism through which PE21 slows aging and prolongs longevity consists in its ability to decrease the intracellular concentration of free fatty acids. This postpones an age-related onset of liponecrotic cell death promoted by excessive concentrations of free fatty acids. The second mechanism of aging delay and longevity extension by PE21 consists in its ability to decrease the concentrations of triacylglycerols and to increase the concentrations of glycerophospholipids within the endoplasmic reticulum membrane. This activates the unfolded protein response system in the endoplasmic reticulum, which then decelerates an age-related decline in protein and lipid homeostasis and slows down an aging-associated deterioration of cell resistance to stress. The third mechanisms underlying aging delay and longevity extension by PE21 consists in its ability to change lipid concentrations in the mitochondrial membranes. This alters certain catabolic and anabolic processes in mitochondria, thus amending the pattern of aging-associated changes in several key aspects of mitochondrial functionality.

Keywords: cellular aging; geroprotectors; lipid metabolism; mitochondria; necrotic cell death.


Conflict of interest statement

CONFLICTS OF INTEREST The authors declare no conflicts of interest.

Figures

Figure 1
Figure 1. PE21 exhibits age-dependent differential effects on the relative levels of different lipid classes.
Cells of the wild-type (WT) strain were grown in the synthetic minimal YNB medium (0.67% [w/v] yeast nitrogen base without amino acids) initially containing 2% (w/v) glucose, in the presence of 0.1% (w/v) PE21 (ethanol was used as a vehicle at the final concentration of 0.5% [v/v]) or in its absence (cells were subjected to ethanol-mock treatment). Cells were recovered on days 1, 2, 3 and 4 of culturing. Extraction of cellular lipids and mass spectrometric identification and quantitation of different lipid classes were carried out as described in Materials and Based on these data, the relative levels of triacylglycerols [TAG] (A), free fatty acids [FFA] (B), phosphatidic acid [PA] (C), phosphatidylserine [PS] (D), phosphatidylethanolamine [PE] (E), phosphatidylcholine [PC] (F), phosphatidylinositol [PI] (G) and cardiolipin [CL] (H) were calculated as mol% of all lipid classes in cells recovered on day 1, 2, 3 or 4 of culturing. Data are presented as means ± SEM (n = 4; * p < 0.05; ** p < 0.01; *** p < 0.001; ns, not significant). Abbreviations: Logarithmic (L), post-diauxic (PD) or stationary (ST) growth phase.
Figure 2
Figure 2. Possible mechanisms through which PE21 may delay yeast chronological aging.
Arrows next to the names of lipid classes denote those of them whose concentrations are increased (red arrows) or decreased (blue arrows) in yeast cells cultured in the presence of PE21. The thickness of black arrows is proportional to the efficiency with which free fatty acids (FFA) and phosphatidic acid (PA) are included into the synthesis of other lipid classes. There may be at least three different mechanisms by which PE21 delays yeast chronological aging. These mechanisms are numbered. Mechanism 1: PE21 maintains FFA concentration below a toxic threshold, thus weakening an age-related form of FFA-driven liponecrotic regulated cell death (RCD). Mechanism 2: PE21 suppresses TAG formation and promotes glycerophospholipid synthesis in the endoplasmic reticulum (ER), thereby activating the unfolded protein response in the ER (UPRER). Mechanism 3: PE21 increases phosphatidylserine (PS) and phosphatidylethanolamine (PE) concentrations and lower cardiolipin (CL) concentration in mitochondria, thus altering mitochondrial functionality. See text for more details. Other abbreviations: CDP, cytidine diphosphate; DAG, diacylglycerol; IMM, inner mitochondrial membrane; MLCL, monolysocardiolipin; OMM, outer mitochondrial membrane; PC, phosphatidylcholine; PG, phosphatidylglycerol; PI, phosphatidylinositol; TAG, triacylglycerol.
Figure 3
Figure 3. The faa1Δ and faa4Δ mutations eliminate enzymes involved in the incorporation of FFA into PA.
These mutations increase cellular FFA concentration and decrease the efficiency with which PE21 prolongs yeast chronological lifespan (CLS). WT cells and mutant cells carrying a single-gene-deletion mutation eliminating either Faa1 or Faa4 were cultured in the synthetic minimal YNB medium initially containing 2% glucose with 0.1% PE21 or without it. (A, F) Survival curves of the chronologically aging WT and faa1Δ (A) or WT and faa4Δ (F) strains are shown. Data are presented as means ± SEM (n = 3). Data for the WT strain cultured with or without PE21 are replicated in the graphs of (A) and (F) and Figures 4A, 4F, 5A, 5F, 6A, 6F, 10A–10D, 11A–11C, 14A–14D, 15A–15D. (B, G) p Values for different pairs of survival curves of the WT and faa1Δ (B) or WT and faa4Δ (G) strains cultured with or without PE21. Survival curves shown in A or F (respectively) were compared. Two survival curves were considered statistically different if the p value was less than 0.05. The p values for comparing pairs of survival curves using the logrank test were calculated as described in Materials and Methods. The p values displayed on a yellow color background indicate that PE21 statistically significantly prolongs the CLS of the WT, faa1Δ (B) and faa4Δ (G) strains. The p values displayed on a blue color background indicate that PE21 prolongs the CLS of the faa1Δ (B) and faa4Δ (G) strains to a lower extent than that of the WT strain. (C, D, H, I) Survival curves shown in (A, F) were used to calculate the fold of increase of the mean (C, H) and maximum (D, I) CLS by PE21 for the WT and faa1Δ (C, D) and WT and faa4Δ (H, I) strains. Data are presented as means ± SEM (n = 3; * p < 0.05; ** p < 0.01). (E, J) The maximum concentration of free fatty acids (FFA), which was observed in WT and faa1Δ (E) or WT and faa4Δ (J) cells recovered on day 3 of culturing with PE21, is shown. Data are presented as means ± SEM (n = 4; * p < 0.05; ** p < 0.01).
Figure 4
Figure 4. The ale1Δ and slc1Δ mutations eliminate enzymes involved in the incorporation of FFA into PA.
These mutations increase cellular FFA concentration and decrease the efficiency with which PE21 prolongs yeast CLS. WT cells and mutant cells carrying a single-gene-deletion mutation eliminating either Ale1 or Slc1 were cultured in the synthetic minimal YNB medium initially containing 2% glucose with 0.1% PE21 or without it. (A, F) Survival curves of the chronologically aging WT and ale1Δ (A) or WT and slc1Δ (F) strains are shown. Data are presented as means ± SEM (n = 3). Data for the WT strain cultured with or without PE21 are replicated in the graphs of (A) and (F) and Figures 3A, 3F, 5A, 5F, 6A, 6F, 10A–10D, 11A–11C, 14A–14D, 15A–15D. (B, G) p Values for different pairs of survival curves of the WT and ale1Δ (B) or WT and slc1Δ (G) strains cultured with or without PE21. Survival curves shown in (A) or (F) (respectively) were compared. Two survival curves were considered statistically different if the p value was less than 0.05. The p values for comparing pairs of survival curves using the logrank test were calculated as described in Materials and Methods. The p values displayed on a yellow color background indicate that PE21 statistically significantly prolongs the CLS of the WT, ale1Δ (B) and slc1Δ (G) strains. The p values displayed on a blue color background indicate that PE21 prolongs the CLS of the ale1Δ (B) and slc1Δ (G) strains to a lower extent than that of the WT strain. (C, D, H, I) Survival curves shown in (A, F) were used to calculate the fold of increase of the mean (C, H) and maximum (D, I) CLS by PE21 for the WT and ale1Δ (C, D) and WT and slc1Δ (H, I) strains. Data are presented as means ± SEM (n = 3; ** p < 0.01). (E, J) The maximum concentration of free fatty acids (FFA), which was observed in WT and ale1Δ (E) or WT and slc1Δ (J) cells recovered on day 3 of culturing with PE21, is shown. Data are presented as means ± SEM (n = 4; * p < 0.05; ** p < 0.01).
Figure 5
Figure 5. The tgl1Δ and tgl3Δ mutations eliminate enzymes involved in the formation of FFA as products of TAG lipolysis.
These mutations decrease cellular FFA concentration and increase the efficiency with which PE21 prolongs yeast CLS. WT cells and mutant cells carrying a single-gene-deletion mutation eliminating either Tgl1 or Tgl3 were cultured in the synthetic minimal YNB medium initially containing 2% glucose with 0.1% PE21 or without it. (A, F) Survival curves of the chronologically aging WT and tgl1Δ (A) or WT and tgl3Δ (F) strains are shown. Data are presented as means ± SEM (n = 3). Data for the WT strain cultured with or without PE21 are replicated in the graphs of (A) and (F) and Figures 3A, 3F, 4A, 4F, 6A, 6F, 10A–10D, 11A–11C, 14A–14D, 15A–15D. (B, G) p Values for different pairs of survival curves of the WT and tgl1Δ (B) or WT and tgl3Δ (G) strains cultured with or without PE21. Survival curves shown in (A) or (F) (respectively) were compared. Two survival curves were considered statistically different if the p value was less than 0.05. The p values for comparing pairs of survival curves using the logrank test were calculated as described in Materials and Methods. The p values displayed on a yellow color background indicate that PE21 statistically significantly prolongs the CLS of the WT, tgl1Δ (B) and tgl3Δ (G) strains. The p values displayed on a blue color background indicate that PE21 prolongs the CLS of the tgl1Δ (B) and tgl3Δ (G) strains to a lower extent than that of the WT strain. (C, D, H, I) Survival curves shown in (A, F) were used to calculate the fold of increase of the mean (C, H) and maximum (D, I) CLS by PE21 for the WT and tgl1Δ (C, D) and WT and tgl3Δ (H, I) strains. Data are presented as means ± SEM (n = 3; * p < 0.05). (E, J) The maximum concentration of free fatty acids (FFA), which was observed in WT and tgl1Δ (E) or WT and tgl3Δ (J) cells recovered on day 3 of culturing with PE21, is shown. Data are presented as means ± SEM (n = 4; * p < 0.05; ** p < 0.01).
Figure 6
Figure 6. The tgl4Δ and tgl5Δ mutations eliminate enzymes that catalyze the formation of FFA as products of TAG lipolysis.
These mutations cause a decline in cellular FFA concentration and elicit a rise in the efficiency of yeast CLS extension by PE21. WT cells and mutant cells carrying a single-gene-deletion mutation eliminating either Tgl4 or Tgl5 were cultured in the synthetic minimal YNB medium initially containing 2% glucose with 0.1% PE21 or without it. (A, F) Survival curves of the chronologically aging WT and tgl4Δ (A) or WT and tgl5Δ (F) strains are shown. Data are presented as means ± SEM (n = 3). Data for the WT strain cultured with or without PE21 are replicated the graphs of (A) and (F) and Figures 3A, 3F, 4A, 4F, 5A, 5F, 10A–10D, 11A–11C, 14A–14D, 15A–15D. (B, G) p Values for different pairs of survival curves of the WT and tgl4Δ (B) or WT and tgl5Δ (G) strains cultured with or without PE21. Survival curves shown in (A or F) (respectively) were compared. Two survival curves were considered statistically different if the p value was less than 0.05. The p values for comparing pairs of survival curves using the logrank test were calculated as described in Materials and Methods. The p values displayed on a yellow color background indicate that PE21 statistically significantly extends the CLS of the WT, tgl4Δ (B) and tgl5Δ (G) strains. The p values displayed on a blue color background indicate that PE21 extends the CLS of the tgl4Δ (B) and tgl5Δ (G) strains to a lower extent than that of the WT strain. (C, D, H, I) Survival curves shown in (A, F) were used to calculate the fold of increase of the mean (C, H) and maximum (D, I) CLS by PE21 for the WT and tgl4Δ (C, D) and WT and tgl5Δ (H, I) strains. Data are presented as means ± SEM (n = 3; ** p < 0.01; ns, not significant). (E, J) The maximum concentration of free fatty acids (FFA), which was observed in WT and tgl4Δ (E) or WT and tgl5Δ (J) cells recovered on day 3 of culturing with PE21, is shown. Data are presented as means ± SEM (n = 4; * p < 0.05; ** p < 0.01).
Figure 7
Figure 7. PE21 delays an age-related onset of necrotic death in yeast cells, decelerates the progression of the necrotic cell death process, and makes yeast less susceptible to a liponecrotic mode of regulated cell death (RCD).
WT cells were cultured in the synthetic minimal YNB medium initially containing 2% glucose with 0.1% PE21 or without it. (A) Cells recovered on different days of culturing with or without PE21 were visualized using the differential interference contrast (DIC) microscopy and stained with propidium iodide (PI) as described in Materials and Methods. PI positive staining identifies cells that are permeable to PI because their plasma membranes have been damaged. Such loss of plasma membrane integrity is characteristic of necrotic cell death. (B) Percentage of cells displaying PI positive staining, a hallmark event of necrotic cell death. Images like the representative images shown in (A) were quantitated. Data are presented as means ± SEM (n = 3; * p < 0.05; ** p < 0.01). Data for the WT strain cultured with PE21 are replicated in Supplementary Figure 4A–4H. (C) Clonogenic survival of cells recovered on different days of culturing with or without PE21 and then exposed for 2 h to 0.1 mM palmitoleic acid (POA) as described in Materials and Methods. POA is a monounsaturated form of FFA that triggers a liponecrotic mode of RCD. Data are presented as means ± SEM (n = 3; * p < 0.05; ** p < 0.01). Data for the WT strain cultured with PE21 are replicated in Supplementary Figure 5A–5H.
Figure 8
Figure 8. PE21 causes changes in the relative concentrations of many cellular proteins in an age-related manner.
WT cells were cultured in the synthetic minimal YNB medium initially containing 2% glucose with 0.1% PE21 or without it. Cells were recovered on days 1, 2, 3 and 4 of culturing. Mass spectrometry-based identification and quantitation of proteins recovered from these cells, and the calculation of the relative abundance of cellular proteins in a pair of analyzed datasets (i. e. in the datasets of age-matched WT cells cultured with or without PE21), were performed as described in Materials and Methods. (AD) Scatter plots comparing the relative abundance of cellular proteins between specified datasets were plotted on a log-log scale spanning six orders of magnitude. (E) The total number of proteins that are upregulated (displayed in red) or downregulated (displayed in blue) in response to the treatment with PE21. Data are presented as means ± SEM (n = 2).
Figure 9
Figure 9. PE21 increases the abundance of six classes of cellular proteins known to be upregulated during the UPRER response in yeast.
WT cells were cultured in the synthetic minimal YNB medium initially containing 2% glucose with 0.1% PE21 or without it. Cells were recovered on days 1, 2, 3 and 4 of culturing. Mass spectrometry-based identification and quantitation of proteins recovered from these cells, and the calculation of the relative abundance of cellular proteins in a pair of analyzed datasets (i. e. in the datasets of age-matched WT cells cultured with or without PE21), were performed as described in Materials and Methods. (AF) Relative levels of proteins in WT cells cultured with PE21 (fold difference relative to those in WT cells cultured without PE21) are shown. These proteins include the following ones: chaperones involved in protein folding and assembly in the endoplasmic reticulum or the cytosol (A), proteins that catalyze N-linked protein glycosylation or O-linked protein mannosylation in the endoplasmic reticulum (B), stress response proteins that prevent and/or repair an oxidative or thermal damage to proteins in the endoplasmic reticulum, cytosol and plasma membrane (C), proteins involved in the degradation of improperly folded proteins accumulated in the endoplasmic reticulum via the ubiquitin-proteasome pathway (D), proteins implicated in vesicular traffic from the endoplasmic reticulum throughout the secretory pathway (E), and proteins that catalyze the synthesis of lipids in the endoplasmic reticulum and mitochondria (F). The 2-fold increase in the ratio “protein abundance with PE21/protein abundance without PE21” is shown by a dotted line. Data are presented as mean values of 2 independent experiments. Abbreviation: emPAI, the exponentially modified protein abundance index, a measure of the relative abundance of cellular proteins in a pair of analyzed datasets.
Figure 10
Figure 10. Single-gene-deletion mutations eliminating proteins that are upregulated by both PE21 and UPRER stimuli decrease the efficiency with which PE21 extends yeast longevity.
WT cells and mutant cells carrying a single-gene-deletion mutation eliminating either Emc2, Alg3, Ctt1 or Fes1 were cultured in the synthetic minimal YNB medium initially containing 2% glucose with 0.1% PE21 or without it. (AD) Survival curves of the chronologically aging WT and emc2Δ (A), WT and alg3Δ (B), WT and ctt1Δ (C) or WT and fes1Δ (D) strains are shown. Data are presented as means ± SEM (n = 3). Data for the WT strain cultured with or without PE21 are replicated in the graphs of (A) and (F) and Figures 3A, 3F, 4A, 4F, 5A, 5F, 6A, 6F, 11A–11C, 14A–14D, 15A–15D. (EH) p Values for different pairs of survival curves of the WT and emc2Δ (E), WT and alg3Δ (F), WT and ctt1Δ (G) or WT and fes1Δ (H) strains cultured with or without PE21. Survival curves shown in (AD) (respectively) were compared. Two survival curves were considered statistically different if the p value was less than 0.05. The p values for comparing pairs of survival curves using the logrank test were calculated as described in Materials and Methods. The p values displayed on a yellow color background indicate that PE21 statistically significantly prolongs the CLS of the WT (EH), emc2Δ (E), alg3Δ (F), ctt1Δ (G) and fes1Δ (H) strains. The p values displayed on a blue color background indicate that PE21 prolongs the CLS of the emc2Δ (E), alg3Δ (F), ctt1Δ (G) and fes1Δ (H) strains to a lower extent than that of the WT strain. (I, J) Survival curves shown in (AD) were used to calculate the fold of increase of the mean (I) and maximum (J) CLS by PE21 for the WT, emc2Δ, alg3Δ, ctt1Δ and fes1Δ strains. Data are presented as means ± SEM (n = 3; * p < 0.05; ** p < 0.01).
Figure 11
Figure 11. Single-gene-deletion mutations eliminating proteins that are upregulated by both PE21 and UPRER stimuli decrease the efficiency with which PE21 extends yeast longevity, while a single-gene-deletion mutation eliminating a protein that is downregulated by both PE21 and UPRER stimuli increases such efficiency.
WT cells and mutant cells carrying a single-gene-deletion mutation eliminating either Bst1, Fat1 or Abp140 were cultured in the synthetic minimal YNB medium initially containing 2% glucose with 0.1% PE21 or without it. (AC) Survival curves of the chronologically aging WT and bst1Δ (A), WT and fat1Δ (B) or WT and abp140Δ (C) strains are shown. Data are presented as means ± SEM (n = 3). Data for the WT strain cultured with or without PE21 are replicated in the graphs of (A) and (F) and Figures 3A, 3F, 4A, 4F, 5A, 5F, 6A, 6F, 10A–10D, 14A–14D, 15A–15D. (DF) p Values for different pairs of survival curves of the WT and bst1Δ (D), WT and fat1Δ (E) or WT and abp140Δ (F) strains cultured with or without PE21. Survival curves shown in AC (respectively) were compared. Two survival curves were considered statistically different if the p value was less than 0.05. The p values for comparing pairs of survival curves using the logrank test were calculated as described in Materials and Methods. The p values displayed on a yellow color background indicate that PE21 statistically significantly prolongs the CLS of the WT (DF), bst1Δ (D), fat1Δ (E) and abp140Δ (F) strains. The p values displayed on a blue color background indicate the following: 1) PE21 prolongs the CLS of the bst11Δ (D) and fat1Δ (E) strains to a lower extent than that of the WT strain; and 2) PE21 prolongs the CLS of the fat1Δ strain (F) to a higher extent than that of the WT strain. (G, H) Survival curves shown in (AC) were used to calculate the fold of increase of the mean (G) and maximum (H) CLS by PE21 for the WT, bst1Δ, fat1Δ and abp140Δ strains. Data are presented as means ± SEM (n = 3; * p < 0.05; ** p < 0.01).
Figure 12
Figure 12. PE21 increases the abundance of proteins involved in the mitochondrial electron transport chain (ETC), oxidative phosphorylation (OXPHOS) system, tricarboxylic acid (TCA) cycle (TCA), glyoxylate cycle, NADPH synthesis and glutamate formation.
WT cells were cultured in the synthetic minimal YNB medium initially containing 2% glucose with 0.1% PE21 or without it. Cells were recovered on days 1, 2, 3 and 4 of culturing. Mass spectrometry-based identification and quantitation of proteins recovered from these cells, and the calculation of the relative abundance of cellular proteins in a pair of analyzed datasets (i. e. in the datasets of age-matched WT cells cultured with or without PE21), were performed as described in Materials and Methods. (A, C) Relative levels of proteins in WT cells cultured with PE21 (fold difference relative to those in WT cells cultured without PE21) are shown. The 2-fold increase in the ratio “protein abundance with PE21/protein abundance without PE21” is shown by a dotted line. Data are presented as mean values of 2 independent experiments. (B) Protein components of the mitochondrial ETC and OXPHOS system whose concentrations are increased in yeast cells cultured in the presence of PE21 are displayed in red color. The names of these protein components are provided. Red arrows denote the reactions of electron transport, proton transfer across the inner mitochondrial membrane (IMM) and ATP synthesis that are accelerated due to a PE21-dependent upregulation of protein components of the mitochondrial ETC and OXPHOS system. (D) Red arrows indicate the reactions of the TCA cycle, glyoxylate cycle, NADPH synthesis and glutamate formation that are accelerated because of a PE21-dependent upregulation of protein components involved in these metabolic processes within mitochondria. The names of these protein components are provided. Other abbreviations: C, cytochrome c; emPAI, the exponentially modified protein abundance index, a measure of the relative abundance of cellular proteins in a pair of analyzed datasets; OMM, outer mitochondrial membrane; Q, ubiquinone (coenzyme Q); III and IV, respiratory complexes III and IV of the mitochondrial ETC.
Figure 13
Figure 13. PE21 increases the abundance of mitochondrial proteins implicated in ROS detoxification, heme synthesis and protein attachment, protein folding and refolding, and protein import into mitochondria.
WT cells were cultured in the synthetic minimal YNB medium initially containing 2% glucose with 0.1% PE21 or without it. Cells were recovered on days 1, 2, 3 and 4 of culturing. Mass spectrometry-based identification and quantitation of proteins recovered from these cells, and the calculation of the relative abundance of cellular proteins in a pair of analyzed datasets (i. e. in the datasets of age-matched WT cells cultured with or without PE21), were performed as described in Materials and Methods. Relative levels of proteins in WT cells cultured with PE21 (fold difference relative to those in WT cells cultured without PE21) are shown. These proteins include the following ones: mitochondrial proteins involved in ROS detoxification and oxidative stress protection (A), enzymes catalyzing heme synthesis and proteins facilitating heme attachment to other proteins (B), chaperones assisting in the folding and refolding of other mitochondrial proteins (C), components of the mitochondrial protein import machinery (D). The 2-fold increase in the ratio “protein abundance with PE21/protein abundance without PE21” is shown by a dotted line. Data are presented as mean values of 2 independent experiments. Abbreviation: emPAI, the exponentially modified protein abundance index, a measure of the relative abundance of cellular proteins in a pair of analyzed datasets.
Figure 14
Figure 14. Single-gene-deletion mutations eliminating mitochondrial proteins that are upregulated by PE21 reduce the geroprotective potential of PE21.
WT cells and mutant cells carrying a single-gene-deletion mutation eliminating either Nde1, Cit1, Ccp1 or Cox10 were cultured in the synthetic minimal YNB medium initially containing 2% glucose with 0.1% PE21 or without it. (AD) Survival curves of the chronologically aging WT and nde1Δ (A), WT and cit1Δ (B), WT and ccp1Δ (C) or WT and cox10Δ (D) strains are shown. Data are presented as means ± SEM (n = 3). Data for the WT strain cultured with or without PE21 replicated in the graphs of (A) and (F) And Figures 3A, 3F, 4A, 4F, 5A, 5F, 6A, 6F, 10A–10D, 11A–11C, 15A–15D. (EH) p Values for different pairs of survival curves of the WT and nde1Δ (E), WT and cit1Δ (F), WT and ccp1Δ (G) or WT and cox10Δ (H) strains cultured with or without PE21. Survival curves shown in AD (respectively) were compared. Two survival curves were considered statistically different if the p value was less than 0.05. The p values for comparing pairs of survival curves using the logrank test were calculated as described in Materials and Methods. The p values displayed on a yellow color background indicate that PE21 statistically significantly prolongs the CLS of the WT (E–H), nde1Δ (E), cit1Δ (F), ccp1Δ (G) and cox10Δ (H) strains. The p values displayed on a blue color background indicate that PE21 prolongs the CLS of the nde1Δ (E), cit1Δ (F), ccp1Δ (G) and cox10Δ (H) strains to a lower extent than that of the WT strain. (I, J) Survival curves shown in (AD) were used to calculate the fold of increase of the mean (I) and maximum (J) CLS by PE21 for the WT, nde1Δ, cit1Δ, ccp1Δ and cox10Δ strains. Data are presented as means ± SEM (n = 3; * p < 0.05; ** p < 0.01).
Figure 15
Figure 15. Single-gene-deletion mutations eliminating mitochondrial proteins that are upregulated by PE21 decrease the geroprotective potential of PE21, whereas single-gene-deletion mutations eliminating mitochondrial proteins that are downregulated by PE21 increases such potential.
WT cells and mutant cells carrying a single-gene-deletion mutation eliminating either Bcs1, Hot13, Dnm1 or Ifm1 were cultured in the synthetic minimal YNB medium initially containing 2% glucose with 0.1% PE21 or without it. (AD) Survival curves of the chronologically aging WT and bcs1Δ (A), WT and hot13Δ (B), WT and dnm1Δ (C) or WT and ifm1Δ (D) strains are shown. Data are presented as means ± SEM (n = 3). Data for the WT strain cultured with or without PE21 are replicated in the graphs of (A) and (F) and Figures 3A, 3F, 4A, 4F, 5A, 5F, 6A, 6F, 10A–10D, 11A–11C, 14A–14D. (EH) p Values for different pairs of survival curves of the WT and bcs1Δ (E), WT and hot13Δ (F), WT and dnm1Δ (G) or WT and ifm1Δ (H) strains cultured with or without PE21. Survival curves shown in AD (respectively) were compared. Two survival curves were considered statistically different if the p value was less than 0.05. The p values for comparing pairs of survival curves using the logrank test were calculated as described in Materials and Methods. The p values displayed on a yellow color background indicate that PE21 statistically significantly prolongs the CLS of the WT (EH), bcs1Δ (E), hot13Δ (F), dnm1Δ (G) and ifm1Δ (H) strains. The p values displayed on a blue color background indicate that PE21 prolongs the CLS of the bcs1Δ (E), hot13Δ (F), dnm1Δ (G) and ifm1Δ (H) strains to a lower extent than that of the WT strain. (I, J) Survival curves shown in (AD) were used to calculate the fold of increase of the mean (I) and maximum (J) CLS by PE21 for the WT, bcs1Δ, hot13Δ, dnm1Δ and ifm1Δ strains. Data are presented as means ± SEM (n = 3; * p < 0.05; ** p < 0.01).

Similar articles

Cited by

References

    1. Fontana L, Partridge L, Longo VD. Extending healthy life span-from yeast to humans. Science. 2010; 328:321–26. 10.1126/science.1172539. - DOI - PMC - PubMed
    1. Kaeberlein M. Lessons on longevity from budding yeast. Nature. 2010; 464:513–19. 10.1038/nature08981. Erratum in: Nature. 2010 Apr 29;464(7293):1390. 10.1038/nature09046. - DOI - DOI - PMC - PubMed
    1. Weissman J, Guthrie C, Fink GR. Guide to Yeast Genetics: Functional Genomics, Proteomics, and Other Systems Analyses Burlington: Academic Press; 2010. Available from: https://www.elsevier.com/books/guide-to-yeast-genetics-functional-genomi....
    1. Botstein D, Fink GR. Yeast: an experimental organism for 21st Century biology. Genetics. 2011; 189:695–704. 10.1534/genetics.111.130765. - DOI - PMC - PubMed
    1. Longo VD, Shadel GS, Kaeberlein M, Kennedy B. Replicative and chronological aging in Saccharomyces cerevisiae. Cell Metab. 2012; 16:18–31. 10.1016/j.cmet.2012.06.002. - DOI - PMC - PubMed