. 2019 Aug 5:7:23.
doi: 10.1038/s41413-019-0062-y. eCollection 2019.

Sustained Akt signaling in articular chondrocytes causes osteoarthritis via oxidative stress-induced senescence in mice

Affiliations

Sustained Akt signaling in articular chondrocytes causes osteoarthritis via oxidative stress-induced senescence in mice

Jing Xie et al. Bone Res. .

Abstract

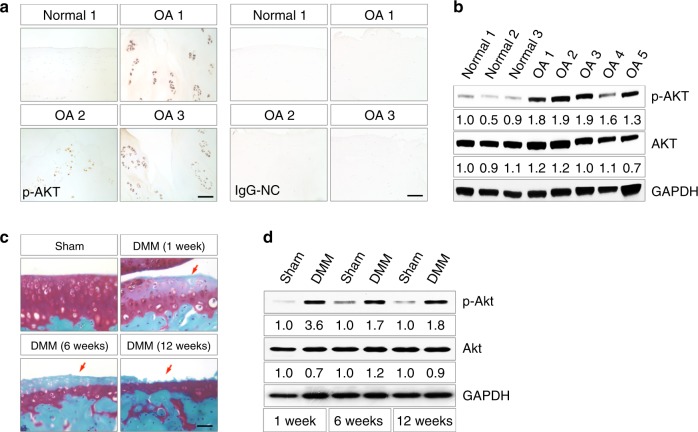
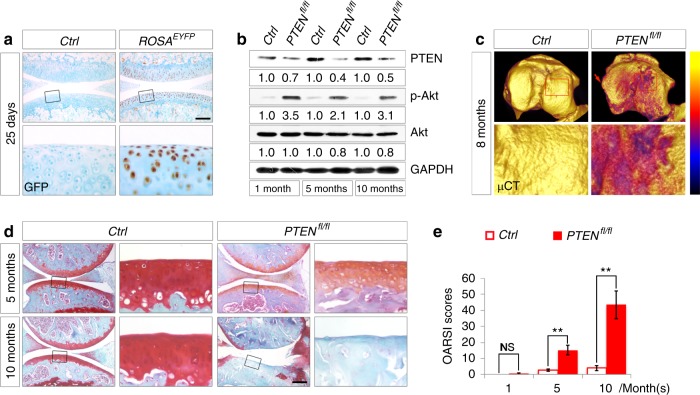
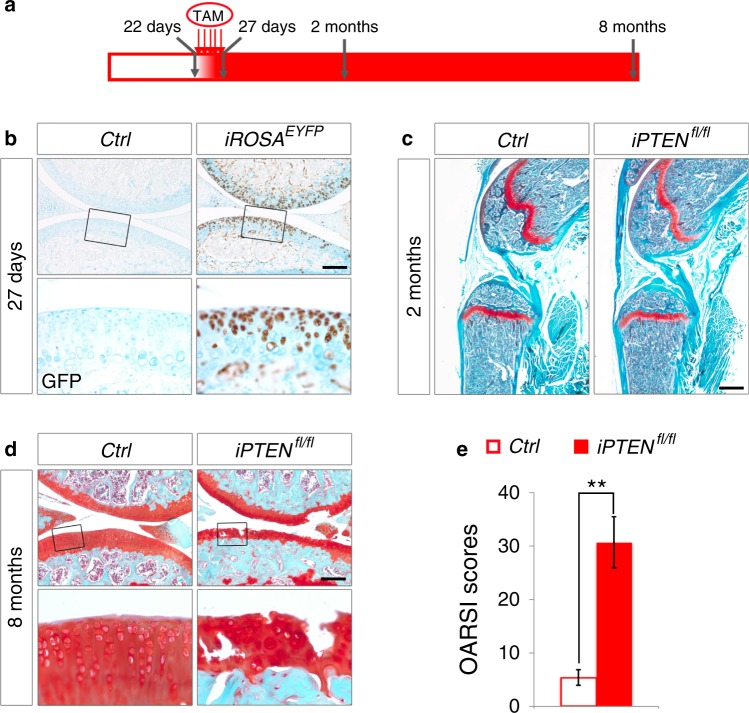
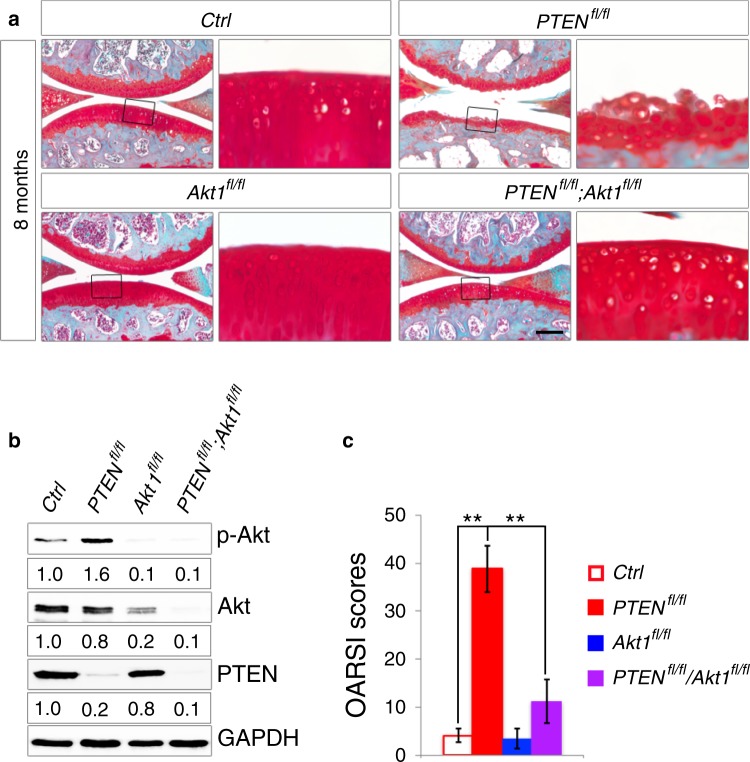
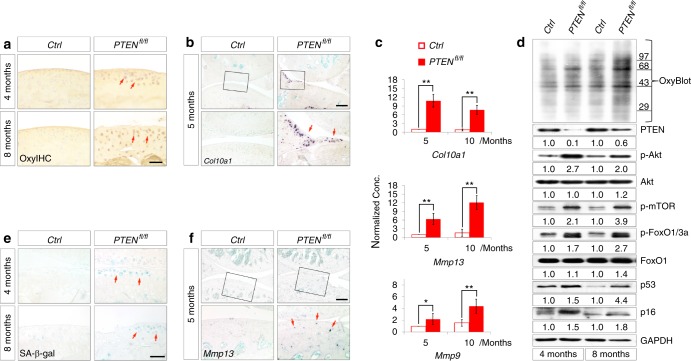
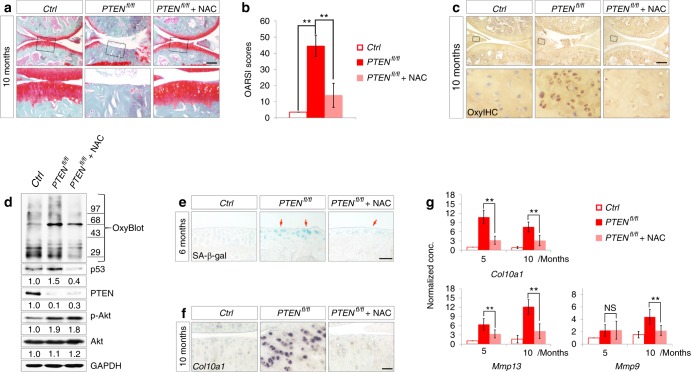
Osteoarthritis (OA) is an age-related disorder that is strongly associated with chondrocyte senescence. The causal link between disruptive PTEN/Akt signaling and chondrocyte senescence and the underlying mechanism are unclear. In this study, we found activated Akt signaling in human OA cartilage as well as in a mouse OA model with surgical destabilization of the medial meniscus. Genetic mouse models mimicking sustained Akt signaling in articular chondrocytes via PTEN deficiency driven by either Col2a1-Cre or Col2a1-Cre ERT2 developed OA, whereas restriction of Akt signaling reversed the OA phenotypes in PTEN-deficient mice. Mechanistically, prolonged activation of Akt signaling caused an accumulation of reactive oxygen species and triggered chondrocyte senescence as well as a senescence-associated secretory phenotype, whereas chronic administration of the antioxidant N-acetylcysteine suppressed chondrocyte senescence and mitigated OA progression in PTEN-deficient mice. Therefore, inhibition of Akt signaling by PTEN is required for the maintenance of articular cartilage. Disrupted Akt signaling in articular chondrocytes triggers oxidative stress-induced chondrocyte senescence and causes OA.

Keywords: Bone; Physiology.


Conflict of interest statement

Competing interestsThe authors declare no competing interests.

Figures

Fig. 1
Fig. 1
Akt signaling is activated during OA development. a Representative images of immunohistochemical staining of p-AKT in human articular cartilage from traumatic knee joints (normal) and knee arthroplasties of OA patients (OA). Nonimmunized rabbit IgG was used as the negative control (IgG-NC). b Western blot analysis for p-AKT levels in human normal cartilage and OA cartilage. Quantitative densitometry results are shown below. The GAPDH protein serves as an endogenous normalizer, and the results of each band are then normalized to the value of the “Normal 1” sample. c Representative images of safranin O staining of mouse knee joints at 1, 6, and 12 weeks after Sham or DMM surgery performed at 8-week-old (n = 3 per group). Arrows denote the articular surface of knee joints that show progressive loss of integrity. d Western blot analysis for p-Akt levels in articular cartilage of knee joints at 1, 6, and 12 weeks after Sham or DMM surgery. Quantitative densitometry results are shown below. The GAPDH protein serves as an endogenous normalizer. Scale bars: 100 µm in (a); 40 µm in (c)
Fig. 2
Fig. 2
PTEN deficiency in articular chondrocytes causes OA in mice. a Representative images of immunohistochemical staining of EYFP in sagittal sections of 25-day-old Ctrl and ROSAEYFP knee joints (n = 2 per group). The framed area in each picture is shown below at a higher magnification. b Western blot analyses for the levels of PTEN, Akt, and p-Akt in articular cartilage from Ctrl and PTENfl/fl mice at 1, 5, and 10 months. Quantitative densitometry results are shown below. The GAPDH protein serves as an endogenous normalizer. c Representative color-coded 3D-reconstructed μCT images of the tibial plateau from Ctrl and PTENfl/fl mice at 8 months (n = 3 per group). A color scale bar ranging from yellow to black is shown to indicate respective HU values from low to high. The arrow denotes an osteophyte at the medial tibial plateau. The framed area in each picture is shown below at a higher magnification. d Representative images of safranin O staining of Ctrl and PTENfl/fl knee joints at 5 and 10 months (n = 8 per group). The framed area in each picture is shown on the right at a higher magnification. e Quantified pathological changes of Ctrl and PTENfl/fl knee joints at 1, 5, and 10 months. Each value represents the mean ± SEM (n = 8 per group). NS: not significant; **P< 0.01. Scale bars: 200 µm in (a); 250 µm in (d)
Fig. 3
Fig. 3
Induced PTEN deficiency in adult articular chondrocytes causes OA phenotypes in mice. a Schematic diagram showing the protocol of tamoxifen administration for starting ROSAEYFP expression or ablating the PTEN gene in articular chondrocytes. Five successive doses of tamoxifen were injected every day since 22-day-old. Knee joints were analyzed at 27 days, 2 months and 8 months of age. b Representative images of immunohistochemical staining of EYFP in articular cartilage from 27-day-old Ctrl and iROSAEYFP mice (n = 3 per group). Tamoxifen was injected since 22-day-old. The framed area in each picture is shown below at a higher magnification. c Representative images of safranin O staining of hind limbs from 2-month-old Ctrl and iPTENfl/fl mice (n = 4 per group). Tamoxifen was injected since 22-day-old. d Representative images of safranin O staining of knee joints from 8-month-old Ctrl and iPTENfl/fl mice (n = 12 per group). Tamoxifen was injected since 22-day-old. The framed area in each picture is shown below at a higher magnification. e Quantified pathological changes of each group at 8 months. Each value represents the mean ± SEM (n = 12 per group). **P< 0.01. Scale bars: 250 µm in (b) and (d), 800 µm in (c)
Fig. 4
Fig. 4
Genetic inhibition of Akt1 rescues OA development in PTEN-deficient mice. a Representative images of safranin O staining of knee joints from each genotype at 8 months (n = 10 per group). The framed area in each picture is shown on the right at a higher magnification. b Western blot analyses for the levels of p-Akt, Akt and PTEN in articular cartilage from each genotype. Quantitative densitometry results are shown below. The GAPDH protein serves as an endogenous normalizer. c Quantified pathological changes in knee joints from each genotype at 8 months of age. Each value represents the mean ± SEM (n = 10 per group). **P< 0.01. Scale bar: 250 µm
Fig. 5
Fig. 5
Sustained Akt signaling in articular chondrocytes causes oxidative stress-related senescence. a Representative images of OxyIHC staining of articular cartilage from Ctrl and PTENfl/fl mice at 4 and 8 months (n = 4 per group). Red arrows denote the positive staining within articular chondrocytes of PTENfl/fl mice. b Representative images of Col10a1 in situ hybridization analyses of knee joints from Ctrl and PTENfl/fl mice at 5 months (n = 3 per group). The framed area in each picture is shown below at a higher magnification. Red arrows denote the positively stained cells within the articular cartilage and meniscus of PTENfl/fl mice. c Representative real-time PCR analyses of Col10a1, Mmp13, and Mmp9 expression in articular cartilage from Ctrl and PTENfl/fl mice at 5 and 10 months. Each value represents the mean ± SEM (n = 3 per group). *P< 0.05; **P< 0.01. d OxyBlot analysis for protein oxidation and western blot analyses for the levels of molecules involved in PTEN/Akt senescence axis. Samples were collected from articular cartilage of Ctrl and PTENfl/fl mice at 4 and 8 months. Quantitative densitometry results are shown below. The GAPDH protein serves as an endogenous normalizer. e Representative images of SA-β-gal staining of articular cartilage from Ctrl and PTENfl/fl mice at 4 and 8 months (n = 4 per group). Red arrows denote the senescent articular chondrocytes in PTENfl/fl mice. f Representative images of Mmp13 in situ hybridization analysis of knee joints from Ctrl and PTENfl/fl mice at 5 months (n = 3 per group). The framed area in each picture is shown below at a higher magnification. Red arrows denote the positively stained cells within the articular cartilage of PTENfl/fl mice. Scale bars: 50 µm in (a) and (e), 250 µm in (b) and (f)
Fig. 6
Fig. 6
NAC treatment relieves oxidative stress-induced chondrocyte senescence and mitigates OA phenotypes in PTEN-deficient mice. a Representative images of safranin O staining of articular sections of knee joints from 10-month-old Ctrl and PTENfl/fl mice as well as PTENfl/fl littermates treated with NAC for 9 months (n = 12 per group). b Quantified pathological changes of each group shown in (a). Each value represents the mean ± SEM (n = 12 per group). **P< 0.01. c Representative images of OxyIHC staining of knee joints from each group shown in (a) (n = 3 per group). The framed area in each picture is shown below at a higher magnification. d OxyBlot analysis for protein oxidation and western blot analyses for the levels of p53, PTEN, p-Akt, and Akt in articular cartilage from 6-month-old Ctrl and PTENfl/fl mice as well as PTENfl/fl littermates treated with NAC for 5 months. Quantitative densitometry results are shown below. The GAPDH protein serves as an endogenous normalizer. e Representative images of SA-β-gal staining of articular cartilage from 6-month-old Ctrl and PTENfl/fl mice as well as PTENfl/fl littermates treated with NAC for 5 months (n = 3 per group). Arrows denote senescent articular chondrocytes. f Representative images of Col10a1 in situ hybridization analysis of knee joints from each group shown in (a) (n = 3 per group). g Representative real-time PCR analyses of Col10a1, Mmp13, and Mmp9 expression in articular chondrocytes from 1-, 5- and 10-month-old knee joints. NAC was administered every other day from 1 month to the time of sacrifice. Each value represents the mean ± SEM (n = 3 per group). **P< 0.01. Scale bars: 250 µm in (a) and (c), 50 µm in (e) and (f)

Similar articles

Cited by

References

    1. Glyn-Jones S, et al. Osteoarthritis. Lancet. 2015;386:376–387. doi: 10.1016/S0140-6736(14)60802-3. - DOI - PubMed
    1. Manning BD, Toker A. AKT/PKB Signaling: navigating the network. Cell. 2017;169:381–405. doi: 10.1016/j.cell.2017.04.001. - DOI - PMC - PubMed
    1. Hollander MC, Blumenthal GM, Dennis PA. PTEN loss in the continuum of common cancers, rare syndromes and mouse models. Nat. Rev. Cancer. 2011;11:289–301. doi: 10.1038/nrc3037. - DOI - PMC - PubMed
    1. Chen WS, et al. Growth retardation and increased apoptosis in mice with homozygous disruption of the Akt1 gene. Genes Dev. 2001;15:2203–2208. doi: 10.1101/gad.913901. - DOI - PMC - PubMed
    1. Fukai A, et al. Akt1 in murine chondrocytes controls cartilage calcification during endochondral ossification under physiologic and pathologic conditions. Arthritis Rheum. 2010;62:826–836. doi: 10.1002/art.27296. - DOI - PubMed