

Polarization-sensitive optical coherence elastography
- PMID: 31646039
- PMCID: PMC6788587
- DOI: 10.1364/BOE.10.005162
Polarization-sensitive optical coherence elastography
Abstract
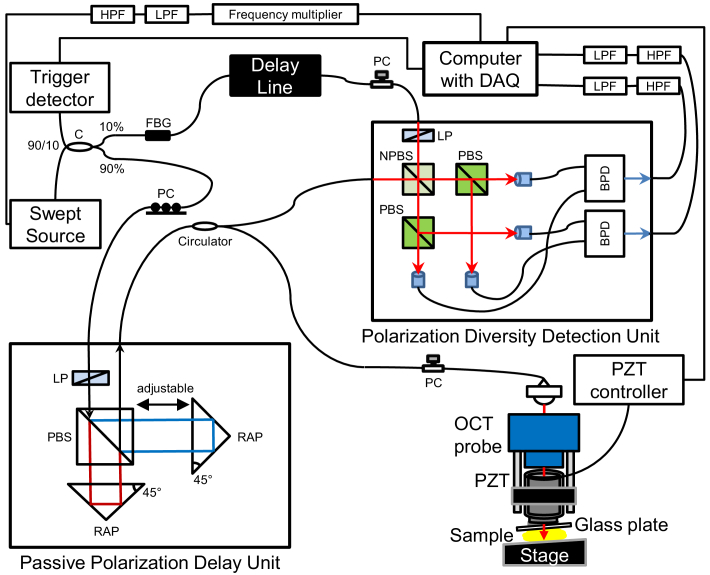
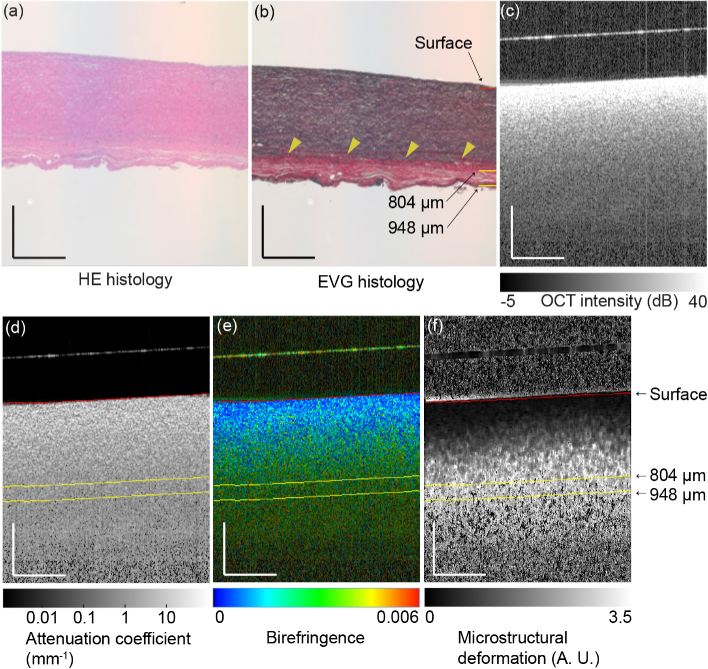
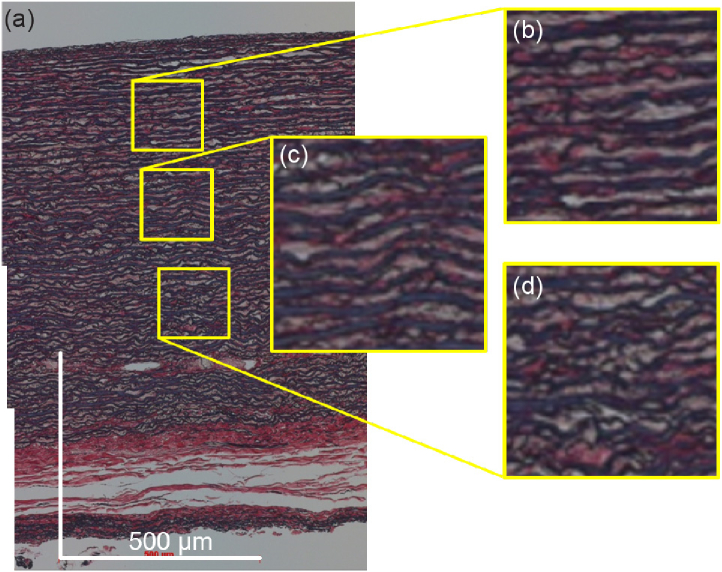
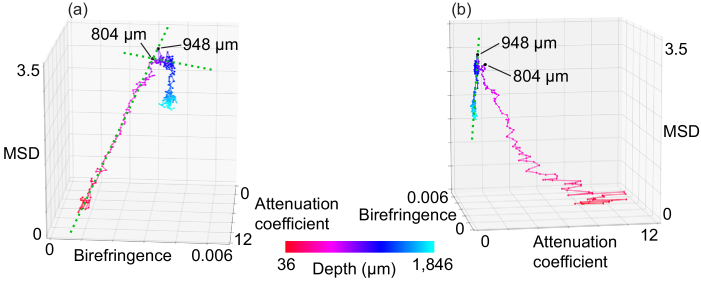
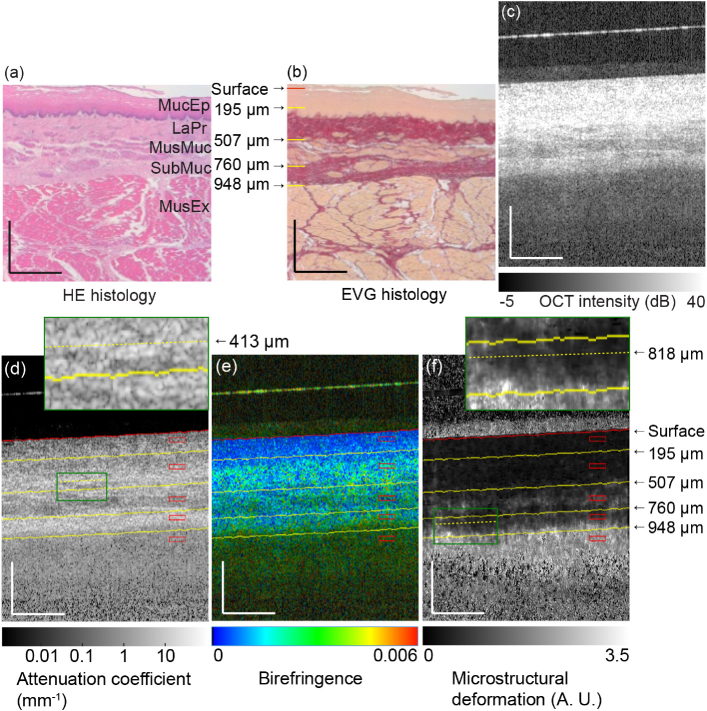
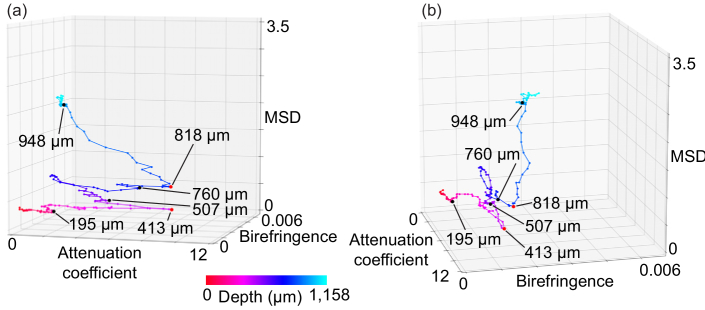
Polarization-sensitive optical coherence elastography (PS-OCE) is developed for improved tissue discrimination. It integrates Jones matrix-based PS-optical coherence tomography (PS-OCT) with compression OCE. The method simultaneously measures the OCT intensity, attenuation coefficient, birefringence, and microstructural deformation (MSD) induced by tissue compression. Ex vivo porcine aorta and esophagus tissues were investigated by PS-OCE and histological imaging. The tissue properties measured by PS-OCE are shown as cross-sectional images and a three-dimensional (3-D) depth-trajectory plot. In this trajectory plot, the average attenuation coefficient, birefringence, and MSD were computed at each depth, and the trajectory in the depth direction was plotted in a 3-D feature space of these three properties. The tissue boundaries in a histological image corresponded with the depth-trajectory inflection points. Histogram analysis and t-distributed stochastic neighbour embedding (t-SNE) visualization of the three tissue properties indicated that the PS-OCE measurements provide sufficient information to discriminate porcine esophagus tissues.
© 2019 Optical Society of America under the terms of the OSA Open Access Publishing Agreement.
Conflict of interest statement
AM, EL: Kao Corp. (F), Yokogawa Electric Corp. (F), Topcon (F), Tomey Corp (F), Nidek (F). SM, YY: Kao Corp. (F), Yokogawa Electric Corp. (F), Topcon (F), Tomey Corp (F, P), Nidek (F). KY, MK, SS: (E) Kao Corp.
Figures

Similar articles
-
Determination of characteristics of degenerative joint disease using optical coherence tomography and polarization sensitive optical coherence tomography.Lasers Surg Med. 2006 Oct;38(9):852-65. doi: 10.1002/lsm.20394. Lasers Surg Med. 2006. PMID: 16998913
-
Compression optical coherence elastography with two-dimensional displacement measurement and local deformation visualization.Opt Lett. 2019 Feb 15;44(4):787-790. doi: 10.1364/OL.44.000787. Opt Lett. 2019. PMID: 30767987
-
Diagnostic Accuracy of Cross-Polarization OCT and OCT-Elastography for Differentiation of Breast Cancer Subtypes: Comparative Study.Diagnostics (Basel). 2020 Nov 24;10(12):994. doi: 10.3390/diagnostics10120994. Diagnostics (Basel). 2020. PMID: 33255263 Free PMC article.
-
Strain and elasticity imaging in compression optical coherence elastography: The two-decade perspective and recent advances.J Biophotonics. 2021 Feb;14(2):e202000257. doi: 10.1002/jbio.202000257. Epub 2020 Nov 3. J Biophotonics. 2021. PMID: 32749033 Review.
-
Optical coherence elastography in ophthalmology.J Biomed Opt. 2017 Dec;22(12):1-28. doi: 10.1117/1.JBO.22.12.121720. J Biomed Opt. 2017. PMID: 29275544 Free PMC article. Review.
Cited by
-
Computational refocusing of Jones matrix polarization-sensitive optical coherence tomography and investigation of defocus-induced polarization artifacts.Biomed Opt Express. 2022 Apr 22;13(5):2975-2994. doi: 10.1364/BOE.454975. eCollection 2022 May 1. Biomed Opt Express. 2022. PMID: 35774308 Free PMC article.
-
Multi-focus averaging for multiple scattering suppression in optical coherence tomography.Biomed Opt Express. 2023 Aug 24;14(9):4828-4844. doi: 10.1364/BOE.493706. eCollection 2023 Sep 1. Biomed Opt Express. 2023. PMID: 37791259 Free PMC article.
-
Label-free metabolic imaging of non-alcoholic-fatty-liver-disease (NAFLD) liver by volumetric dynamic optical coherence tomography.Biomed Opt Express. 2022 Jun 30;13(7):4071-4086. doi: 10.1364/BOE.461433. eCollection 2022 Jul 1. Biomed Opt Express. 2022. PMID: 35991915 Free PMC article.
-
Differentiation of breast tissue types for surgical margin assessment using machine learning and polarization-sensitive optical coherence tomography.Biomed Opt Express. 2021 Apr 29;12(5):3021-3036. doi: 10.1364/BOE.423026. eCollection 2021 May 1. Biomed Opt Express. 2021. PMID: 34168912 Free PMC article.
-
Three-dimensional mechanical characterization of murine skeletal muscle using quantitative micro-elastography.Biomed Opt Express. 2022 Oct 17;13(11):5879-5899. doi: 10.1364/BOE.471062. eCollection 2022 Nov 1. Biomed Opt Express. 2022. PMID: 36733728 Free PMC article.
References
-
- Azuma S., Makita S., Miyazawa A., Ikuno Y., Miura M., Yasuno Y., “Pixel-wise segmentation of severely pathologic retinal pigment epithelium and choroidal stroma using multi-contrast jones matrix optical coherence tomography,” Biomed. Opt. Express 9(7), 2955–2973 (2018).10.1364/BOE.9.002955 - DOI - PMC - PubMed
-
- Kasaragod D., Makita S., Hong Y.-J., Yasuno Y., “Machine-learning based segmentation of the optic nerve head using multi-contrast jones matrix optical coherence tomography with semi-automatic training dataset generation,” Biomed. Opt. Express 9(7), 3220–3243 (2018).10.1364/BOE.9.003220 - DOI - PMC - PubMed
LinkOut - more resources
Full Text Sources