. 2019 Sep 6;8(11):1657374.
doi: 10.1080/2162402X.2019.1657374. eCollection 2019.

Suppression of tumor antigen presentation during aneuploid tumor evolution contributes to immune evasion

Affiliations

Suppression of tumor antigen presentation during aneuploid tumor evolution contributes to immune evasion

Reshmi Tripathi et al. Oncoimmunology. .

Abstract

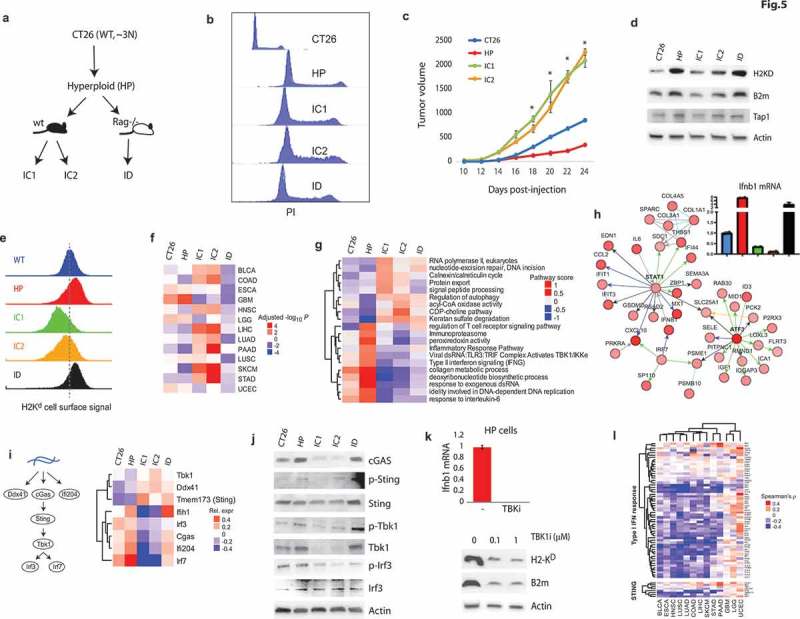
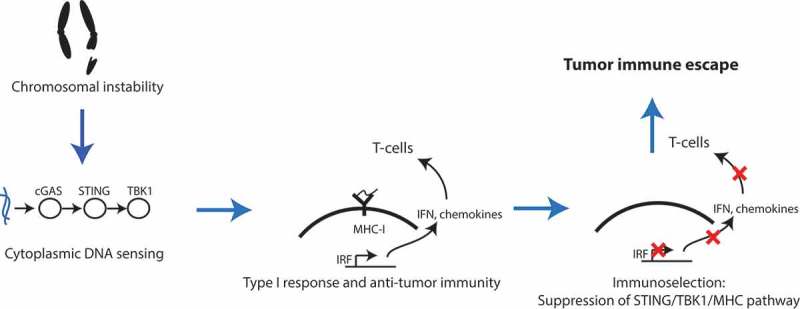
Anti-tumor immune responses impede tumor formation, and cancers have evolved many mechanisms of immune evasion. Confirming earlier findings, we show that human tumors with high chromosomal instability (CIN+) are significantly less immunogenic, as judged by tumor lymphocyte infiltration, compared to those with more stable genomes (CIN-). This finding is paradoxical, as genomic instability is expected to evoke an innate immune response. Importantly, CIN+ tumors and cell lines exhibited suppressed expression of proteins involved in MHC class I antigen presentation at least partly due to DNA hypermethylation of the corresponding genes. Using a mouse model of the in vivo evolution of aneuploid tumors, we found that the induction of chromosomal instability in tumor cells is highly immunogenic due to the activation of the STING/TBK1 pathway and consequent increased interferon signaling and antigen presentation. However, tumors evolving under immune pressure suppress the STING/TBK1 and antigen presentation pathways and evade anti-tumor immune responses. In contrast, CIN+ tumors that develop under low immune pressure in both humans and mice retain efficient MHC class I antigen presentation and immunogenicity. Altogether, this study identifies an important mechanism of immune evasion in chromosomally unstable tumors.

Keywords: Chromosomal Instability; TCGA; cancer aneuploidy; immunoselection.


Figures

Figure 1.
Figure 1.
Chromosomal instability (CIN) correlates with reduced T-lymphocyte infiltration (TLI) in human cancers. a) The distribution of CIN scores (nCNV) across human cancers. b) Correlation of CIN scores with TLI, as measured by the mRNA expression of CD3E in the bulk tumor, in the respective cancres (Spearman’s ρ values shown). c) Correlation of the number of structural genomic rearrangements (SGR) in each tumor sample sample with TLI. SGRs were identified from the whole-genome sequencing studies by a prior study.16 d) A plot of non-synonymous (N.S.) mutation burden and nCNV values in lung adenocarcinoma (LUAD) samples. Each point represents a tumor sample, and its coloring reflects TLI according to the color key. e) Top: the diagram of the SEM model tested. MAF (macrophage), CTL (cytotoxic CD8 + T-cells), CTL* (active CTLs), BC (B-cells), CAF (tumor fibroblasts) and EC (endothelial cells) were defined as latent variables, and the mutational load, nCNV and tumor purity were used as predictors (exogenous variables) to predict their individual partial effects on each of the latent variables (also see Supp. Figure 3A). Bottom: heatmaps showing partial effects (z-scores) of nCNV and mutational burden on each of the factors in the indicated cancers. Red: significant positive impact, Blue: significant negative impact. A z-score of |1.96| corresponds to a p-value of 0.05, so one would expect the pairs that are <-2 or >2 to be significant at P < .05 in this heatmap. The abbreviations of TCGA cancer types are explained in Supplementary Table 1.
Figure 2.
Figure 2.
CIN-associated molecular profiles (signatures) are conserved in some cancer cell lines. a) The distribution of CIN values in cancer cell lines. b) The heatmap of pair-wise comparison (Spearman’s ρ) of the transcriptomic CIN signatures among the indicated cancer tissues and cell lines. Note high similarity of most tissues and some cancer cell line models.
Figure 3.
Figure 3.
Antigen processing and presentation is suppressed in CIN+ cancer tissues and cell lines. a) Heatmap of pathway scores calculated with genome-wide nCNV-mRNA correlations in the indicated cancer tissues and cell lines using NetWalker. As with correlations, a positive score (red) indicates positive association with CIN, and a negative score (blue) indicates a negative association with CIN. b) Network plots of some sample pathways from A, where nodes are colored by their individual nCNV~mRNA correlation values in cancer tissues (for the upper three pathways) and cell lines (for the Antigen presentation pathway at the bottom). c) Barplot of nCNV values in lung cancer cell lines (up) and LUAD samples (bottom), with each bar (sample) colored by its relative expression of ERAP2 (endoplasmic reticulum aminopeptidase 2), a key enzyme in the processing of antigenic peptides for the MHC-I complex.
Figure 4.
Figure 4.
Antigen processing and presentation pathway genes are suppressed in CIN+ tumors through DNA hyper-methylation. a) Correlation of CNVs of indicated APP genes with CIN in the indicated cancer tissues. All of these genes, except for B2M, reside on 6p21-22. b) A plot of HNSC (head and neck cancer, TCGA) samples scattered by their TAP1 CNV (x-axis) and nCNV (y-axis). Coloring of points (samples) is by relative TAP1 mRNA expression. c) Same as in (B), for B2M in LUAD samples. d) Same as in (C), but with the coloring of samples reflecting the relative DNA methylation of B2M. e) Left: a network plot of DNA methyl-transferase genes, with their coloring reflecting the correlation of the expression of the respective genes with nCNV in LUAD. Right: heatmap of correlations of DNA methylation of the indicated genes with nCNV in the indicated cancers. f) Barplots of correlation values of B2M (up) and HLA-A (bottom) with nCNV in the indicated datasets. *: P ≤ 0.05, **: P < .01. g) Correlation of promoter DNA methylation of the indicated genes with nCNV in lung cancer cell lines from CCLE. *: P ≤ 0.05.
Figure 5.
Figure 5.
Inflammatory response signaling and antigen presentation are suppressed in CIN+ tumors by immunoselection. a) Diagram of development of the indicated CT26 cell clones (HP: parental hyperploid, IC: immunoselected hyperploid clone [i.e. passaged in immune-competent mice], ID: hyperploid clone passaged in immune-deficient mice). b) Flow cytometry profiles of DNA content of the indicated cells. c) In vivo tumor growth curves of the indicated lines in immune-competent Balb/c mice. Error bars: s.d. of two mice per group. *: P < .05 by t-test. d) Immunoblots of indicated proteins in the indicated lines. e) Distribution of cell surface expression of H2-KD in the indicated lines as measured by flow cytometry. f) Genome-wide correlation profiles of the transcriptomic signatures of CT26 and its derivative lines with the CIN signatures of indicated cancers from TCGA. The coloring in the heatmap reflects – log10-transformed p-values of Spearman’s rank correlation of the corresponding signatures adjusted by the direction of correlation (i.e. negative indicates negative correlation and vice versa). g) Heatmap of pathway scores calculated from the genome-wide transcriptomic analyses of indicated lines by NetWalker. Pathway scores reflect relative expression in the indicated lines (red: high, blue: low). h) Network plot of the highest scoring sub-network in the HP line from NetWalk analysis. The coloring of nodes reflects their relative expression in HP line. Inset: Ifnb2 mRNA levels measured by qPCR in the WT, HP, IC1, IC2 and ID lines normalized to β-actin. i) Left: a diagram of Sting-mediated cytoplasmic DNA sensing pathway. Right: heatmap of relative expression of the indicated Sting pathway genes in the indicated lines. j) Immunoblot of some key cGas/Tbk1 pathway proteins in the indicated lines. k) Top: Ifnb1 mRNA levels (qPCR) in HP cells upon treatment with the TBK inhibitor. Error bars: s.d. of two replicates. Bottom: Immunoblot of B2m and H2-KD in HP cells before and after treatment with the increasing doses of the TBK1 inhibitor (BX795). l) Heatmap of correlations of type I interferon response (top) and STING (bottom) pathway genes with CIN in the indicated cancers from TCGA. Western blots in the panels D, J and K are representative of at least two independent experiments.
Figure 6.
Figure 6.
Schematic model of the evolution of CIN+ tumors. CIN creates an immune pressure in the nascent tumor cells due to the activation of the STING pathway and subsequent innate anti-tumor response. This immune pressure allows for the selection of CIN+ clones that have uncoupled genomic instability from the activation of the STING pathway activation and consequent immunostimulation. The resultant tumors are thus immunologically cold.

References

    1. Vesely MD, Kershaw MH, Schreiber RD, Smyth MJ.. Natural innate and adaptive immunity to cancer. Annu Rev Immunol. 2011;29:1–11. doi:10.1146/annurev-immunol-031210-101324. - DOI - PubMed
    1. Spranger S, Bao R, Gajewski TF. Melanoma-intrinsic beta-catenin signalling prevents anti-tumour immunity. Nature. 2015;523(7559):231–235. doi:10.1038/nature14404. - DOI - PubMed
    1. Zitvogel L, Tesniere A, Kroemer G. Cancer despite immunosurveillance: immunoselection and immunosubversion. Nat Rev Immunol. 2006;6(10):715–727. doi:10.1038/nri1936. - DOI - PubMed
    1. Sharma P, Allison JP. Immune checkpoint targeting in cancer therapy: toward combination strategies with curative potential. Cell. 2015;161(2):205–214. doi:10.1016/j.cell.2015.03.030. - DOI - PMC - PubMed
    1. Van Allen EM, Miao D, Schilling B, Shukla SA, Blank C, Zimmer L, Sucker A, Hillen U, Foppen MHG, Goldinger SM, et al. Genomic correlates of response to CTLA-4 blockade in metastatic melanoma. Science. 2015;350(6257):207–211. doi:10.1126/science.aad0095. - DOI - PMC - PubMed

Publication types