. 2019 Aug 26;8(11):e1655964.
doi: 10.1080/2162402X.2019.1655964. eCollection 2019.

Apoptotic caspases inhibit abscopal responses to radiation and identify a new prognostic biomarker for breast cancer patients

Affiliations

Apoptotic caspases inhibit abscopal responses to radiation and identify a new prognostic biomarker for breast cancer patients

Maria Esperanza Rodriguez-Ruiz et al. Oncoimmunology. .

Abstract

Caspase 3 (CASP3) has a key role in the execution of apoptosis, and many cancer cells are believed to disable CASP3 as a mechanism of resistance to cytotoxic therapeutics. Alongside, CASP3 regulates stress-responsive immunomodulatory pathways, including secretion of type I interferon (IFN). Here, we report that mouse mammary carcinoma TSA cells lacking Casp3 or subjected to chemical caspase inhibition were as sensitive to the cytostatic and cytotoxic effects of radiation therapy (RT) in vitro as their control counterparts, yet secreted increased levels of type I IFN. This effect originated from the accrued accumulation of irradiated cells with cytosolic DNA, likely reflecting the delayed breakdown of cells experiencing mitochondrial permeabilization in the absence of CASP3. Casp3-/- TSA cells growing in immunocompetent syngeneic mice were more sensitive to RT than their CASP3-proficient counterparts, and superior at generating bona fide abscopal responses in the presence of an immune checkpoint blocker. Finally, multiple genetic signatures of apoptotic proficiency were unexpectedly found to have robust negative (rather than positive) prognostic significance in a public cohort of breast cancer patients. However, these latter findings were not consistent with genetic signatures of defective type I IFN signaling, which were rather associated with improved prognosis. Differential gene expression analysis on patient subgroups with divergent prognosis (as stratified by independent signatures of apoptotic proficiency) identified SLC7A2 as a new biomarker with independent prognostic value in breast cancer patients. With the caveats associated with the retrospective investigation of heterogeneous, public databases, our data suggest that apoptotic caspases may influence the survival of breast cancer patients (or at least some subsets thereof) via mechanisms not necessarily related to type I IFN signaling as they identify a novel independent prognostic biomarker that awaits prospective validation.

Keywords: AGR3; APAF1; BCL2; CASP9; STC2; STING; SUSD3.


Figures

Figure 1.
Figure 1.
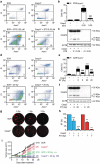
Chemical caspase inhibition fails to impact on the cytotoxic effects of RT. (a,b) Percentage of TSA cells manifesting apoptosis-associated mitochondrial outer membrane permeabilization and plasma membrane breakdown, as assessed by flow cytometry upon staining with the mitochondrial transmembrane potential-sensitive dye DiOC6(3) and the vital dye propidium iodide (PI), following 24 hours of culture in control conditions or in the presence of 0.25 μM staurosporine (STS), 20 μM Z-VAD-fmk, or their combination. Representative dotplots (a) and quantitative results (b) are reported. Numbers indicate the percentage of cells in each quadrant. Results are means ± SEM, n = 2–3 independent experiments, ***p < .001 (One-way ANOVA, as compared to untreated cells); ###p < 0.001 (One-way ANOVA, as compared to cells treated with STS). C. Proteolytic CASP3 activation in TSA cells cultured as in (a,b). Actin, beta (ACTB) levels were monitored to ensure equal loading. D,E. Percentage of TSA cells manifesting biochemical markers of apoptosis, as assessed by flow cytometry upon staining with DiOC6(3) and PI 48 hours after γ irradiation with the indicated dose, alone or in presence of 20 μM Z-VAD-fmk. Representative dotplots (d) and quantitative results (e) are reported. Numbers indicate the percentage of cells in each quadrant. Results are means ± SEM, n = 2–3 independent experiments, ***p < .001 (One-way ANOVA, as compared to untreated cells); n.s., not significant (One-way ANOVA, as compared to cells treated with the same dose of radiation only). F. Proteolytic CASP3 activation in TSA cells cultured as in (d,e). ACTB levels were monitored to ensure equal loading. (g,h). Residual clonogenic potential of TSA cells receiving γ irradiation at the indicated dose, alone or in presence of 20 μM Z-VAD-fmk and allowed to generate colonies for 14 days. Representative images (g) and quantitative results (h) are reported. Results are means ± SEM, n = 2–3 independent experiments, ***p < .001 (One-way ANOVA, as compared to untreated cells); n.s., not significant (One-way ANOVA, as compared to cells treated with the same dose of radiation only). SF, survival fraction.
Figure 2.
Figure 2.
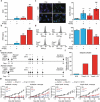
CASP3 is dispensable for the cytotoxic effects of RT in vitro and in vivo. (a,b) Percentage of control (SCR) and Casp3-/- TSA cells manifesting apoptosis-associated phosphatidylserine exposure and plasma membrane breakdown, as assessed by flow cytometry upon staining with fluorescent AnnexinV (AnnV) and the vital dye propidium iodide (PI), following 24 hours of culture in control conditions or in the presence of 0.1 or 0.25 μM staurosporine (STS). Representative dotplots (a) and quantitative results (b) are reported. Numbers indicate the percentage of cells in each quadrant. Results are means ± SEM, n = 2–3 independent experiments, ***p < .001 (One-way ANOVA, as compared to untreated SCR cells); ###p < .001 (One-way ANOVA, as compared to SCR cells treated with STS). C. Proteolytic CASP3 activation in SCR and Casp3-/- TSA cells cultured as in A,B. Actin, beta (ACTB) levels were monitored to ensure equal loading. D,E. Percentage of SCR and Casp3-/- TSA cells manifesting biochemical markers of apoptosis, as assessed by flow cytometry upon staining with fluorescent AnnV and PI 48 hours after γ irradiation with the indicated dose. Representative dotplots (d) and quantitative results (e) are reported. Numbers indicate the percentage of cells in each quadrant. Results are means ± SEM, n = 2–3 independent experiments, ***p < .001 (One-way ANOVA, as compared to untreated SCR cells); n.s., not significant (One-way ANOVA, as compared to SCR cells treated with the same dose of radiation only). (f) Proteolytic CASP3 activation in SCR and Casp3-/- TSA cells cultured as in (d,e). ACTB levels were monitored to ensure equal loading. (g,h). Residual clonogenic potential of SCR and Casp3-/- TSA cells receiving γ irradiation at the indicated dose, and allowed to generate colonies for 14 days. Representative images (g) and quantitative results (h) are reported. Results are means ± SEM, n = 2–3 independent experiments, ***p < .001 (One-way ANOVA, as compared to untreated SCR cells); n.s., not significant (One-way ANOVA, as compared to SCR cells treated with the same dose of radiation only). SF, survival fraction. (i) Growth of SCR and Casp3-/- TSA cells grafted in immunocompetent syngeneic BALB/c mice and optionally subjected to focal γ irradiation with a single fraction of 20 Gy. Results are means ± SEM, n = 6–10 mice/group from 2 independent experiments. Rate of complete disease eradication is reported. ***p < .001 (Two-way ANOVA, as compared to untreated SCR lesions), ###p < .001 (Two-way ANOVA, as compared to irradiated SCR lesions).
Figure 3.
Figure 3.
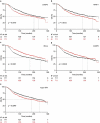
CASP3 inhibits type I IFN secretion in vitro and abscopal responses to RT in vivo. (a). IFNB1 levels in control (SCR) or Casp3-/- TSA cells optionally exposed to γ irradiation (8 Gy) and cultured in control conditions for 48 hours. Results are means ± SEM, n = 2 independent experiments. ***p < .001 (One-way ANOVA, as compared to untreated SCR cells); ###p < .001 (One-way ANOVA, as compared to irradiated SCR cells). (b) Type I IFN levels in the supernatant of SCR or Casp3-/- TSA cells optionally exposed to γ irradiation (8 Gy) and cultured in control conditions for 48 hours. Results are means ± SEM, n = 2 independent experiments. ***p < .001 (One-way ANOVA, as compared to untreated SCR cells); ###p < .001 (One-way ANOVA, as compared to irradiated SCR cells). (c) Cytosolic DNA accumulation in SCR or Casp3-/- TSA cells optionally exposed to γ irradiation (8 Gy) and cultured in control conditions for 24 hours, as assessed by immunofluorescence with a double-stranded DNA-specific antibody. Representative images (scale bar = 10 μm) and quantitative data are reported. Results are means ± SEM and individual data points, n = 2 independent experiments. ***p < .001 (One-way ANOVA, as compared to untreated SCR cells); ###p < .001 (One-way ANOVA, as compared to irradiated SCR cells). D. Mitochondrial transmembrane potential of control (SCR) or Casp3-/- TSA cells optionally exposed to γ irradiation (8 Gy) and cultured in control conditions for 24 hours, as assessed by flow cytometry upon staining with the mitochondrial transmembrane potential-sensitive dye DiOC6(3) and the exclusion dye propidium iodide (PI). PI+ cells (dead cells) are excluded from the analysis. Representative histograms and quantitative data are reported. Results are means ± SEM, n = 2 independent experiments. ###p < .001 (One-way ANOVA, as compared to irradiated SCR cells). (e) Experimental plans for the assessment of abscopal responses. (f) Rejection rate of SCR TSA lesions implanted in syngeneic, immunocompetent BALB/c mice contralaterally to SCR TSA lesions or TSA lesions from 2 distinct Casp3-/- TSA clones (C1 and C2) established 2 days earlier (as per the original schedule depicted in E). Results are from one experiment. (g) Growth of primary (SCR or Casp3-/-, as indicated) and abscopal (SCR) TSA lesions established in syngeneic, immunocompetent BALB/c mice randomly allocated to receive no treatment, focal γ irradiation to the primary lesion in 3 fractions of 8 Gy each, or focal γ irradiation to the primary lesion according to the same schedule plus a CTLA4 blocking antibody (9H10) i.p., as per the revised schedule depicted in (e) Results are means ± SEM, n = 2–10 mice/group from 2 independent experiments. Rate of complete disease eradication at each disease site is reported. ***p < .001, **p < .01, n.s., not significant (Two-way ANOVA, as compared to untreated lesions at the same site).
Figure 4.
Figure 4.
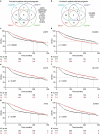
Signatures of apoptotic proficiency are linked to poor survival in breast cancer patients from the METABRIC database. (a–e) Cancer-specific overall survival (OS) of 1422 breast cancer patients from the METABRIC database upon median stratification based on the expression levels of CASP3 (a), APAF1 (b), geometrically meaned BCL2-BCL2L1-MCL1 (c, BCLs), CASP9 (d), or a gene signature of type I IFN signaling (e). N° at risk and p values are reported.
Figure 5.
Figure 5.
Differential gene expression in breast cancer patients with divergent apoptotic proficiency. (a–d) Unsupervised hierarchical clustering of differentially expressed genes (DEGs) in 1422 breast cancer patients from the METABRIC database for whom cancer-specific overall survival data are available, subdivided in 2 groups by median expression levels of CASP3 (a), APAF1 (b), geometrically meaned BCL2-BCL2L1-MCL1 (c, BCLs) or CASP9 (d). Gene set enrichment analysis (GSEA) for the Hallmarks terms “interferon alpha response”, “interferon gamma response” is reported. FDR, false discovery rate; NER, normalized enrichment score. See also Supplemental Tables 1 and 2.
Figure 6.
Figure 6.
Signatures of apoptotic proficiency identify novel genes with prognostic value for breast cancer patients. (a,b) Overlaps among differentially expressed genes (DEGs) enriched in 1422 breast cancer patients from the METABRIC database that exhibit superior (a) or inferior (b) survival upon median stratification based on expression levels of CASP3, APAF1, geometrically meaned BCL2-BCL2L1-MCL1 (BCLs), or CASP9. Genes common to all patients subgroups are indicated. See also Supplemental Table 3. C-H. Cancer-specific overall survival (OS) of 1422 breast cancer patients from the METABRIC database upon median stratification based on the expression levels of AGR3 (c), CALML5 (d), CLIC6 (e), SLC7A2 (f), STC2 (g) or SUSD3 (h). N° at risk and p values are reported.

Comment in

References

    1. Galluzzi L, Vitale I, Aaronson SA, Abrams JM, Adam D, Agostinis P, Alnemri ES, Altucci L, Amelio I, Andrews DW, et al. Molecular mechanisms of cell death: recommendations of the nomenclature committee on cell death 2018. Cell Death Differ. 2018;25:486–541. doi:10.1038/s41418-017-0012-4. - DOI - PMC - PubMed
    1. Fuchs Y, Steller H.. Live to die another way: modes of programmed cell death and the signals emanating from dying cells. Nat Rev Mol Cell Biol. 2015;16:329–344. doi:10.1038/nrm3999. - DOI - PMC - PubMed
    1. Green DR, Galluzzi L, Kroemer G.. Cell biology. Metabolic control of cell death. Science. 2014;345:1250256. - PMC - PubMed
    1. Tait SW, Green DR. Mitochondria and cell death: outer membrane permeabilization and beyond. Nat Rev Mol Cell Biol. 2010;11:621–632. doi:10.1038/nrm2952. - DOI - PubMed
    1. Hanahan D, Weinberg RA. The hallmarks of cancer. Cell. 2000;100:57–70. doi:10.1016/s0092-8674(00)81683-9. - DOI - PubMed

Publication types