. 2019 Sep 7;8(11):e1657375.
doi: 10.1080/2162402X.2019.1657375. eCollection 2019.

A synergistic triad of chemotherapy, immune checkpoint inhibitors, and caloric restriction mimetics eradicates tumors in mice

Affiliations

A synergistic triad of chemotherapy, immune checkpoint inhibitors, and caloric restriction mimetics eradicates tumors in mice

Sarah Lévesque et al. Oncoimmunology. .

Abstract

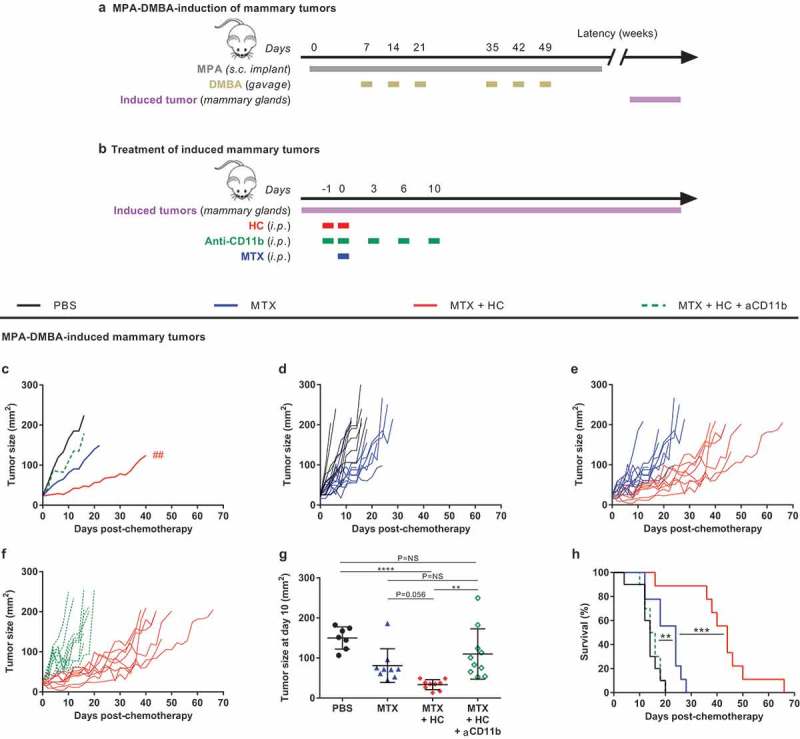
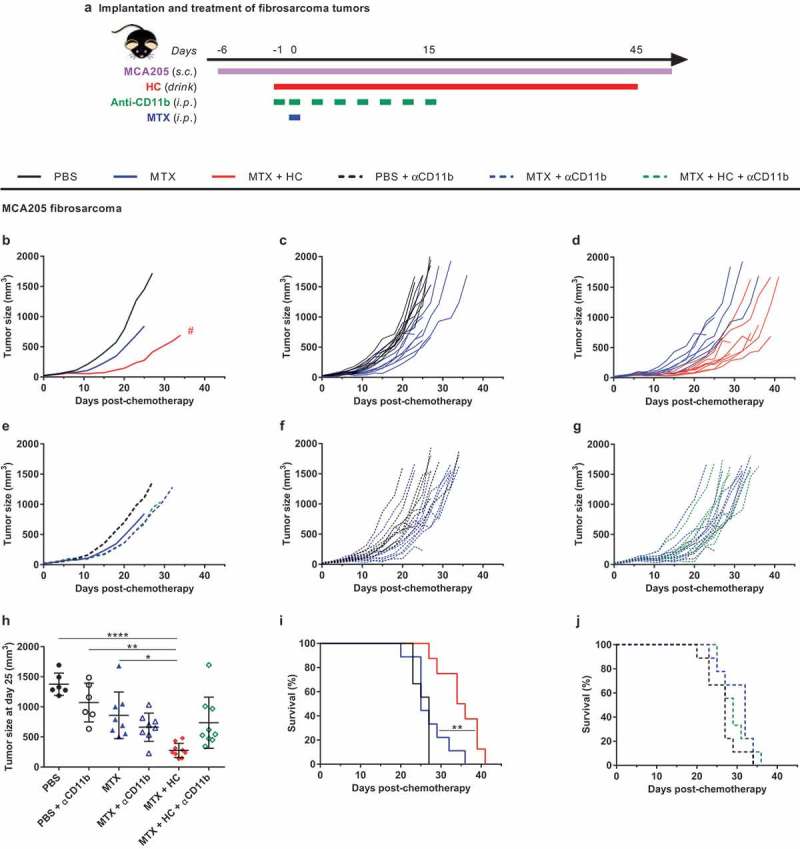
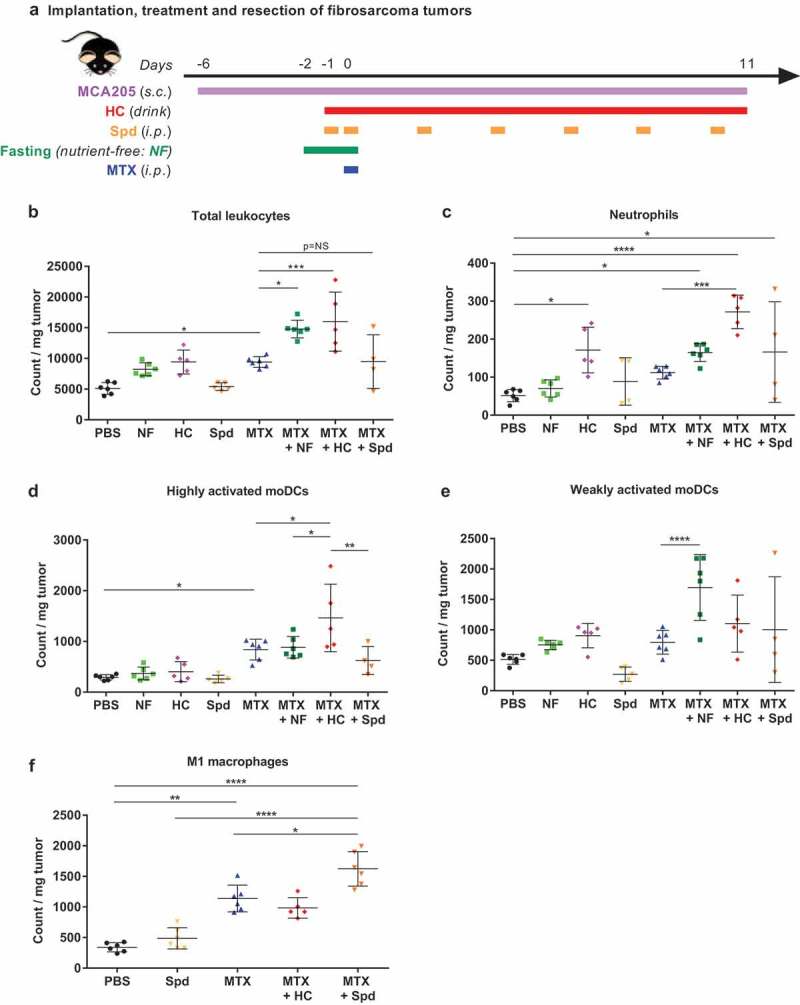
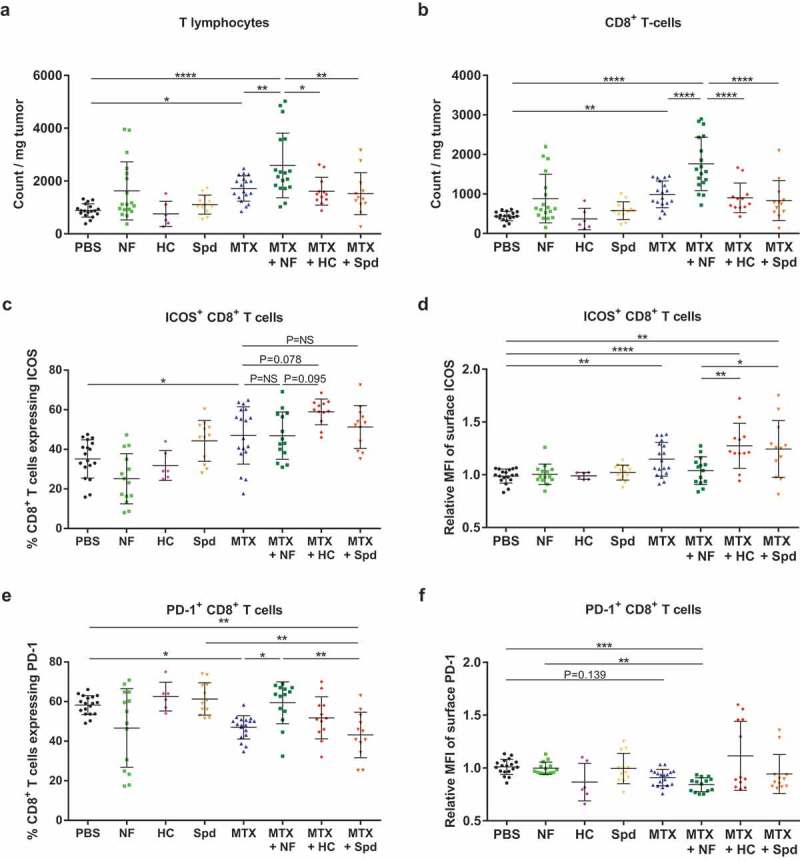
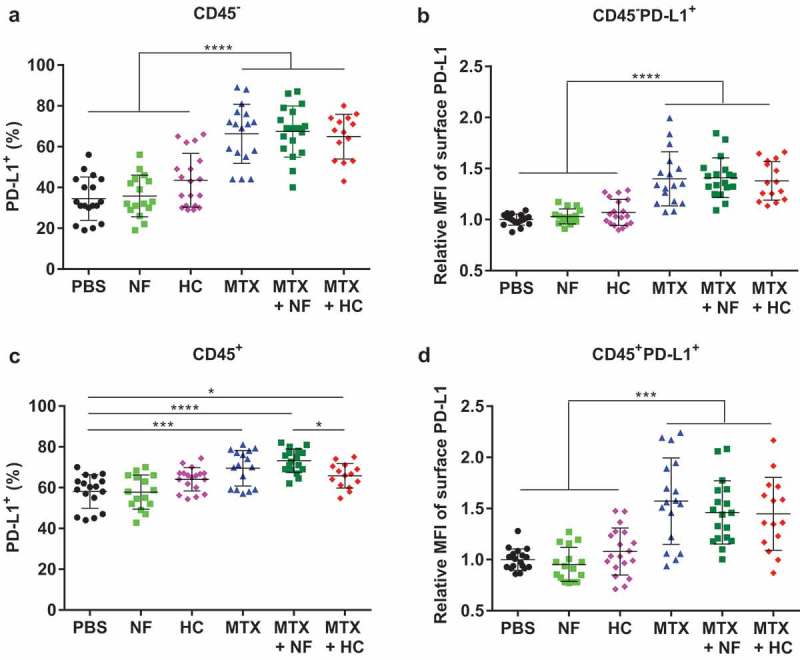
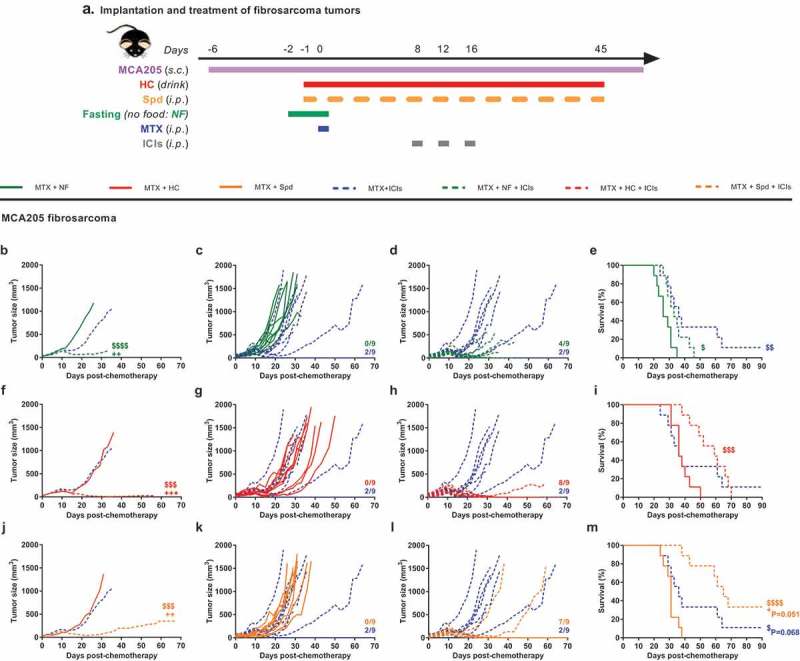
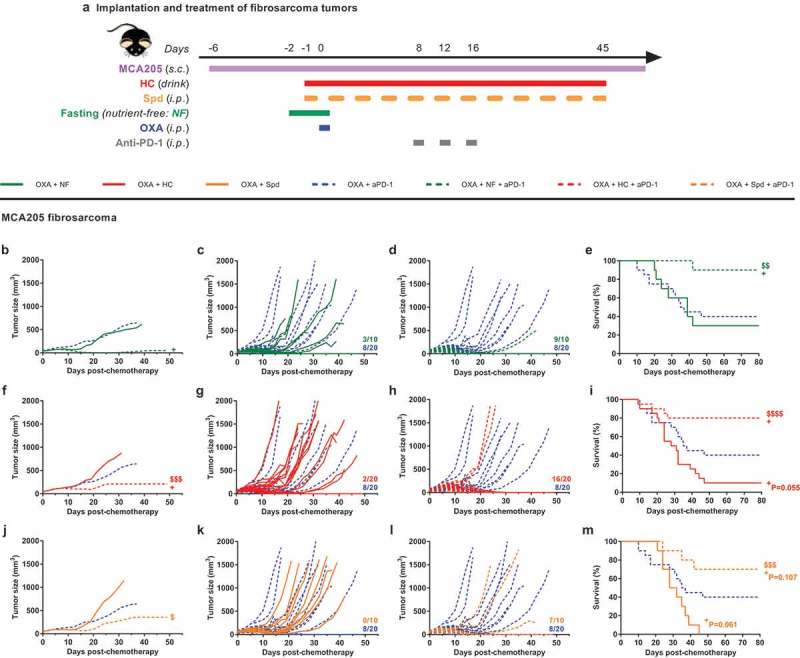
We have recently shown that chemotherapy with immunogenic cell death (ICD)-inducing agents can be advantageously combined with fasting regimens or caloric restriction mimetics (CRMs) to achieve superior tumor growth control via a T cell-dependent mechanism. Here, we show that the blockade of the CD11b-dependent extravasation of myeloid cells blocks such a combination effect as well. Based on the characterization of the myeloid and lymphoid immune infiltrates, including the expression pattern of immune checkpoint proteins (and noting a chemotherapy-induced overexpression of programmed death-ligand 1, PD-L1, on both cancer cells and leukocytes, as well as a reduced frequency of exhausted CD8+ T cells positive for programmed cell death 1 protein, PD-1), we then evaluated the possibility to combine ICD inducers, CRMs and targeting of the PD-1/PD-L1 interaction. While fasting or CRMs failed to improve tumor growth control by PD-1 blockade, ICD inducers alone achieved a partial sensitization to treatment with a PD-1-specific antibody. However, definitive cure of most of the tumor-bearing mice was only achieved by a tritherapy combining (i) ICD inducers exemplified by mitoxantrone and oxaliplatin, (ii) CRMs exemplified by hydroxycitrate and spermidine and substitutable for by fasting, and (iii) immune checkpoint inhibitors (ICIs) targeting the PD-1/PD-L1 interaction. Altogether, these results point to the possibility of synergistic interactions among distinct classes of anticancer agents.

Keywords: Caloric restriction mimetics; chemotherapy; combination therapies; immune checkpoint blockers; tumor immune infiltrate.


Figures

Figure 1.
Figure 1.
Myeloid cells contribute to the benefic action of the CRM HC to chemotherapy in a hormone- and carcinogen-induced mammary tumor model. (a) Experimental schedule of the MPA-DMBA-mediated induction of mammary tumors. Balb/c mice were implanted subcutaneously with a tablet continuously releasing the hormone MPA (day 0) followed by repeated oral gavages of the carcinogen DMBA (day 7, 14, 21, 35, 42 and 49). Breast cancer lesions become palpable a few weeks after the last gavage of DMBA. (b) Experimental schedule of the treatment of palpable mammary tumors. When the tumors reached ~25 mm2, mice were randomly assigned to the different treatment groups. Treatments consisted of the administration of (i) PBS (day 0; untreated control mice), (ii) chemotherapy alone (anthracycline MTX at day 0), (iii) chemotherapy + HC (delivered at day −1 and 0), (iv) chemotherapy + HC + anti-CD11b (CD11b-neutralizing antibodies injected at day −1, 0, 3, 6, 10). (c) Mean tumor growth curves of the treatment groups (n = 10/group). Curves were interrupted when more than 50% of the group had reached endpoint. (d–f) Individual tumor growth curves within each treatment group. (g) Dot plot illustrating the size of each individual tumor at day 10 post-chemotherapy. Mean ± SD is displayed. (h) Kaplan–Meier curves. Of note, some mice are shared with a previously reported data set (see Pietrocola F, Pol J et al. Cancer cell. 2016).27 ****p< .0001, ***p< .001, **p< .01 (comparisons with PBS or explicitly denoted by a segment); ##p< .01 (comparison between MTX + HC and MTX + HC + anti-CD11b); p= NS, not significant. For a detailed account of all comparisons, see Supplemental Table 1. CRM, caloric restriction mimetic; DMBA, 7,12-Dimethylbenz[a]anthracene; HC, hydroxycitrate; i.p., intraperitoneal; MPA, medroxyprogesterone acetate; MTX, mitoxantrone; PBS, phosphate-buffered saline; s.c., subcutaneous.
Figure 2.
Figure 2.
Myeloid cells are required for the benefic action of HC to chemotherapy in a fibrosarcoma tumor model. Experimental schedule of the implantation and treatment of syngeneic subcutaneous fibrosarcoma in C57Bl/6 mice (a) When tumors reached ~20 mm3, mice were randomly assigned to the different treatment groups. Treatments consisted of the administration of (i) PBS + isotype control antibody (untreated control mice), (ii) chemotherapy + isotype control antibody, (iii) chemotherapy + HC + isotype control antibody, (iv) PBS + anti-CD11b, (v) chemotherapy + anti-CD11b, (vi) chemotherapy + HC + anti-CD11b. The CRM HC was ingested through drinking water from day −1 to 45. Chemotherapy consisted of one injection of the anthracycline MTX at day 0 (or PBS in untreated controls). CD11b-neutralizing antibodies and isotype controls were injected at day −1, 0, 3, 6, 8, 10, 13 and 15. Mean (b) and individual (c,d) tumor growth curves of the treatment groups without CD11b neutralization. Mean (e) and individual (f,g) tumor growth curves of the treatment groups with CD11b neutralization. Of note, mean tumor growth curves in the panels B and E (n = 9/group) were interrupted when more than 50% of the group had reached endpoint. Dot plot (h) illustrating the size of each individual tumor at day 25 post-chemotherapy. Mean ± SD is displayed. Kaplan-Meier survival curves (i,j). ****p< .0001, **p< .01, *p< .05 (comparisons with PBS or explicitly denoted by a segment); #p< .05 (comparison between MTX + HC and MTX). For a detailed account of all comparisons, see Supplemental Table 2. CRM, caloric restriction mimetic; HC, hydroxycitrate; i.p., intraperitoneal; MTX, mitoxantrone; PBS, phosphate-buffered saline; s.c., subcutaneous.
Figure 3.
Figure 3.
CRMs modulate tumor-infiltrating myeloid cell subsets. (a) Experimental schedule of the implantation and treatment of syngeneic subcutaneous fibrosarcoma in C57Bl/6 mice. When tumors reached ~20 mm3, mice were randomly assigned to the different treatment groups. Monotherapy regimens consisted of: (i) PBS (untreated control mice), (ii) MTX-based chemotherapy, (iii) fasting (labeled NF for “nutrient-free”), (iv) HC or (v) Spd. Bitherapies consisted of: (i) MTX + NF, (ii) MTX + HC or (iii) MTX + Spd. Chemotherapy consisted of one i.p. injection of the anthracycline MTX at day 0 (or PBS in untreated controls). Fasting lasted for 48 h starting at day −2. The CRM HC was continuously delivered through the drinking water starting at day −1. The CRM Spd was injected i.p. at day −1, 0, and then every 2–3 days. Eleven days post-chemotherapy, tumors were resected, processed and myeloid cell subsets were immunostained before flow cytometry-assisted analysis. (b) Total population of leukocytes (CD45+). (c) Neutrophils (CD45+CD11b+Ly-6C+Ly-6Ghi). (d) Highly activated moDCs (CD45+Ly-6ChiLy-6GCD11b+CD11c+CD80+MHC-IIhi). (e) Weakly activated moDCs (CD45+Ly-6ChiLy-6GCD11b+CD11c+CD80+MHC-IIlo). (f) Classically activated macrophages (M1; CD45+F4/80+CD11b+CD11cCD38+). Dot plots illustrate the count of immune cells normalized per mg of tumor. Mean ± SD is displayed. ****p< .0001, ***p< .001, **p< .01, *p< .05; p= NS, not significant. For a detailed account of all comparisons, see Supplemental Table 3. CRM, caloric restriction mimetic; HC, hydroxycitrate; i.p., intraperitoneal; moDCs, monocyte-derived dendritic cells; MTX, mitoxantrone; NF, nutrient-free; PBS, phosphate-buffered saline; s.c., subcutaneous; Spd, spermidine.
Figure 4.
Figure 4.
CRMs modulate tumor-infiltrating lymphoid cell subsets. Following the experimental schedule illustrated in Figure 3(a), T cell populations infiltrating the tumor microenvironment were analyzed by flow cytometry. (a) Total population of T lymphocytes (CD3+). (b) Total population of CD8+ T cells. (c) Percentage of CD8+ T cells expressing the early activation marker ICOS. (d) Level of expression of ICOS at the surface of CD8+ T cells (relative MFI). (e) Percentage of CD8+ T cells expressing the late activation/exhaustion molecule PD-1. (f) Level of expression of PD-1 at the surface of CD8+ T cells (relative MFI). Dot plots illustrate mean ± SD. ****p< .0001, ***p< .001; **p< .01, *p< .05; p= NS, not significant. For a detailed account of all comparisons, see Supplemental Table 4. HC, hydroxycitrate; ICOS, inducible T-cell costimulator; MFI, mean fluorescence intensity; MTX, mitoxantrone; NF, nutrient-free; PBS, phosphate-buffered saline; PD-1, programmed cell death protein 1; Spd, spermidine.
Figure 5.
Figure 5.
MTX-based chemotherapy impacts PD-L1 expression on both malignant cells and tumor-infiltrating immune cells, independently of CRMs. Following the experimental schedule illustrated in Figure 3(a), cell populations constituting the tumor microenvironment were analyzed by flow cytometry. Percentage of CD45 cells, mostly tumor cells, which express PD-L1 (a) and its surface expression level illustrated as relative MFI (b) Percentage of leukocytes (CD45+) cells expressing PD-L1 (c) and its surface expression level illustrated as relative MFI (d) Dot plots display mean ± SD. ****p< .0001, ***p< .001, *p< .05. For a detailed account of all comparisons, see Supplemental Table 5. HC, hydroxycitrate; MFI, mean fluorescence intensity; MTX, mitoxantrone; NF, nutrient-free; PBS, phosphate-buffered saline; PD-L1, programmed death-ligand 1.
Figure 6.
Figure 6.
CRMs improve combinatorial treatment with MTX-based chemotherapy + ICIs. Experimental schedule of the implantation and treatment of syngeneic subcutaneous fibrosarcoma in C57Bl/6 mice (a) When tumors reached ~20 mm3, mice were randomly assigned to the different treatment groups. Monotherapy regimens consisted of: (i) PBS (untreated control mice) or (ii) MTX-based chemotherapy. Bitherapies consisted of: (iii) MTX + NF, (iv) MTX + HC, (v) MTX + Spd, and (vi) MTX + ICIs (cocktail of anti-PD-1 + anti-CTLA-4). Additionally, ICIs were evaluated in tritherapy regimens consisting of: (i) MTX + NF + ICIs, (ii) MTX + HC + ICIs, (iii) MTX + Spd + ICIs. Chemotherapy consisted of one i.p. injection of the anthracycline MTX at day 0 (or PBS in untreated controls). Fasting lasted for 48 h starting at day −2. The CRM HC was continuously delivered through the drinking water starting at day −1. The CRM Spd was injected i.p. at day −1, 0, and then every 2–3 days. ICIs were administered i.p. at day 8, 12, and 16. Mean (b, f, j) and individual (c, d, g, h, k, l) tumor growth curves of mice treated with bi- and tri-therapies. Of note, mean tumor growth curves (n = 9/group) were interrupted when more than 50% of the group had reached endpoint. On the panels displaying individual tumor growth curves, the number of animals that underwent complete tumor regression is indicated on the right end side. Kaplan–Meier curves (e, i, m). +++p < .001, ++p < .01 (comparisons to MTX + ICIs); $$$$p < .0001, $$$p < .001, $$p < .01, $p < .05 (comparisons to MTX + CRMs/NF). For a detailed account of all comparisons, see Supplemental Table 6. CRMs, caloric restriction mimetics; CTLA-4, cytotoxic T lymphocyte–associated protein 4; HC, hydroxycitrate; ICIs, immune checkpoint inhibitors; i.p., intraperitoneal; MTX, mitoxantrone; NF, nutrient-free; PBS, phosphate-buffered saline; PD-1, programmed cell death 1; s.c., subcutaneous; Spd, spermidine.
Figure 7.
Figure 7.
CRMs improve OXA + anti-PD-1 bitherapy. Experimental schedule of the implantation and treatment of syngeneic subcutaneous fibrosarcoma in C57Bl/6 mice (a). When tumors reached ~20 mm3, mice were randomly assigned to the different treatment groups. Monotherapy regimens consisted of: (i) PBS (untreated control mice) or (ii) OXA-based chemotherapy. Bitherapies consisted of: (i) OXA + NF, (ii) OXA + HC, (iii) OXA + Spd, and (iv) OXA + anti-PD-1. Anti-PD-1 was also evaluated in a tritherapy regimen consisting of: (i) OXA + NF + anti-PD-1, (ii) OXA + HC + anti-PD-1, (iii) OXA + Spd + anti-PD-1. Chemotherapy consisted of one i.p. injection of the platinum salt OXA at day 0 (or PBS in untreated controls). Fasting lasted for 48 h starting at day −2. The CRM HC was continuously delivered through the drinking water starting at day −1. The CRM Spd was injected i.p. at day −1, 0, and then every 2–3 days. Anti-PD-1 neutralizing antibodies were administered i.p. at day 8, 12, and 16. Mean (b, f, j) and individual (c, d, g, h, k, l) tumor growth curves of mice treated with bi- and tri-therapies. Of note, mean tumor growth curves (n = 10–20/group) were interrupted when more than 50% of the group had reached endpoint. On the panels displaying individual tumor growth curves, the number of animals that underwent complete tumor regression is indicated on the right end side. Kaplan–Meier curves (e, i, m). +p< .05 (comparisons to OXA + anti-PD-1); $$$p< .0001, $$$p< .001, $$p< .01, $p < .05 (comparisons to OXA + CRMs/NF). Data of the groups PBS, OXA + HC, OXA + anti-PD-1 and OXA + HC + anti-PD-1 consist of a pool of two independent experiments. For a detailed account of all comparisons, see Supplemental Table 7. CRM, caloric restriction mimetic; HC, hydroxycitrate; i.p., intraperitoneal; NF, nutrient-free; OXA, oxaliplatin; PBS, phosphate-buffered saline; PD-1, programmed cell death protein 1; s.c., subcutaneous; Spd, spermidine.

References

    1. Wallis CJD, Butaney M, Satkunasivam R, Freedland SJ, Patel SP, Hamid O, Pal SK, Klaassen Z.. Association of patient sex with efficacy of immune checkpoint inhibitors and overall survival in advanced cancers: a systematic review and meta-analysis. JAMA Oncol. 2019. doi:10.1001/jamaoncol.2018.5904. - DOI - PMC - PubMed
    1. Wei SC, Duffy CR, Allison JP.. Fundamental mechanisms of immune checkpoint blockade therapy. Cancer Discov. 2018;8:1–15. doi:10.1158/2159-8290.CD-18-0367. - DOI - PubMed
    1. Hellmann MD, Ciuleanu TE, Pluzanski A, Lee JS, Otterson GA, Audigier-Valette C, Minenza E, Linardou H, Burgers S, Salman P, et al. Nivolumab plus ipilimumab in lung cancer with a high tumor mutational burden. N Engl J Med. 2018;378:2093–2104. doi:10.1056/NEJMoa1801946. - DOI - PMC - PubMed
    1. Hellmann MD, Callahan MK, Awad MM, Calvo E, Ascierto PA, Atmaca A, Rizvi NA, Hirsch FR, Selvaggi G, Szustakowski JD, et al. Tumor mutational burden and efficacy of nivolumab monotherapy and in combination with ipilimumab in small-cell lung cancer. Cancer Cell. 2018;33:853–861.e4. doi:10.1016/j.ccell.2018.04.001. - DOI - PMC - PubMed
    1. Eggermont AMM, Blank CU, Mandala M, Long GV, Atkinson V, Dalle S, Haydon A, Lichinitser M, Khattak A, Carlino MS, et al. Adjuvant pembrolizumab versus placebo in resected stage III melanoma. N Engl J Med. 2018;378:1789–1801. doi:10.1056/NEJMoa1802357. - DOI - PubMed

Publication types