. 2020 Jan;61(1):19-28.
doi: 10.1111/epi.16356. Epub 2019 Oct 24.

Realistic driving simulation during generalized epileptiform discharges to identify electroencephalographic features related to motor vehicle safety: Feasibility and pilot study

Affiliations

Realistic driving simulation during generalized epileptiform discharges to identify electroencephalographic features related to motor vehicle safety: Feasibility and pilot study

Eli Cohen et al. Epilepsia. 2020 Jan.

Abstract

Objective: Generalized epileptiform discharges (GEDs) can occur during seizures or without obvious clinical accompaniment. Motor vehicle driving risk during apparently subclinical GEDs is uncertain. Our goals were to develop a feasible, realistic test to evaluate driving safety during GEDs, and to begin evaluating electroencephalographic (EEG) features in relation to driving safety.

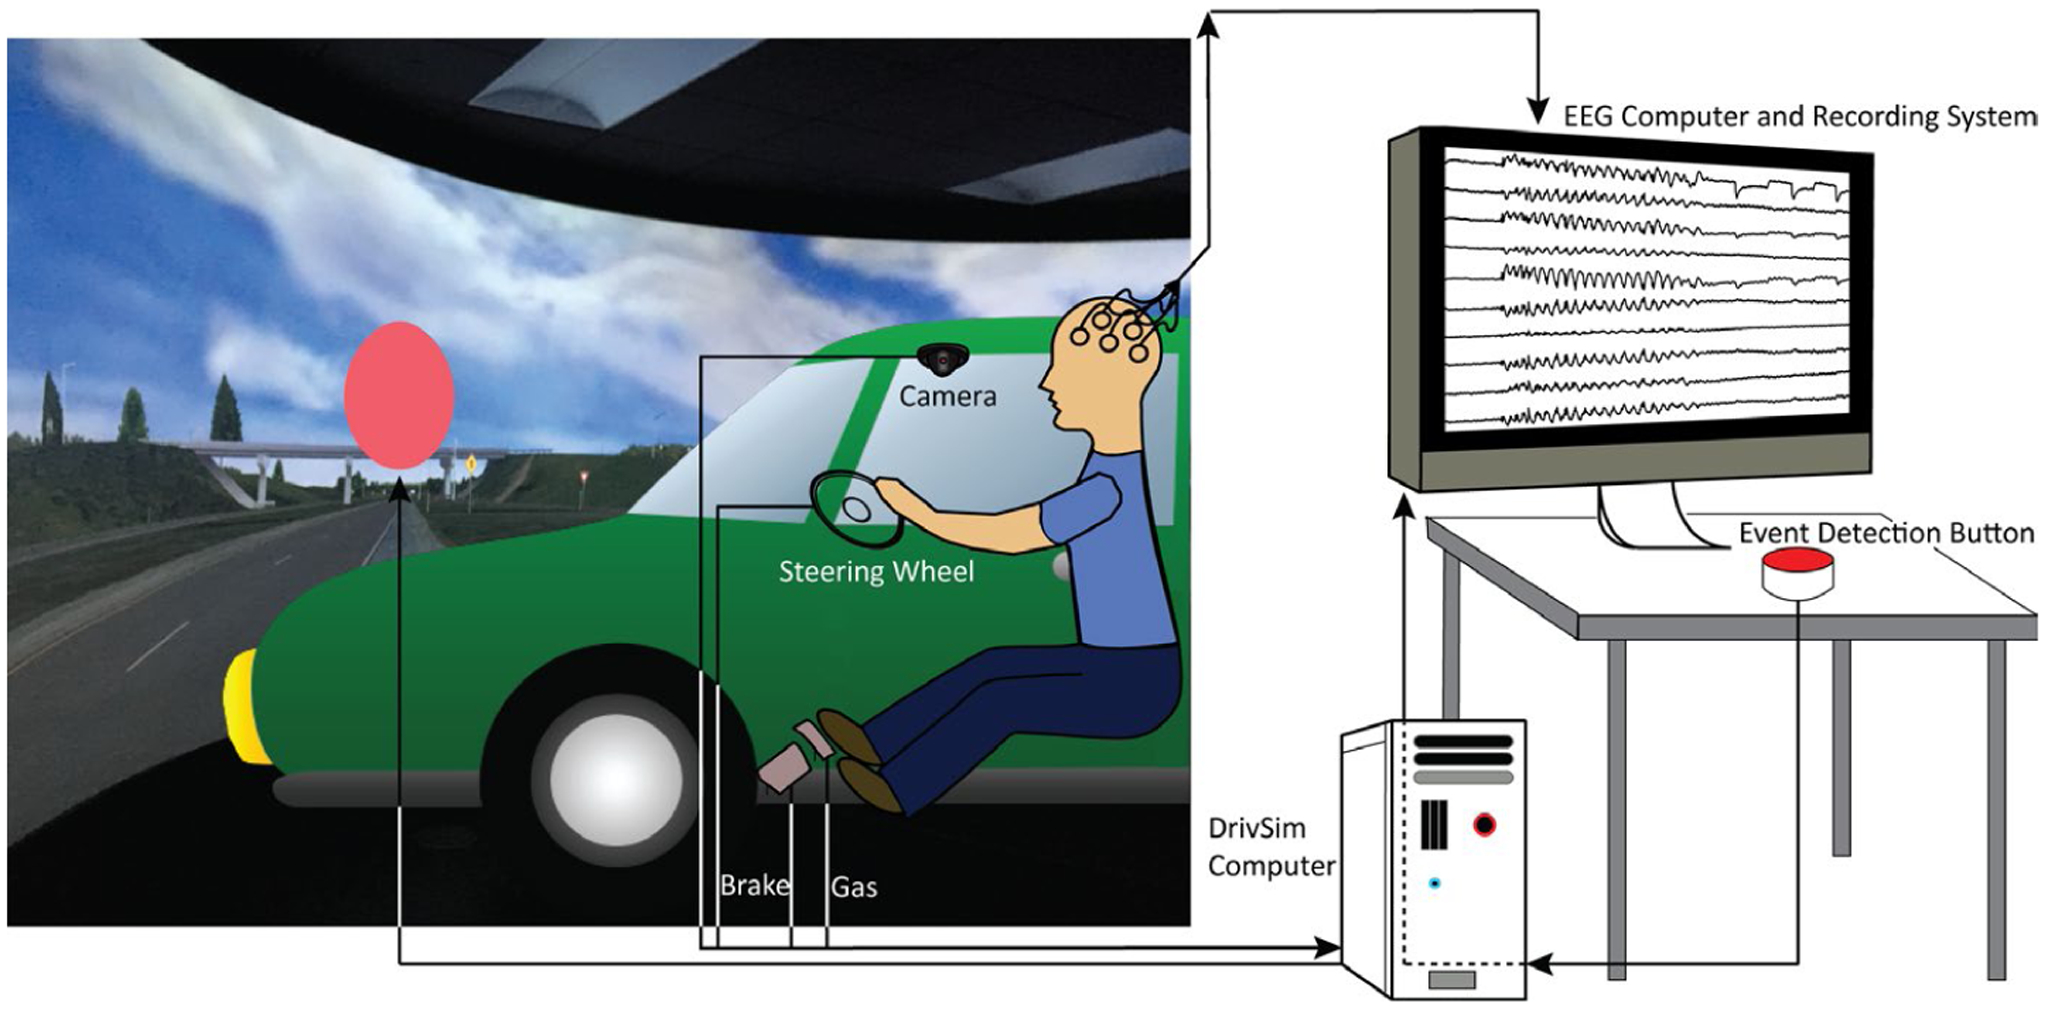
Methods: Subjects were aged ≥15 years with generalized epilepsy, GEDs on EEG, and no clinical seizures. Using a high-fidelity driving simulator (miniSim) with simultaneous EEG, a red oval visual stimulus was presented every 5 minutes for baseline testing, and with each GED. Participants were instructed to pull over as quickly and safely as possible with each stimulus. We analyzed driving and EEG signals during GEDs.

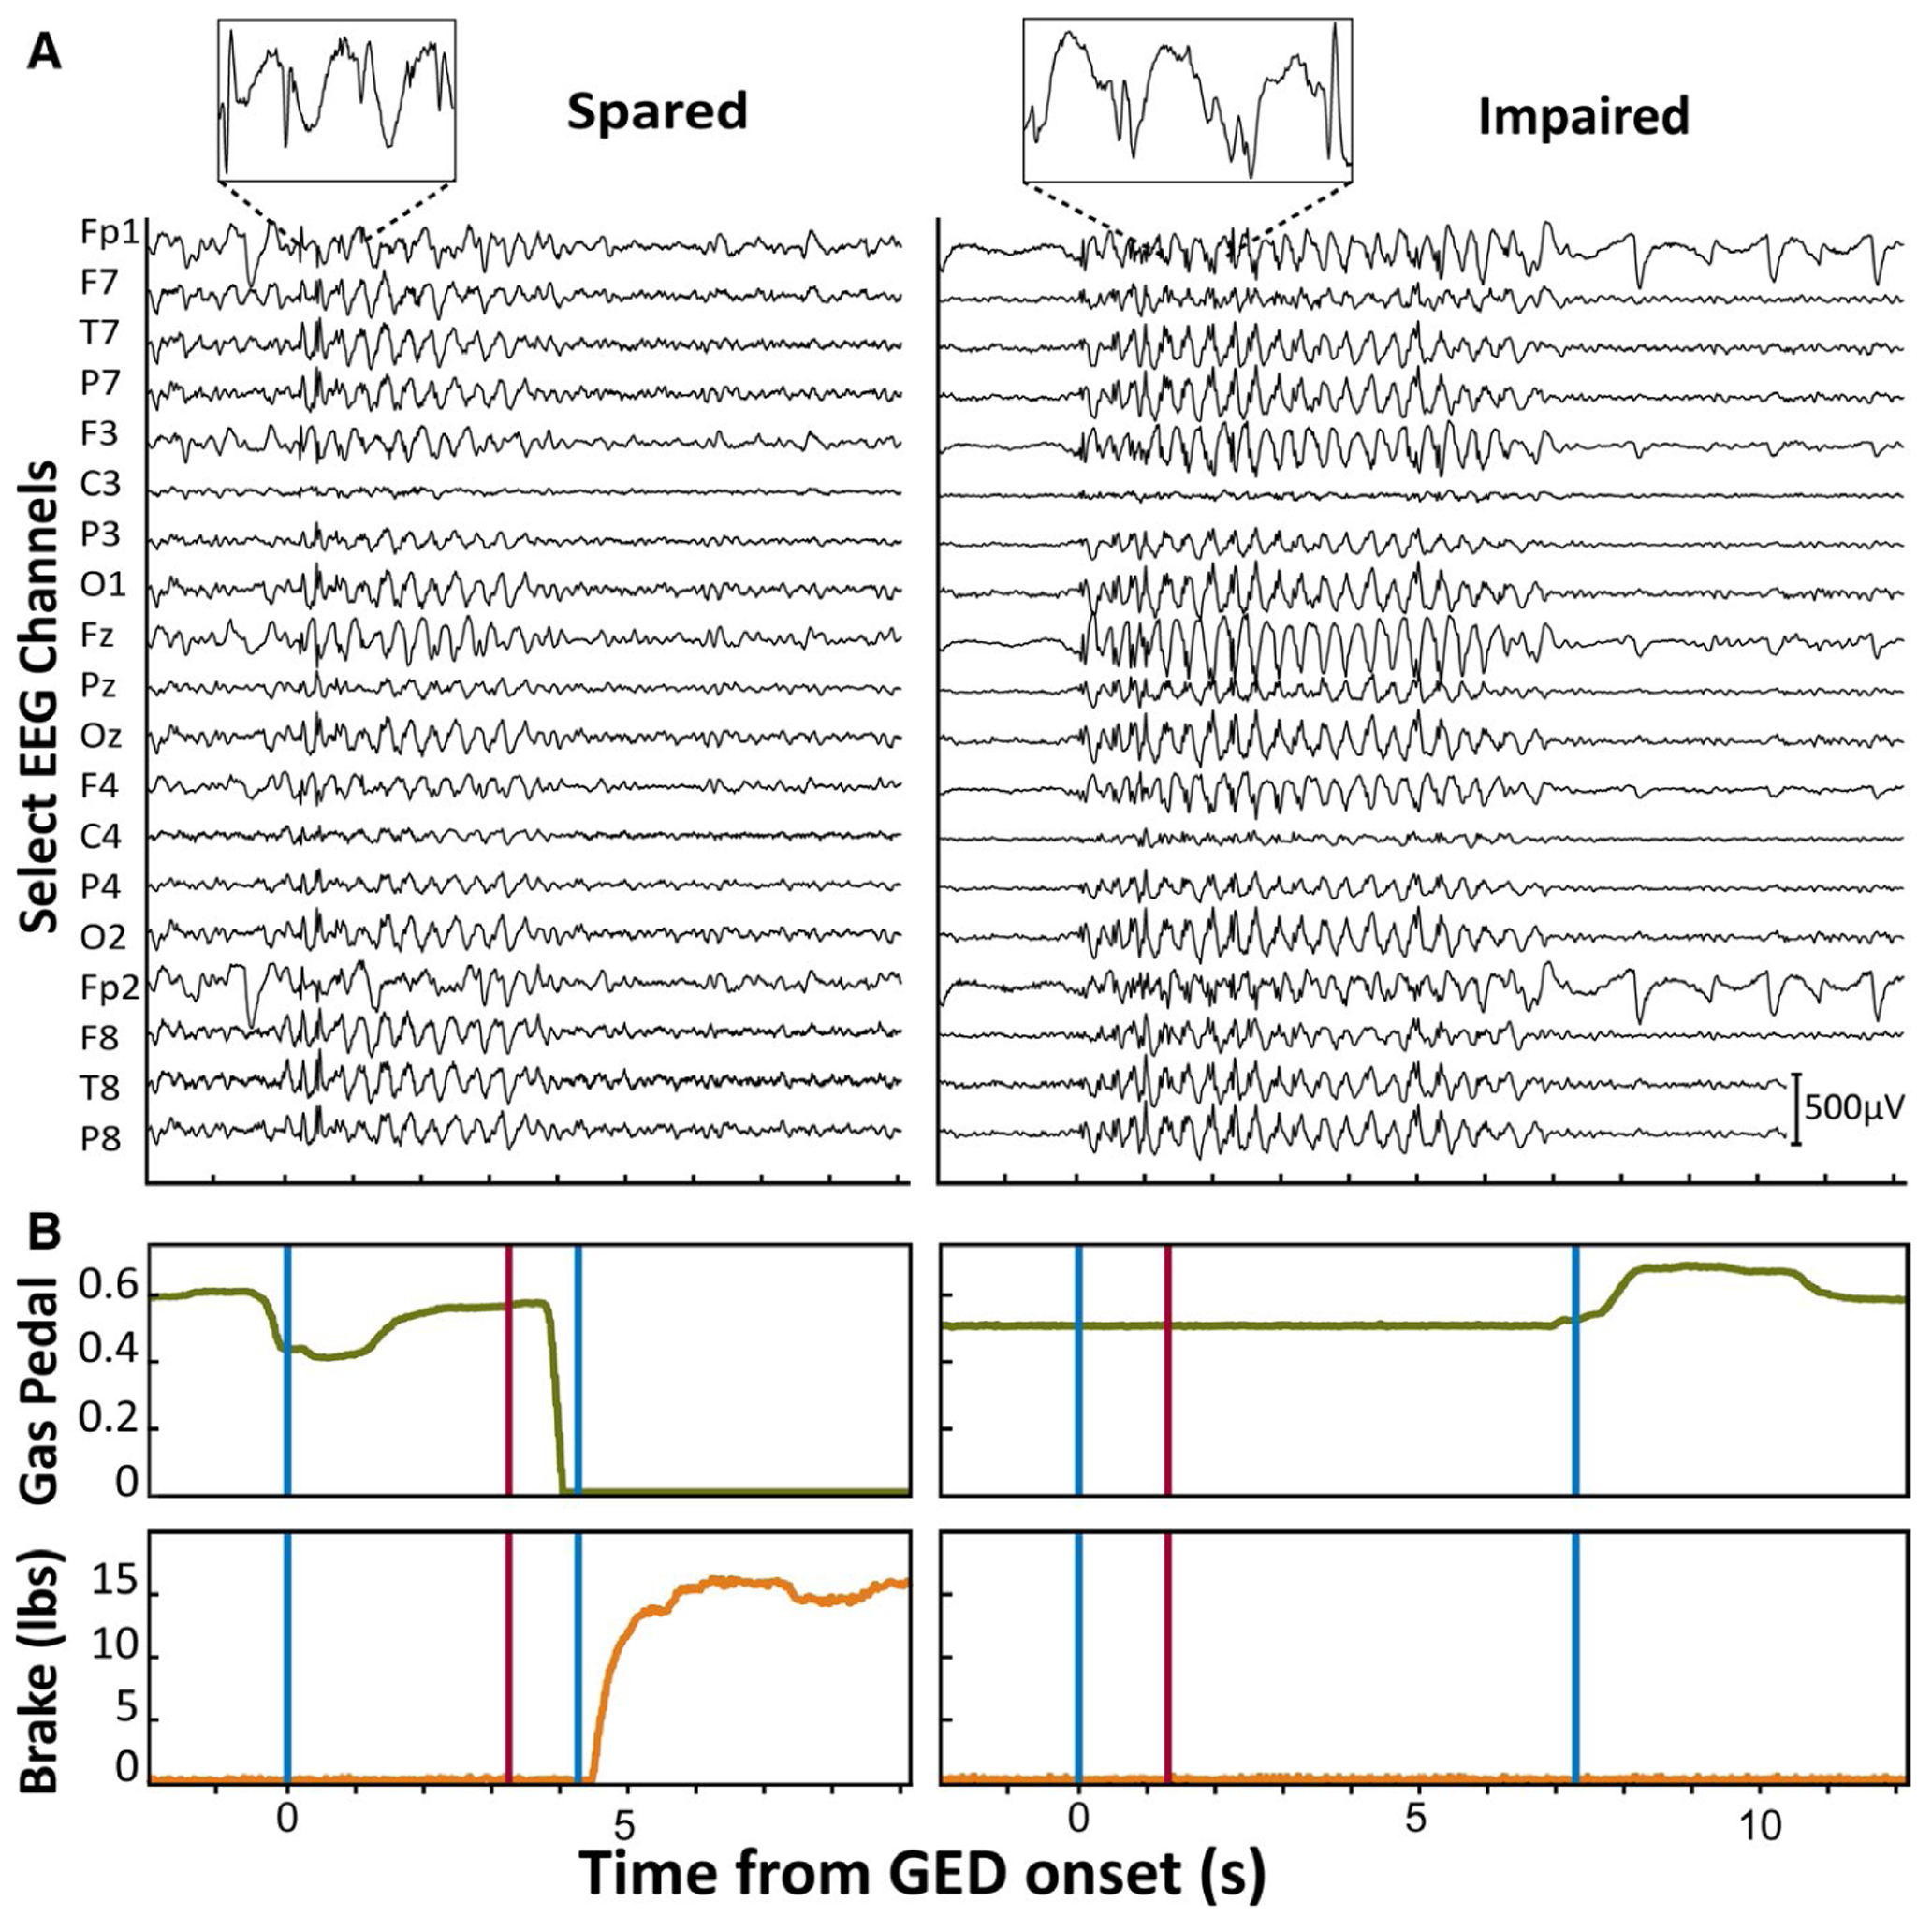
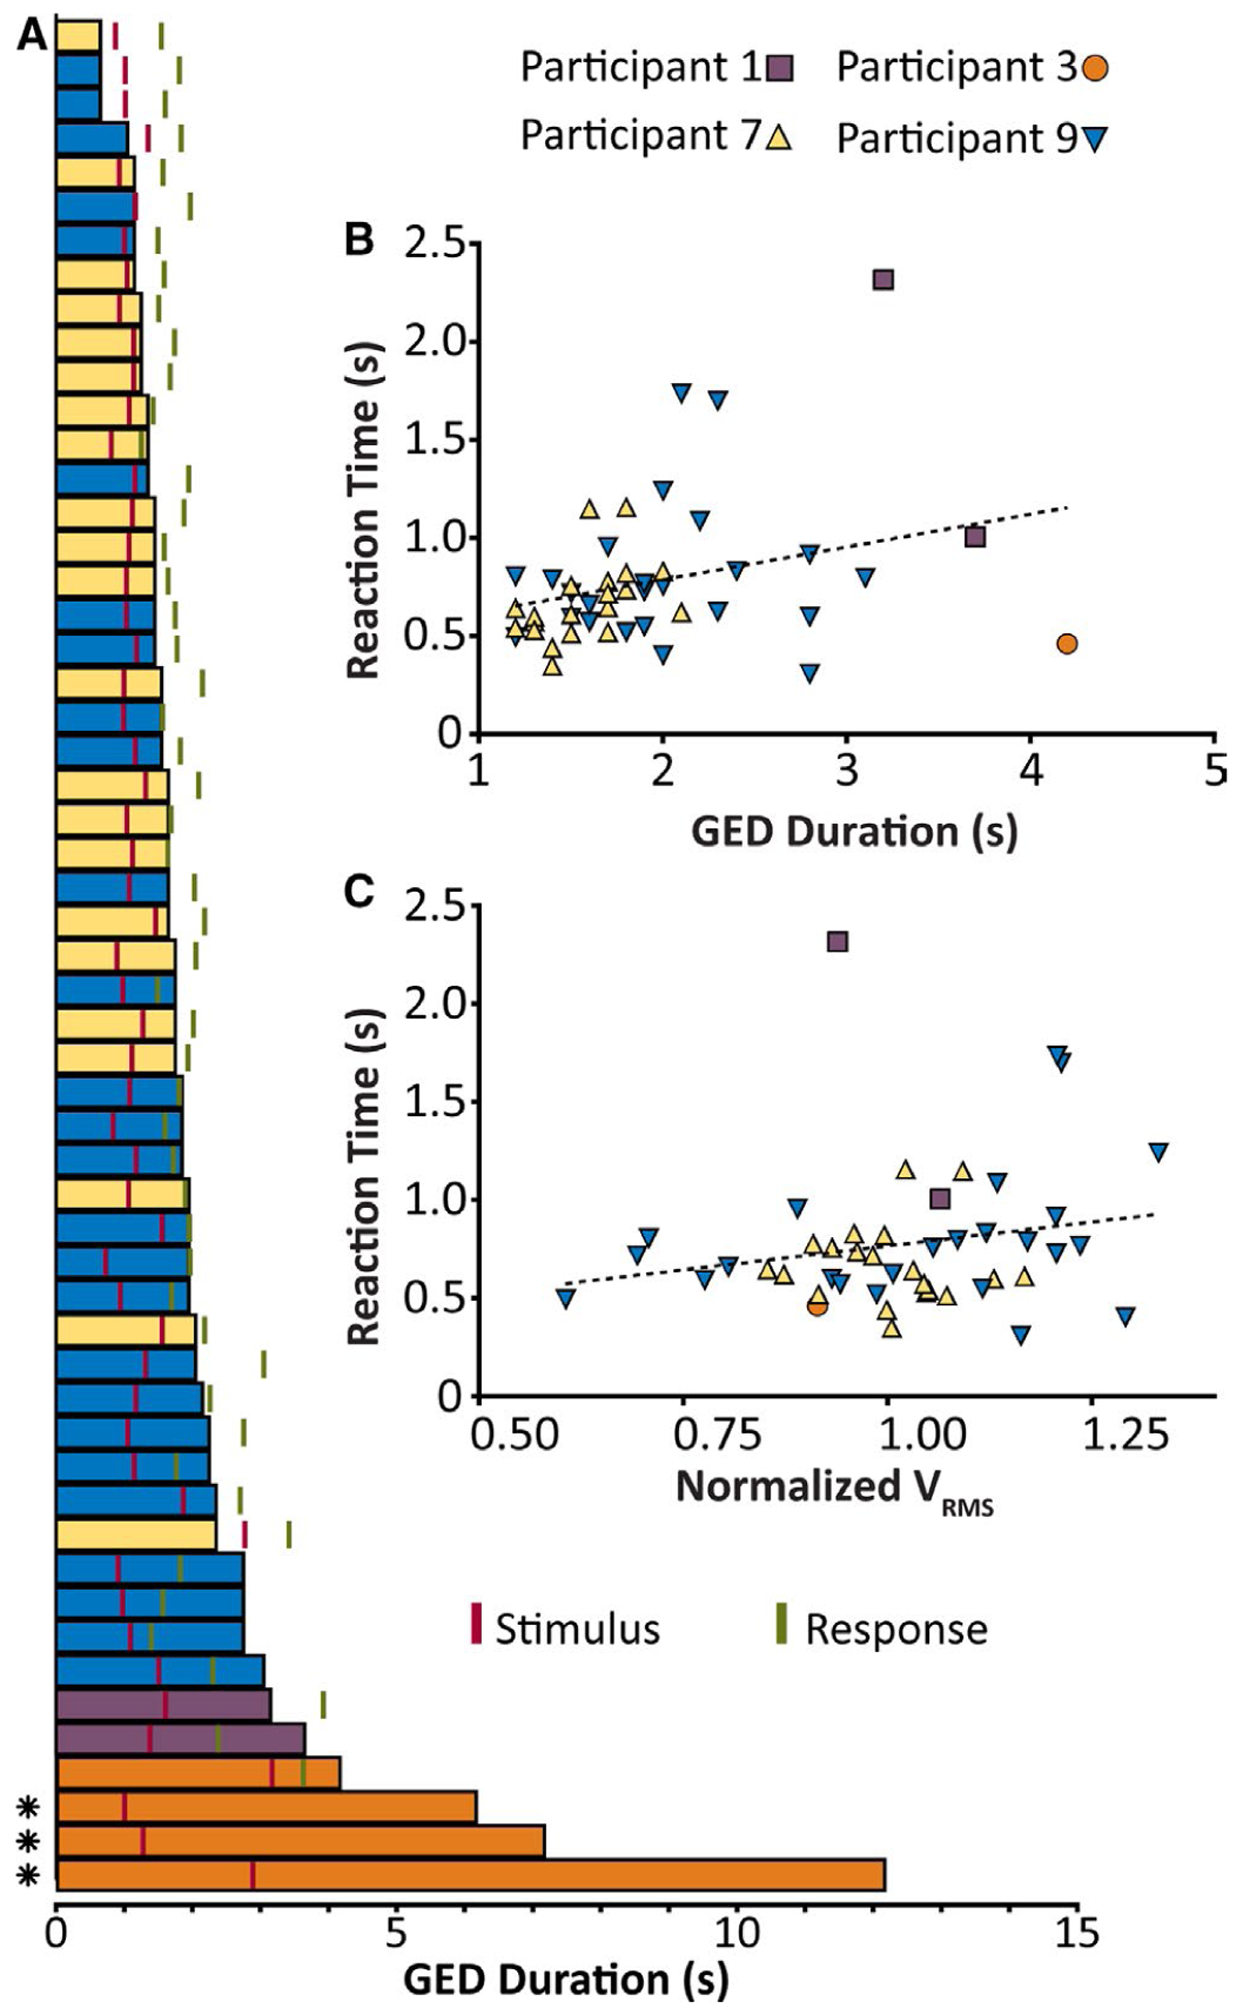
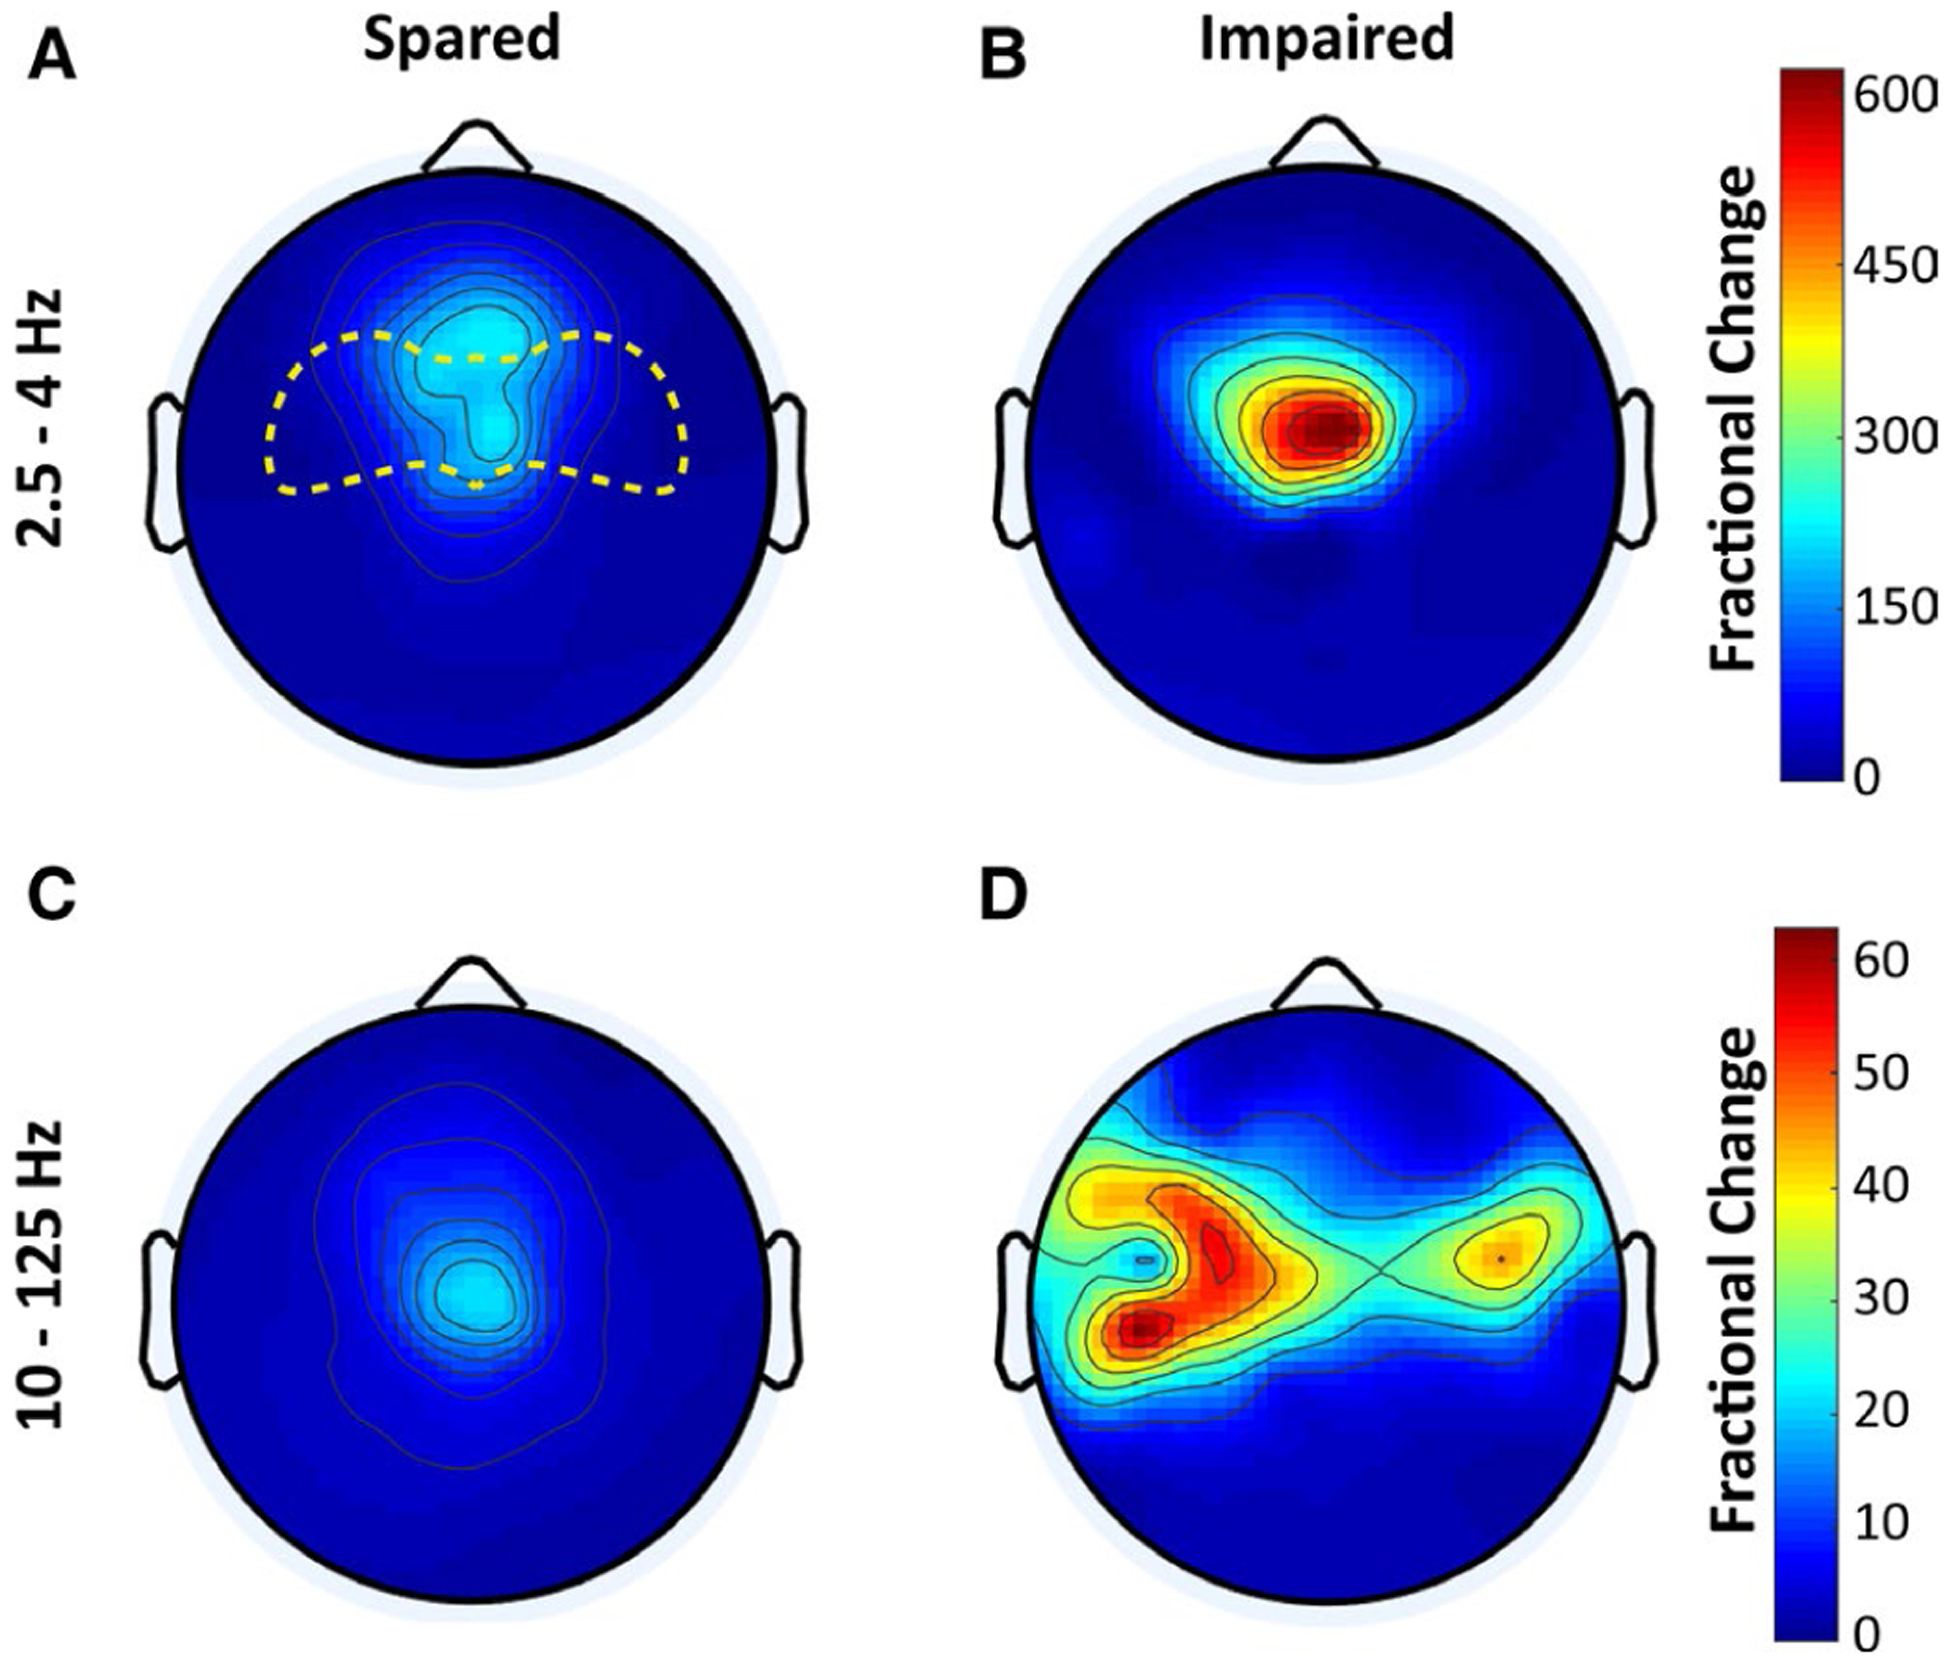
Results: Nine subjects were tested, and five experienced 88 GEDs total with mean duration 2.31 ± 1.89 (SD) seconds. Of these five subjects, three responded appropriately to all stimuli, one failed to respond to 75% of stimuli, and one stopped driving immediately during GEDs. GEDs with no response to stimuli were significantly longer than those with appropriate responses (8.47 ± 3.10 vs 1.85 ± 0.69 seconds, P < .001). Reaction times to stimuli during GEDs were significantly correlated with GED duration (r = 0.30, P = .04). In addition, EEG amplitude was greater for GEDs with no response to stimuli than GEDs with responses, both for overall root mean square voltage amplitude (66.14 μV vs 52.99 μV, P = .02) and for fractional power changes in the frequency range of waves (P < .05) and spikes (P < .001).

Significance: High-fidelity driving simulation is feasible for investigating driving behavior during GEDs. GEDs with longer duration and greater EEG amplitude showed more driving impairment. Future work with a large sample size may ultimately enable classification of GED EEG features to predict individual driving risk.

Keywords: EEG; absence seizures; consciousness; driving; epilepsy; spike-wave discharges.


Conflict of interest statement

CONFLICT OF INTEREST

None of the authors has any conflict of interest to disclose. We confirm that we have read the Journal’s position on issues involved in ethical publication and affirm that this report is consistent with those guidelines.

Figures

FIGURE 1
FIGURE 1
Driving paradigm including electroencephalogram (EEG), video, and behavioral data acquisition. Main components and configuration of the miniSim driving simulator at the DrivSim laboratory are shown. Detection of epileptiform discharge prompts an experienced EEG reviewer to press the Event Detection Button. A red oval stimulus is sent to the screen, and the stimulus time is recorded by the DrivSim computer as well as time-marked as an event on EEG recording. Subject responses including steering wheel, gas, and brake pedal are recorded on the DrivSim computer and analyzed offline. Behavior is also recorded by video cameras in the DrivSim car
FIGURE 2
FIGURE 2
Examples of generalized epileptiform discharge (GEDs) with spared and impaired responses to stimuli while driving. A, Electroencephalographic (EEG) recordings for GEDs associated with spared and impaired response to red oval stimulus. Insets provide an expanded view of the 3-Hz spike-wave morphology of EEG. Selected EEG channels (of 128 recorded) along the vertical axis comprise the viewing montage used during real-time visual detection of GEDs, as well as subsequent offline review. Cz was used as reference. Scale bar is 500 μV. B, Gas pedal position (green traces) and brake pedal force (orange traces) on same time scale as corresponding GED with spared versus impaired responses to stimulus presentation (red vertical lines). GED onset and offset are indicated by vertical blue lines. In the GED with spared response to the stimulus (left traces), there is a prompt decrease in depression of the gas pedal (downward deflection of green trace) followed by increased brake force (upward deflection of orange trace). In contrast, in the GED with impaired response to the stimulus (right traces), there are no appropriate changes in gas pedal or brakes after the stimulus. Gas pedal units are the ratio of downward displacement distance divided by maximal pedal downward displacement. Brake pedal units are in pounds. All example traces shown here (A and B) are from Patient 3 (Table 1)
FIGURE 3
FIGURE 3
Responses to stimuli in relation to generalized epileptiform discharges (GEDs) while driving. A, GED durations for the four patients with behavioral data during GEDs. Stimuli (marked in red) and time of response (marked in green) are given relative to the onset of GEDs. All GEDs are aligned by onset time and are arranged in ascending order of duration. GED bars are colored by participant (see key). *GED with no response to the stimulus. B, Relationship between GED duration and the reaction time. The dotted line gives best fit by linear least squares regression. Pearson correlation coefficient r = .30, P = .04. C, Relationship between root mean square voltage (VRMS; normalized to mean within participant) for each GED and reaction time. The dotted line gives best fit by least squares regression. Pearson correlation coefficient r = .20, P = .17. For A, all GEDs with behavioral testing from Patients 1, 3, 7, and 9 are shown (Patient 4 lacked behavioral testing; see text). For B and C, only GEDs where the stimulus was presented during the episode (not afterward, see A for examples of this) and where a response occurred either during or after the episode are included
FIGURE 4
FIGURE 4
Greater electroencephalographic (EEG) spike amplitude in generalized epileptiform discharge (GED) with impaired responses. A, B, Head maps of 128-channel high-density EEG fractional power change in the 2.5- to 4-Hz frequency range (wave components of spike-wave discharges) for GEDs with spared (A) or impaired (B) response (no response) to stimuli. C, D, Maps of EEG fractional power change in the 10- to 125-Hz frequency range (spike components of spike-wave discharges) for GEDs with spared (C) and impaired (D) responses. Color scale bars represent EEG power during seizures divided by baseline power (fractional power). The top color bar is for A and B, and bottom bar is for C and D. The anterior head region in which fractional power change was compared statistically is outlined in yellow in A. EEG data are from the same patients and GED episodes as in Figure 3A

References

    1. Scheffer IE, Berkovic S, Capovilla G, et al. ILAE classification of the epilepsies: position paper of the ILAE Commission for Classification and Terminology. Epilepsia. 2017;58:512–21. - PMC - PubMed
    1. Gil-Nagel A, Abou-Khalil B. Electroencephalography and video-electroencephalography. Handb Clin Neurol. 2012;107:323–45. - PubMed
    1. Berman R, Negishi M, Vestal M, et al. Simultaneous EEG, fMRI, and behavioral testing in typical childhood absence seizures. Epilepsia. 2010;51(10):2011–22. - PMC - PubMed
    1. Blumenfeld H. Cellular and network mechanisms of spike-wave seizures. Epilepsia. 2005;46:21–33. - PubMed
    1. Avoli M, Biagini G. Thalamocortical synchronization and absence epilepsy In: Schwartzkroin P, editor. Encyclopedia of Basic Epilepsy Research. Cambridge, MA: Academic Press, 2009; p. 28–36.

Publication types