. 2019 Oct 23;19(1):994.
doi: 10.1186/s12885-019-6179-y.

BC200 overexpression contributes to luminal and triple negative breast cancer pathogenesis

Affiliations

BC200 overexpression contributes to luminal and triple negative breast cancer pathogenesis

Maria Barton et al. BMC Cancer. .

Abstract

Background: Long non coding RNAs (lncRNAs) are RNA molecules longer than 200 nucleotides that are not translated into proteins, but regulate the transcription of genes involved in different cellular processes, including cancer. Epidemiological analyses have demonstrated that parous women have a decreased risk of developing breast cancer in postmenopausal years if they went through a full term pregnancy in their early twenties. We here provide evidence of the role of BC200 in breast cancer and, potentially, in pregnancy's preventive effect in reducing the lifetime risk of developing breast cancer.

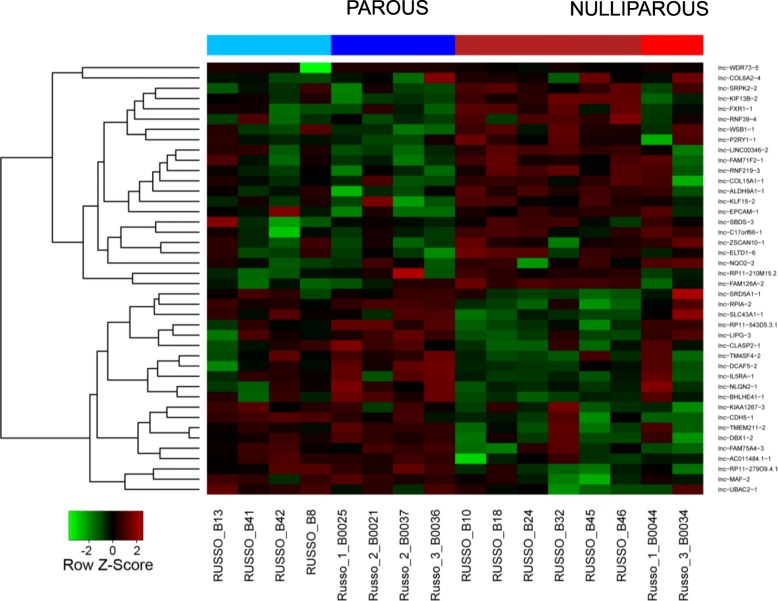
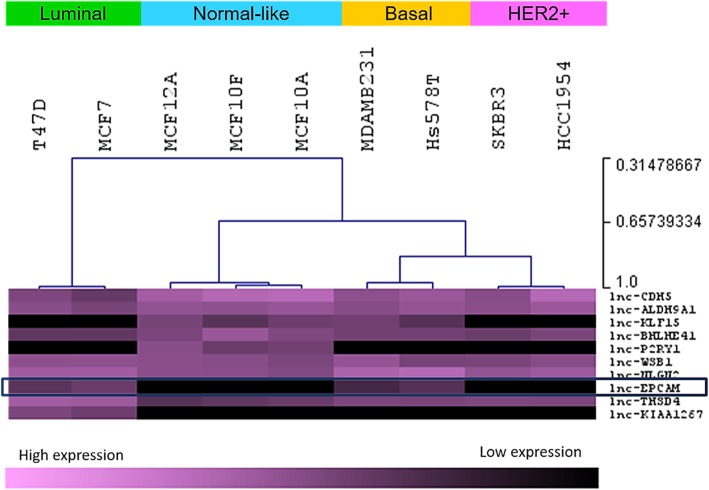
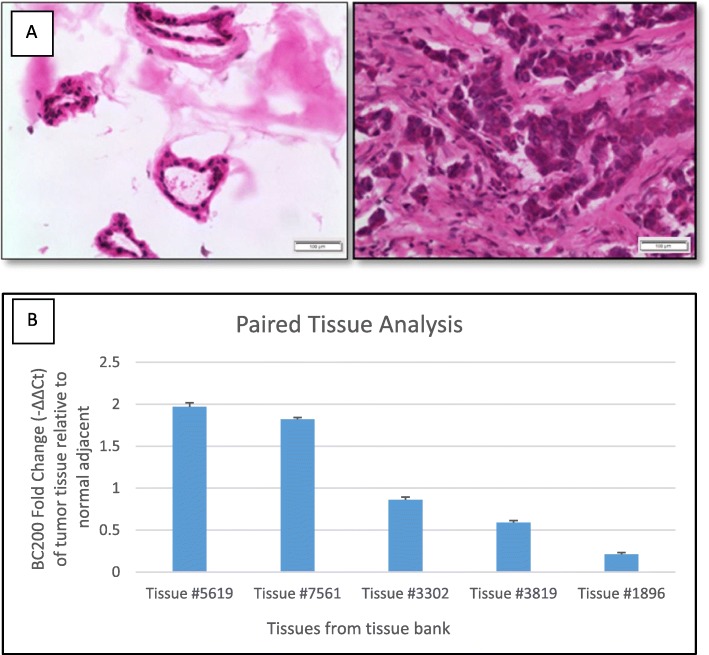
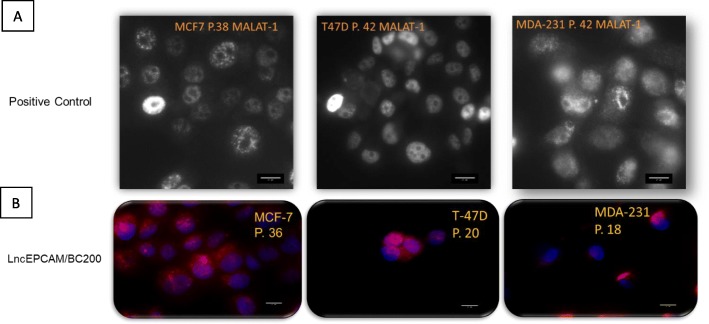
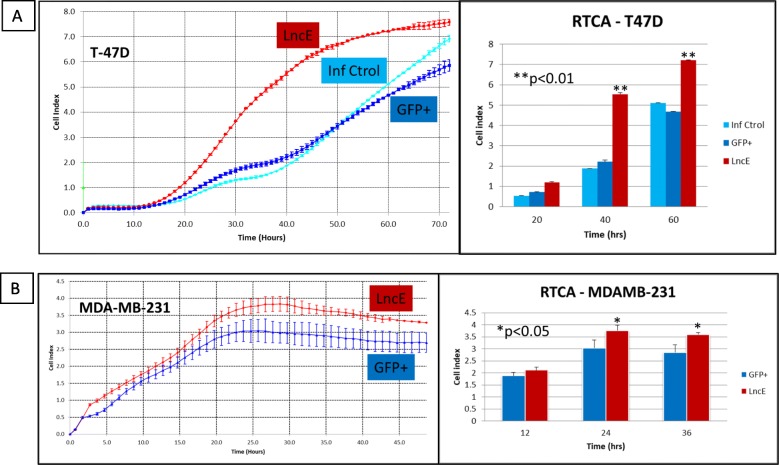
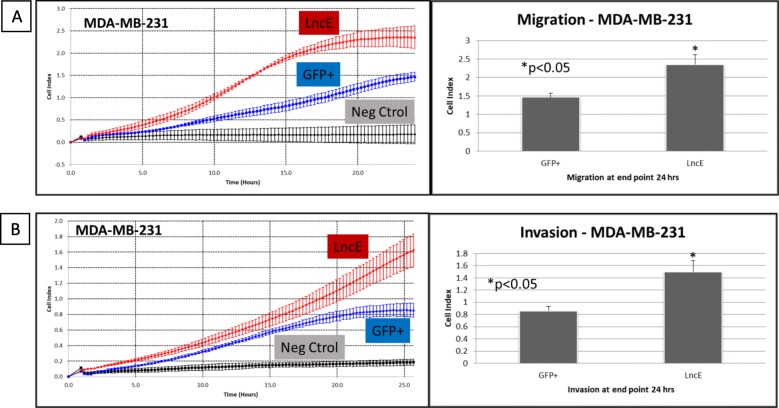
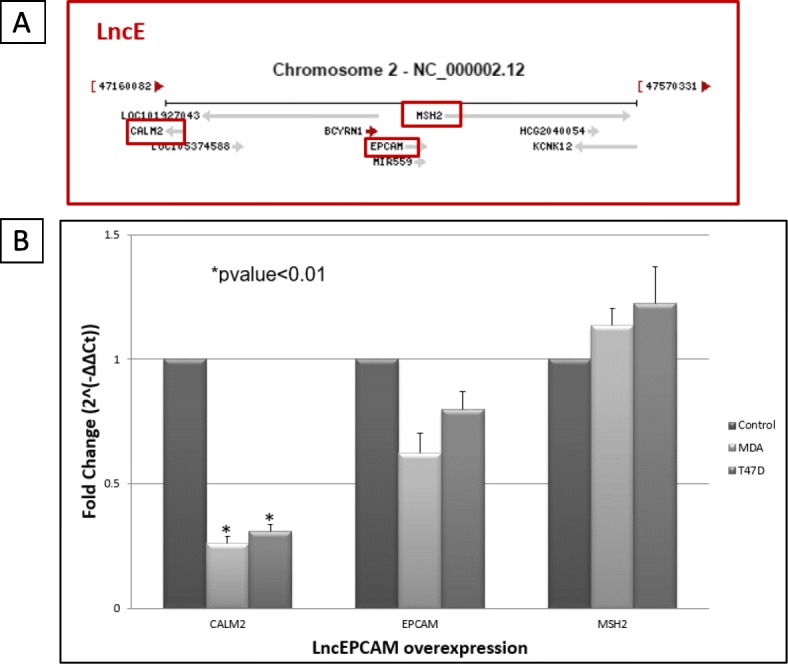
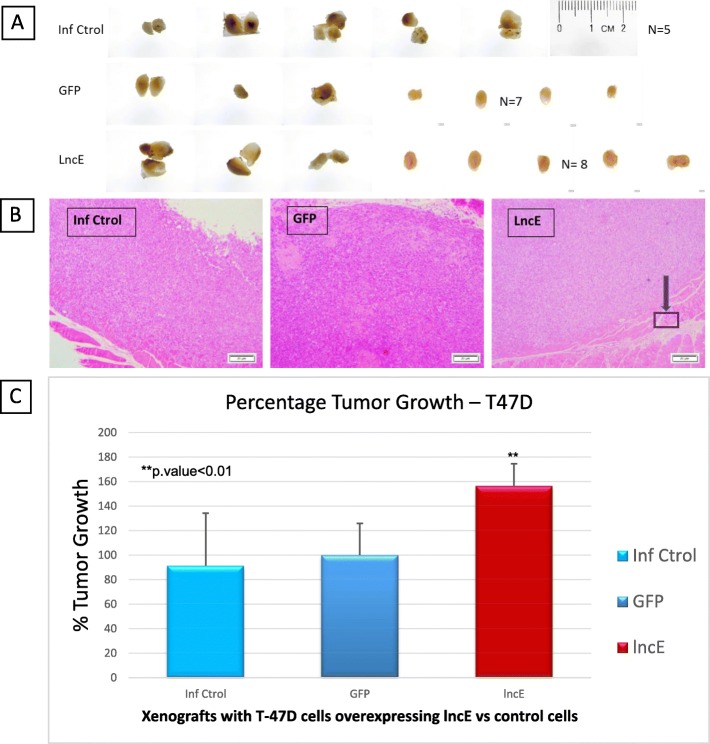
Methods: Transcriptome analysis of normal breast of parous and nulliparous postmenopausal women revealed that several lncRNAs are differentially expressed in the parous breast. RNA sequencing of healthy postmenopausal breast tissue biopsies from eight parous and eight nulliparous women showed that there are 42 novel lncRNAs differentially expressed between these two groups. Screening of several of these 42 lncRNAs by RT-qPCR in different breast cancer cell lines, provided evidence that one in particular, lncEPCAM (more commonly known as BC200), was a strong candidate involved in cancer progression. Proliferation, migration, invasion and xerograph studies confirmed this hypothesis.

Results: The poorly studied oncogenic BC200 was selected to be tested in vitro and in vivo to determine its relevance in breast cancer and also to provide us with an understanding of its role in the increased susceptibility of the nulliparous women to cancer. Our results show that BC200 is upregulated in nulliparous women, and breast cancer cells and tissue. The role of BC200 is not completely understood in any of the breast cancer subtypes. We here provide evidence that BC200 has a role in luminal breast cancer as well as in the triple negative breast cancer subtype.

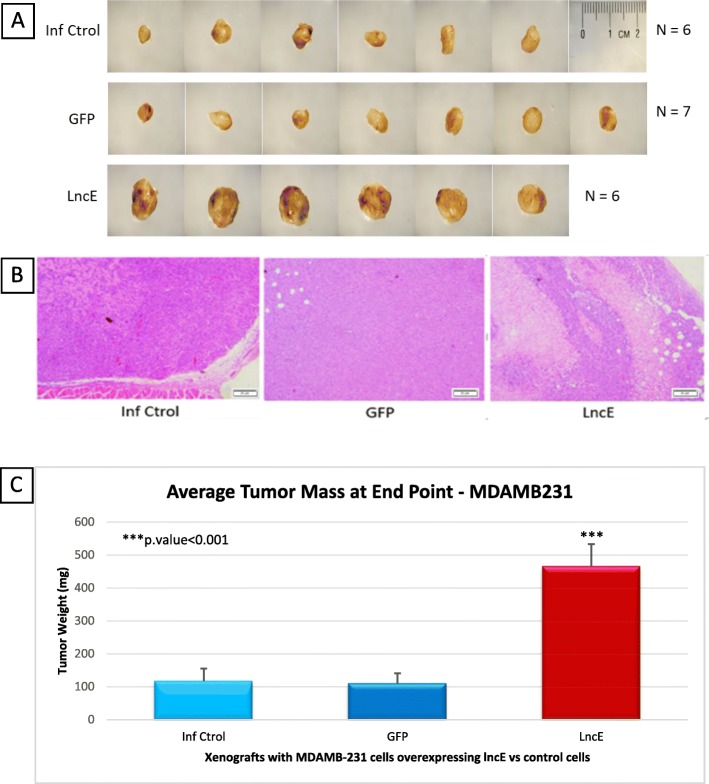
Conclusion: When overexpressed in luminal and triple negative breast cancer cell lines, BC200 shows increased proliferation, migration, and invasion in vitro. In vivo, overexpression of BC200 increased tumor size. Although treatment for cancer using lncRNAs as targets is in its infancy, the advancement in knowledge and technology to study their relevance in disease could lead to the development of novel treatment and preventive strategies for breast cancer.

Keywords: Breast cancer; Long non-coding RNAs; Luminal; Overexpression; Parity; Prevention; TNBC.


Conflict of interest statement

The authors declare that they have no competing interests.

Figures

Fig. 1
Fig. 1
Heatmap of differentially expressed lncRNAs in the breast tissue of parous and nulliparous women. From a total of 42 differentially expressed lncRNA regions, 21 were downregulated in parous breast (in green) and 21 were upregulated (in red). Fold change > = 2.0 & adjusted p-value < = 0.05. The two colors under each group (for example, parous = 2 shades of blue) indicate 2 batches sequenced at different times. All other factors were kept them same
Fig. 2
Fig. 2
Expression levels of ten lncRNAs in breast cell lines. LncRNA expression is clustered according to breast cancer subtype
Fig. 3
Fig. 3
Breast cancer tissue quality evaluation and lncEPCAM/BC200 expression in breast cancer tissues. a H&E staining of breast cancer tissues. Expected tissue structures and morphology for normal tissue (left panel - ducts and ductules) and tumor tissue (right panel) (100x magnification). b Expression of BC200 in cancer tissue. BC200 is upregulated in 5 out of 10 patients’ breast tumor compared to normal adjacent tissue (BC200 is not expressed in the other 5 tumor tissues). Fold change was determined by the following equations: ΔCt = Ct_gene – Ct18S; ΔΔCt = ΔCt_gene – ΔCt_GFP; Fold change = 2(−ΔΔCt) where 18S was used as housekeeping gene. Error bars indicate standard deviation between three technical replicates
Fig. 4
Fig. 4
LncRNA expression in cancer cells. a MALAT-1 expression in luminal (MCF-7 and T-47D) and triple negative breast cancer (MDA-231: MDA-MB-231) cell lines. MALAT-1 RNA was tested to determine the level of expression of this abundant lncRNA used as positive control. MALAT-1 is a nuclear lncRNA. b LncEPCAM/BC200 expression in luminal and triple negative breast cancer cell lines. LncEPCAM/BC200 is both nuclear and cytoplasmic. All images were taken at 400x magnification
Fig. 5
Fig. 5
Proliferation of T-47D and MDA-MB-231 cells. a Proliferation rate of T-47D by RTCA. Twenty thousand (20,000) cells/well were plated and followed for 72 consecutive hours with data collected every hour; 4 replicates per construct. b Proliferation rate of MDA-MB-231 by RTCA. Fifteen thousand (15,000) cells/well were plated and followed for 48 consecutive hours with data collected every hour; 4 replicates per construct. Cells were recorded for at least 48 h – depending on proliferation rate - to determine proliferation rates of cells overexpressing different constructs (Inf Ctrol: no construct or scrambled; GFP+: GFP-expressing vector/empty vector; LncE: lncEPCAM/BC200 overexpressing cells). Left panel is the graph obtained in real time. Right panel represents results from the left panel at specified time points. Results are representative of 3 independent infections (n = 3). *p.value (p) < 0.05; **p.value (p) < 0.01 (Inf Ctrol for MDA-MB-231 curve overlapped with MDA-GFP+ and was removed from graph for clarity)
Fig. 6
Fig. 6
Effect of BC200 on (a) migration and (b) invasion. MDA-MB-231 cells overexpressing BC200 were subjected to real time cell analysis migration (upper left) and invasion (lower left). Left panels (A and B) show the real time results of cells being recorded every 15 min for 24 h. Right panels (A and B) show results at end point (24 h after seeding 20,000 cells on wells for migration – or wells coated with matrigel for invasion). Results are representative of 3 independent cell infections (n = 3) with average of 4 replicates in each independent experiment. LncE = lncEPCAM = BC200; Neg ctrol = negative control – no serum added to the lower chamber of the RTCA plates. For the invasion experiment, twenty thousand (20,000) cells/well were seeded on matrigel coated wells and were let to invade through the upper chamber to the lower chamber for 24 h
Fig. 7
Fig. 7
LncEPCAM locus. a Genomic region around lncEPCAM. NCBI representation of lncEPCAM/BC200/BCYRN1 genomic neighborhood. CALM2, EPCAM and MSH2 were selected to be further evaluated. b Evaluating Cis regulation. Effect of lncEPCAM/BC200 overexpression on nearby genes in MDA-MB-231 (MDA) and T47D cell lines. Fold change was determined by the following equations: ΔCt = Ct_gene – Ct18S; ΔΔCt = ΔCt_gene – ΔCt_GFP; Fold change = 2(−ΔΔCt) where 18S was used as housekeeping gene and Ct_GFP corresponds to threshold of the gene in cells that express GFP. Error bars indicate standard deviation between two independent experiments. MDA: MDA-MB-231; T-47D: T-47D
Fig. 8
Fig. 8
Mice T-47D tumors overexpressing lncE/BC200 and histological sectioning. a Tumors dissected from each mice at 4 weeks. b Representative H&E stained section of poorly differentiated tumor at end point (4 weeks) (40x magnification). The tumor has invaded to the muscle (squared section). c Percent tumor growth at end point. **p.value < 0.01. lncE: lncEPCAM. a shows the dissected tumors at end point for T-47D. H&E staining of poorly differentiated adenocarcinoma is shown in b. Results in c are expressed as percentage tumor growth as two separate experiments’ results were combined to increase the power. Mice containing T-47D-lncEPCAM cells in the mammary fat pad (c), grow significantly larger tumors compared to T-47D-GFP in the 4-week period of the experiment
Fig. 9
Fig. 9
Mice MDA-MB-231 tumors overexpressing lncE/BC200, and histological sectioning. a Tumors dissected from each mice at end of 4 weeks. b Representative H&E stained section of poorly differentiated tumor at end point (4 weeks) (40x magnification). c Tumor weight at end point. ***p.value < 0.001. lncE: lncEPCAM. a shows the dissected tumors at end point for MDA-MB-231. H&E staining of poorly differentiated adenocarcinoma is shown in b. As c shows, mice containing MDA-MB-231-lncEPCAM cells in the mammary fat pad, grow significantly larger tumors compared to MDA-MB-231-GFP in the 4-week period of the experiment

References

    1. DeSantis CE, et al. Cancer statistics for African Americans, 2016: Progress and opportunities in reducing racial disparities. CA Cancer J Clin. 2016;66(4):290–308. doi: 10.3322/caac.21340. - DOI - PubMed
    1. Siegel RL, Miller KD, Jemal A. Cancer statistics, 2016. CA Cancer J Clin. 2016;66(1):7–30. doi: 10.3322/caac.21332. - DOI - PubMed
    1. Torre LA, et al. Cancer statistics for Asian Americans, native Hawaiians, and Pacific islanders, 2016: converging incidence in males and females. CA Cancer J Clin. 2016;66(3):182–202. doi: 10.3322/caac.21335. - DOI - PMC - PubMed
    1. Tamimi RM, et al. Traditional breast cancer risk factors in relation to molecular subtypes of breast cancer. Breast Cancer Res Treat. 2012;131(1):159–167. doi: 10.1007/s10549-011-1702-0. - DOI - PMC - PubMed
    1. Cancer Genome Atlas, N Comprehensive molecular portraits of human breast tumours. Nature. 2012;490(7418):61–70. doi: 10.1038/nature11412. - DOI - PMC - PubMed

MeSH terms

Substances