

Socioeconomic status and stroke incidence, prevalence, mortality, and worldwide burden: an ecological analysis from the Global Burden of Disease Study 2017
- PMID: 31647003
- PMCID: PMC6813111
- DOI: 10.1186/s12916-019-1397-3
Socioeconomic status and stroke incidence, prevalence, mortality, and worldwide burden: an ecological analysis from the Global Burden of Disease Study 2017
Abstract
Background: Socioeconomic status (SES) is associated with stroke incidence and mortality. Distribution of stroke risk factors is changing worldwide; evidence on these trends is crucial to the allocation of resources for prevention strategies to tackle major modifiable risk factors with the highest impact on stroke burden.
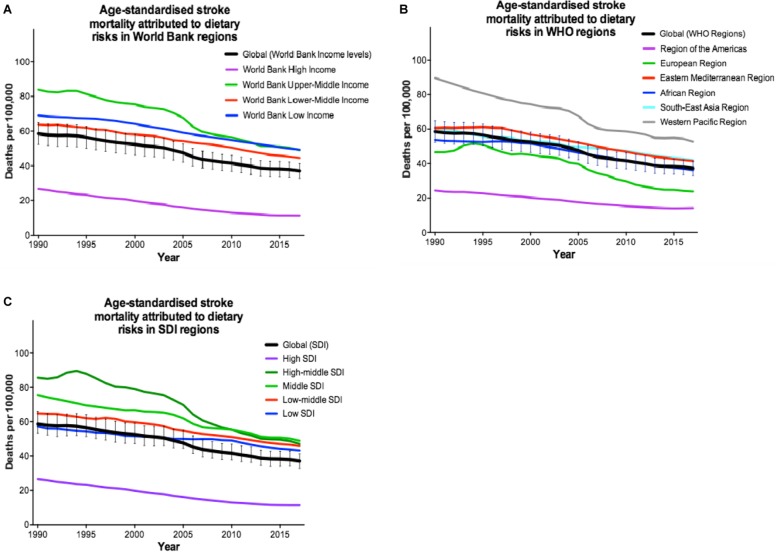
Methods: We extracted data from the Global Burden of Diseases, Injuries, and Risk Factors Study (GBD) 2017. We analysed trends in global and SES-specific age-standardised stroke incidence, prevalence, mortality, and disability-adjusted life years (DALYs) lost from 1990 to 2017. We also estimated the age-standardised attributable risk of stroke mortality associated with common risk factors in low-, low-middle-, upper-middle-, and high-income countries. Further, we explored the effect of age and sex on associations of risk factors with stroke mortality from 1990 to 2017.
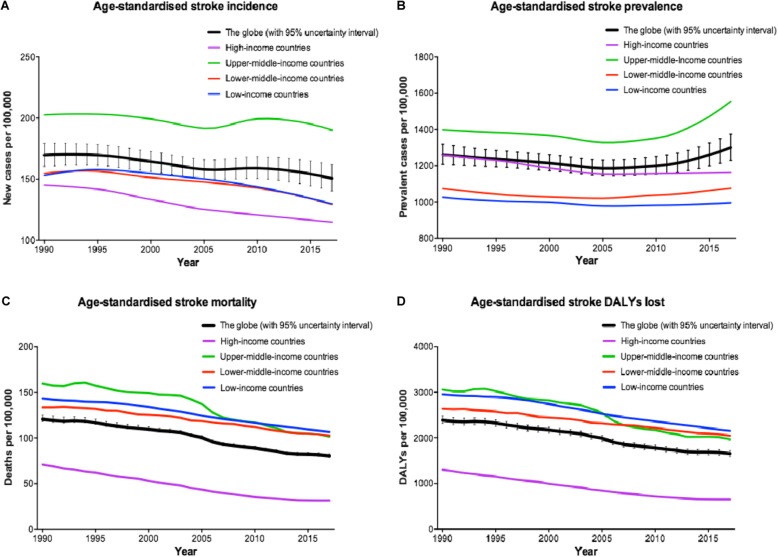
Results: Despite a growth in crude number of stroke events from 1990 to 2017, there has been an 11.3% decrease in age-standardised stroke incidence rate worldwide (150.5, 95% uncertainty interval [UI] 140.3-161.8 per 100,000 in 2017). This has been accompanied by an overall 3.1% increase in age-standardised stroke prevalence rate (1300.6, UI 1229.0-1374.7 per 100,000 in 2017) and a 33.4% decrease in age-standardised stroke mortality rate (80.5, UI 78.9-82.6 per 100,000 in 2017) over the same time period. The rising trends in age-standardised stroke prevalence have been observed only in middle-income countries, despite declining trends in age-standardised stroke incidence and mortality in all income categories since 2005. Further, there has been almost a 34% reduction in stroke death rate (67.8, UI 64.1-71.1 per 100,000 in 2017) attributable to modifiable risk factors, more prominently in wealthier countries.
Conclusions: Almost half of stroke-related deaths are attributable to poor management of modifiable risk factors, and thus potentially preventable. We should appreciate societal barriers in lower-SES groups to design tailored preventive strategies. Despite improvements in general health knowledge, access to healthcare, and preventative strategies, SES is still strongly associated with modifiable risk factors and stroke burden; thus, screening of people from low SES at higher stroke risk is crucial.
Keywords: Cause of death; Global burden of disease; Global health; Life style; Morbidity; Non-communicable diseases; Public health practice; Risk factors; Socioeconomic factors; Stroke.
Conflict of interest statement
The authors declare that they have no competing interests.
Figures
References
-
- World Health Organization. Projections of mortality and causes of death, 2015 and 2030. Health statistics and information systems. 2013. http://www.who.int/entity/healthinfo/global_burden_disease/GHE_DthGlobal.... Accessed 21 June 2016.
-
- World Bank Country and Lending Groups. The World Bank. 2017. https://datahelpdesk.worldbank.org/knowledgebase/articles/906519. Accessed 1 Dec 2017.
MeSH terms
LinkOut - more resources
Full Text Sources
Medical
