. 2020 Jan 8;48(D1):D579-D589.
doi: 10.1093/nar/gkz926.

MicroScope: an integrated platform for the annotation and exploration of microbial gene functions through genomic, pangenomic and metabolic comparative analysis

Affiliations

MicroScope: an integrated platform for the annotation and exploration of microbial gene functions through genomic, pangenomic and metabolic comparative analysis

David Vallenet et al. Nucleic Acids Res. .

Abstract

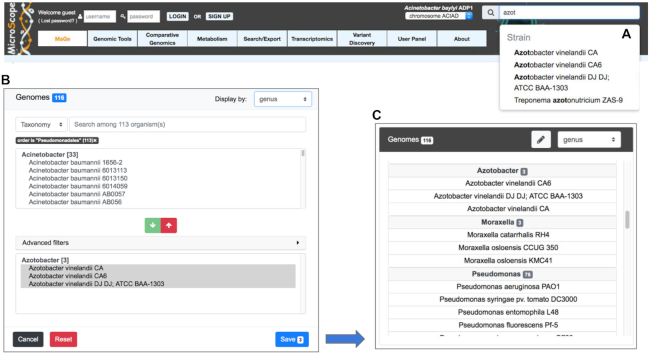
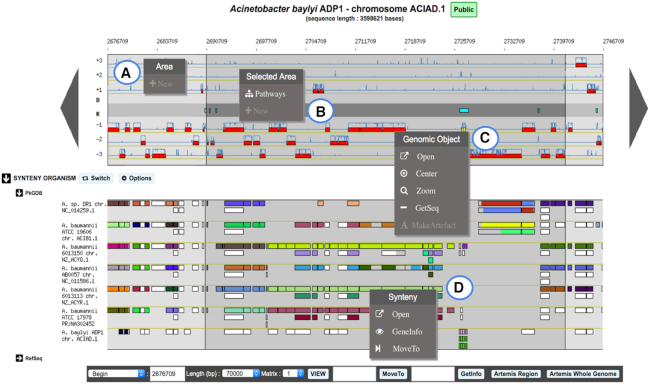
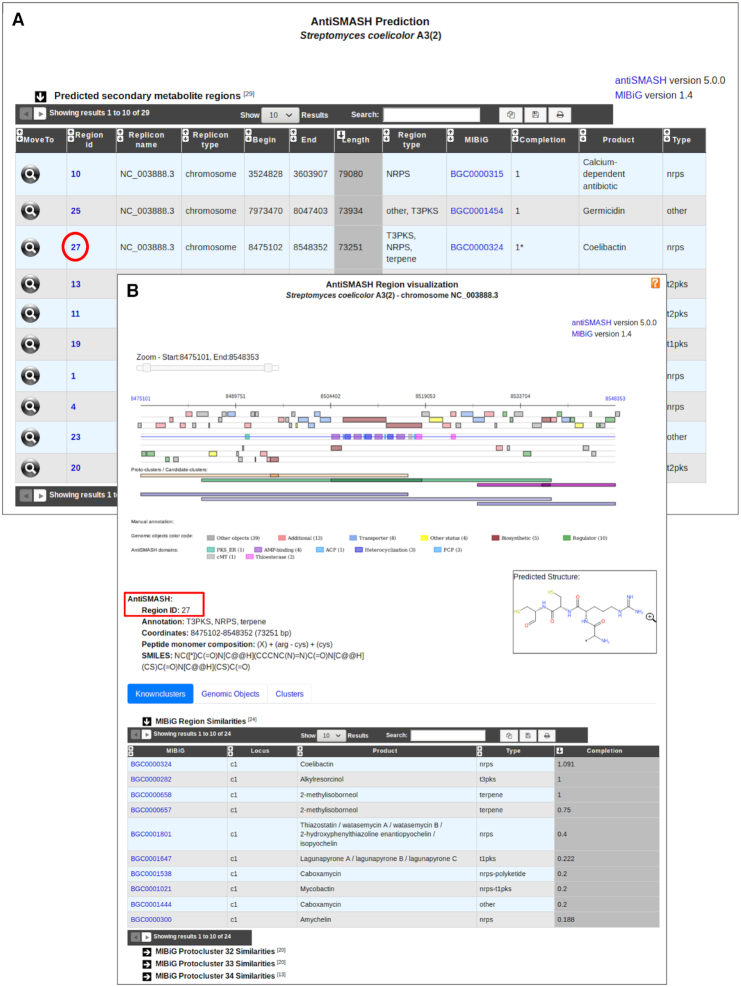
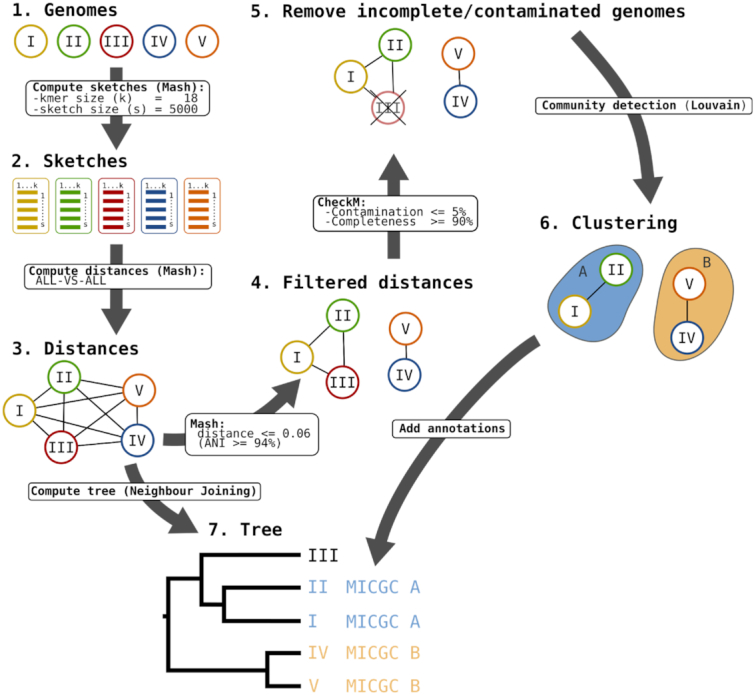
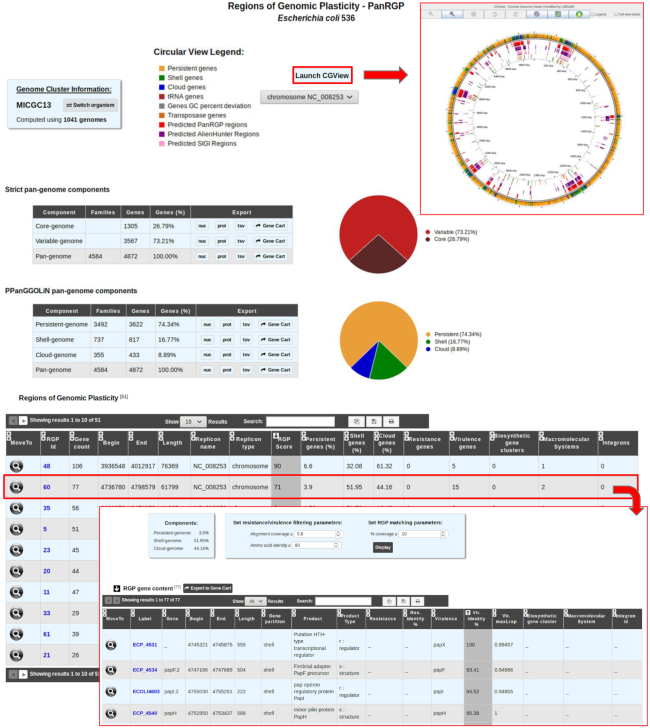
Large-scale genome sequencing and the increasingly massive use of high-throughput approaches produce a vast amount of new information that completely transforms our understanding of thousands of microbial species. However, despite the development of powerful bioinformatics approaches, full interpretation of the content of these genomes remains a difficult task. Launched in 2005, the MicroScope platform (https://www.genoscope.cns.fr/agc/microscope) has been under continuous development and provides analysis for prokaryotic genome projects together with metabolic network reconstruction and post-genomic experiments allowing users to improve the understanding of gene functions. Here we present new improvements of the MicroScope user interface for genome selection, navigation and expert gene annotation. Automatic functional annotation procedures of the platform have also been updated and we added several new tools for the functional annotation of genes and genomic regions. We finally focus on new tools and pipeline developed to perform comparative analyses on hundreds of genomes based on pangenome graphs. To date, MicroScope contains data for >11 800 microbial genomes, part of which are manually curated and maintained by microbiologists (>4500 personal accounts in September 2019). The platform enables collaborative work in a rich comparative genomic context and improves community-based curation efforts.


Figures

Figure 1.
Figure 1.
Genome Selectors of the MicroScope platform. Two new widgets for the selection of sequences or genomes are available. The ‘simple selector’ is shown in panel (A). It is a search suggest drop-down list that allows users to quickly select the genome of interest while the species or strain name is being typed. In panel (B), the ‘advanced selector’ allows users to select multiple sequences or genomes by applying filters based on the taxonomy, strain names or identifiers of MICGCs. It is made up of a pre-selection area that lists all matching entries according to the filters and a selection area to refine the final list of sequences to save using arrow buttons to add (green button) or remove (red button) entries. Optional additional filters (‘Advanced filters’ menu) can be used to remove entries. The saved list is then displayed according to the desired taxonomic level (genus level in panel C).
Figure 2.
Figure 2.
Overview of MicroScope Genome Browser. A 70-kb chromosomal segment from Acinetobacter baylyi ADP1, starting at position 2676709, is represented on this graphical map of the MicroScope Genome browser. Annotated CDSs are represented in the six reading frames of the sequence by red rectangles, and coding prediction curves (blue curves) are superimposed on the predicted CDSs. The central part of the viewer, colored in gray, separates the reverse strand of the DNA sequence from the direct one. It displays repeat regions as well as non-coding genomic objects (e.g. tRNA, rRNA, misc_RNA) according to their strand. The synteny maps, calculated on a set of selected genomes, are displayed below the genome viewer (here on seven genomes from MicroScope PkGDB database). New contextual menus in the genome browser allow users: (A) to create a new genomic object; (B) to list the KEGG metabolic pathways for which enzymes are encoded in a highlighted region; (C) to access shortcuts to perform different actions on a specific genomic object: open the gene editor, center or zoom the view around this object, get its nucleic and protein sequences or annotate it as an artefact; (D) to explore synteny conservation in other species: open the synteny viewer, get gene information on a homologous gene, move the genome browser to the corresponding region of the compared genome.
Figure 3.
Figure 3.
MicroScope ‘Secondary metabolites’ functionality. BGC predictions for an organism can be accessed from the ‘Secondary metabolites’ section of the ‘Metabolism’ menu. It gives access to a table summarizing BGC region predictions for all replicons of a studied organism (panel A). Here, we see the list of regions predicted by antiSMASH 5 in Streptomyces coelicolor A3(2). The closest known cluster from the MIBiG database is indicated for each prediction if any. All individual predictions can then be explored by clicking on the cluster numbers. An example is shown on the panel B for the region number 27. Biosynthetic genes found in the region are colored in brown and their domain composition is indicated as well. Putative transporter and regulator genes are highlighted in blue and green, respectively. Three protoclusters of three different types have been defined in this region: T1PKS (orange), NRPS (green) and terpene (purple). Each of them is associated with a candidate cluster drawn in blue. Basic region characteristics are indicated below the visualization section such as proposed antiSMASH annotation and coordinates. In case of NRPS/PKS BGC type, the peptide monomer composition is indicated with the corresponding chemical structure encoded in SMILES. The ‘MIBiG Region Similarities’ table indicates similarities with known clusters and the completion value. Here, the NRPS (coelibactin), T3PKS (alkylresorcinol) and terpene (2-methylisoborneol) known clusters are retrieved with high completion values.
Figure 4.
Figure 4.
MICGC Workflow. The workflow to compute MICGCs is made of several steps. First genomic distances between all MicroScope genomes are computed using Mash software with kmer and sketch sizes equal to 18 and 5000, respectively. Then, a weighted graph is made from these distances removing edges corresponding to distances higher than 0.06 (which corresponds to a 94% ANI). Using CheckM results, genomes with estimated contamination >5% or completion <90% are removed from the graph. At last, the Louvain community detection method is applied to define species clusters, called MICGCs. Mash genomic distances are also used to compute neighbor joining trees to classify strains (this functionality is available on the ‘Genome Clustering’ page of MicroScope).
Figure 5.
Figure 5.
Detection of RGP with PanRGP tool. RGP predictions for a genome can be accessed from the ‘Pan-genome RGPs’ section of the ‘Comparative Genomics’ menu (here for Escherichia coli 536). In the genome cluster information panel, the number of genomes of the same MICGC (i.e. species) that were used to compute the pangenome with PPanGGOLiN is indicated. Users may switch to the predictions for another strain using ‘Switch Organism’ button. The ‘Strict pan-genome components’ table represents a summary of the exact core/variable analysis whereas the ‘PPanGGOLiN pan-genome components’ table gives the number of genes and MICFAM families for each PPanGGOLiN partition. Users can extract all this data in fasta files (nucleic and protein), tab-separated values (tsv) files containing the annotations or in a gene cart for further analysis. By clicking on the ‘Launch CGView’ button, it is possible to browse the genes along the genome in a circular representation based on CGView with information about their PPanGGOLiN partition and the RGP locations. The table ‘RGP’ lists all predicted RGPs with a summary of the number of genes involved in antibiotic resistance, virulence, biosynthetic clusters, macromolecular systems and integrons. By clicking on a RGP identifier, a page provides a detailed list of the genes within the selected RGP and a list of similar RGPs in other strains (not shown in the figure).

References

    1. Kersey P.J., Allen J.E., Allot A., Barba M., Boddu S., Bolt B.J., Carvalho-Silva D., Christensen M., Davis P., Grabmueller C. et al. .. Ensembl Genomes 2018: an integrated omics infrastructure for non-vertebrate species. Nucleic Acids Res. 2018; 46:D802–D808. - PMC - PubMed
    1. Chen I.-M.A., Chu K., Palaniappan K., Pillay M., Ratner A., Huang J., Huntemann M., Varghese N., White J.R., Seshadri R. et al. .. IMG/M v.5.0: an integrated data management and comparative analysis system for microbial genomes and microbiomes. Nucleic Acids Res. 2019; 47:D666–D677. - PMC - PubMed
    1. Wattam A.R., Davis J.J., Assaf R., Boisvert S., Brettin T., Bun C., Conrad N., Dietrich E.M., Disz T., Gabbard J.L. et al. .. Improvements to PATRIC, the all-bacterial Bioinformatics Database and Analysis Resource Center. Nucleic Acids Res. 2017; 45:D535–D542. - PMC - PubMed
    1. Vallenet D., Labarre L., Rouy Z., Barbe V., Bocs S., Cruveiller S., Lajus A., Pascal G., Scarpelli C., Médigue C.. MaGe: a microbial genome annotation system supported by synteny results. Nucleic Acids Res. 2006; 34:53–65. - PMC - PubMed
    1. Vallenet D., Engelen S., Mornico D., Cruveiller S., Fleury L., Lajus A., Rouy Z., Roche D., Salvignol G., Scarpelli C. et al. .. MicroScope: a platform for microbial genome annotation and comparative genomics. Database. 2009; 2009:bap021. - PMC - PubMed

Publication types