. 2020 Mar 14;30(3):1499-1515.
doi: 10.1093/cercor/bhz181.

Functional Integration of Neuronal Precursors in the Adult Murine Piriform Cortex

Affiliations

Functional Integration of Neuronal Precursors in the Adult Murine Piriform Cortex

Bruno Benedetti et al. Cereb Cortex. .

Abstract

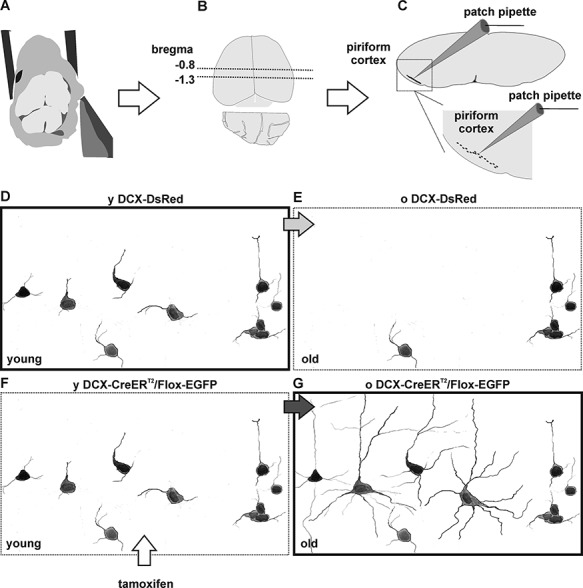
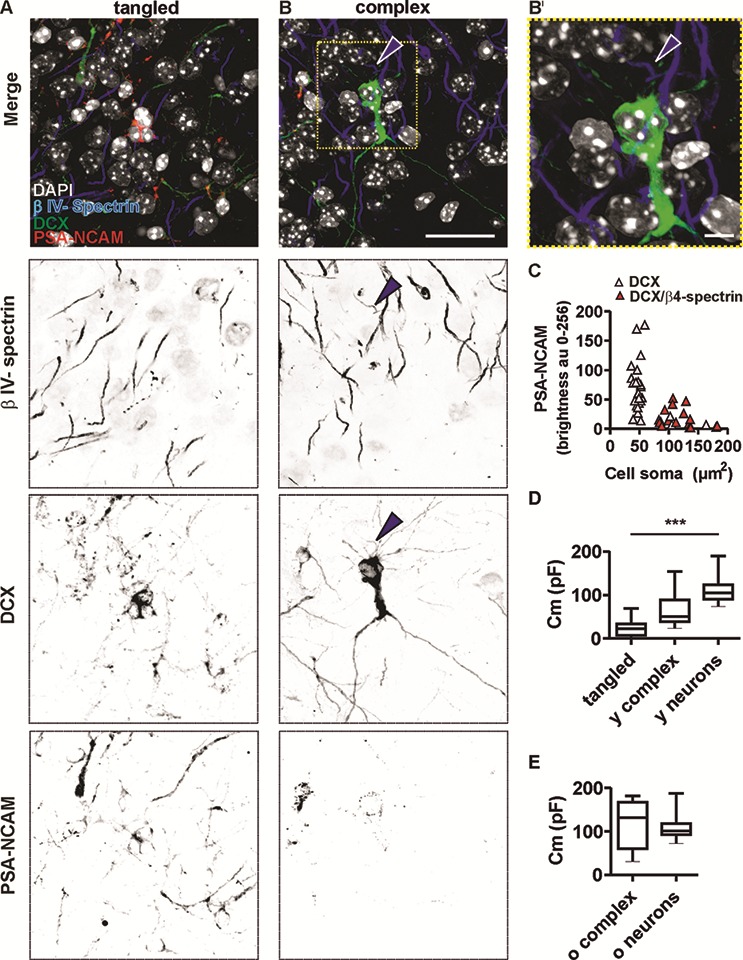
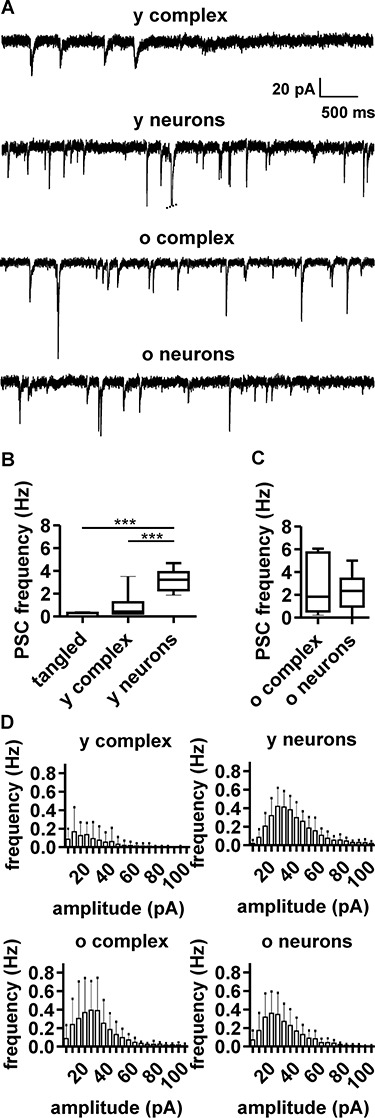
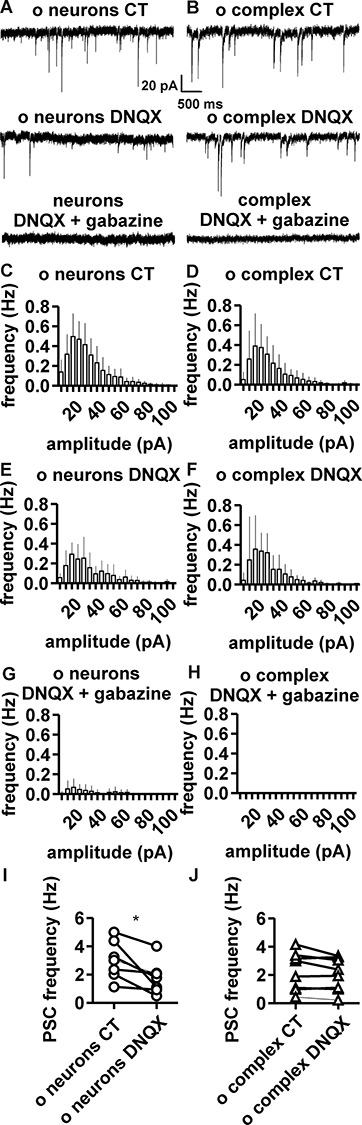
The extent of functional maturation and integration of nonproliferative neuronal precursors, becoming neurons in the adult murine piriform cortex, is largely unexplored. We thus questioned whether precursors eventually become equivalent to neighboring principal neurons or whether they represent a novel functional network element. Adult brain neuronal precursors and immature neurons (complex cells) were labeled in transgenic mice (DCX-DsRed and DCX-CreERT2 /flox-EGFP), and their cell fate was characterized with patch clamp experiments and morphometric analysis of axon initial segments. Young (DCX+) complex cells in the piriform cortex of 2- to 4-month-old mice received sparse synaptic input and fired action potentials at low maximal frequency, resembling neonatal principal neurons. Following maturation, the synaptic input detected on older (DCX-) complex cells was larger, but predominantly GABAergic, despite evidence of glutamatergic synaptic contacts. Furthermore, the rheobase current of old complex cells was larger and the maximal firing frequency was lower than those measured in neighboring age-matched principal neurons. The striking differences between principal neurons and complex cells suggest that the latter are a novel type of neuron and new coding element in the adult brain rather than simple addition or replacement for preexisting network components.

Keywords: adult neurogenesis; axon initial segment; complex cells; doublecortin; tangled cells.


Figures

Figure 1
Figure 1
Experimental model. (AC) Acute brain slice preparation and position of the piriform cortex. After dissection (A), the brain of adult mice was dissected and acute coronal slices were collected from (B) the rostral part of the posterior piriform cortex (Bregma = −0.8 to −1.3), where tangled and complex cells are most abundant. In acute slices, tangled and complex cells were scattered unevenly within the piriform cortex. (DE) Schematic representation of fluorescently labeled cells in the adult brain of DCX-DsRed mice. In the piriform cortex of 2- to 4-month-old (y) DCX-DsRed mice, tangled cells and immature young complex cells are fluorescently labeled (D). In the 4- to 8-month-old (o) DCX-DsRed mice, the number of fluorescently labeled cells decreases dramatically, as DCX is no longer expressed (E). (F, G) Schematic representation of fluorescent-labeled cells in the adult brain of DCX-CreERT2/Flox-EGFP mice, after tamoxifen treatment. In young DCX-CreERT2/Flox-EGFP mice, immature tangled and complex cells are labeled fluorescently (F). In old DCX-CreERT2/Flox-EGFP mice, cells that expressed DCX at the moment of tamoxifen treatment are permanently labeled fluorescently. Thus, targeting labeled cells in young DCX-DsRed mice (D, bold frame) allows characterization of the more immature tangled and complex cells. Targeting labeled cells in old DCX-CreERT2/Flox-EGFP mice (G, bold frame) allows characterization of the more mature old complex cells. Note: for illustrative purposes, the number of fluorescent cells has been enhanced in regard to their actual density in the tissue (see Rotheneichner et al. 2018).
Figure 2
Figure 2
DCX, PSA-NCAM, and ßIV-spectrin expression in tangled cells (column A) and complex cells (column B and B′). Merged and single-channel micrograph of the immature neuronal markers DCX and PSA-NCAM, and of the axon initial segment (AIS) scaffolding protein ßIV-spectrin (scale bar for (A, B) = 25 μm). (B′) Higher magnification of the area outlined in B (upper panel). Arrowhead highlights AIS of a complex cell (scale bar = 5 μm). (C) Intensity of PSA-NCAM expression in tangled cells and complex cells was analyzed and plotted against soma size measured in the DCX detection channel. Note that in the smallest cells (N = 29), the PSA-NCAM signal was most intense (pink triangles). In large cells (N = 14), the PSA-NCAM signal was weaker (red triangles). Larger cells also displayed AIS, marked by co-localization of DCX and ßIV-spectrin. Box plots show membrane capacitance (Cm), an electrical value implying the different size of (D) tangled cells (tangled, N = 12), young complex (young complex N = 8), and young principal neurons (young neurons N = 10) and (E) old complex cells (old complex, N = 11) and old principal neurons (old neurons N = 11). ***P < 0.001.
Figure 3
Figure 3
Spontaneous postsynaptic currents (PSCs) in complex cells and neurons. (A) Representative voltage-clamp recording at holding potential of −70 mV, showing PSCs in young complex cells (young complex, N = 10), young neurons (young neurons, N = 8), old complex cells (old complex, N = 13), and old neurons (old neurons, N = 11). Note the increase of PSC amplitude and frequency in complex cells with age. (B and C) Boxplots show PSC frequency for different cell populations. (D) Histograms show PSC frequency and amplitude for the different cell populations, highlighting some differences between young complex cells and young neurons (see also Table 2 and Supplementary materials) and the large similarity in the PSCs of old complex cells and old neurons.
Figure 4
Figure 4
Pharmacological dissection of glutamatergic and GABAergic input in complex cells and neurons. (A) In neurons, PSCs were partially blocked by DNQX and completely blocked by coapplication of DNQX and gabazine (N = 7). (B) In complex cells, PSCs were seemingly unaffected by application of DNQX, but completely blocked by coapplication of DNQX and gabazine (N = 6). (CH) PSC frequency/amplitude histograms for principal neurons (C) and complex cells (D) in control condition. PSC frequency/amplitude histograms after blockage by DNQX in neurons (E) and complex cells (F). PSC frequency/amplitude histograms for principal neurons (G) and complex cells (H) after coapplication of DNQX and gabazine. Graphs displaying PSC frequency of individual samples, before and after DNQX application, showing (I) significant decrease in PSC frequency in neurons (P = 0.01; paired t-test) and (J) lack of significant difference in PSC frequency in complex cells (P = 0.12; paired t-test).
Figure 5
Figure 5
Excitatory synapses on complex cell dendrites. (A, A’) Dendrite and spines of complex cells are revealed by immunofluorescent labelling of EGFP (green). Detail of a spine highlighted by an arrowhead in (A) is shown in (A’) at higher magnification. (B, B′) Immunofluorescent labelling of the presynaptic marker synaptophysin (SYN, red) outlines the presence of boutons, juxtaposed to complex cell spines. Detail of (B) is shown in (B′) at higher magnification. (C, C′) Immunofluorescent labelling of the vesicular glutamate transporter and presynaptic marker (V-GLUT 1, blue) highlights juxtaposition of glutamatergic boutons and complex cell spines. Detail of (C) is shown in (C′) at higher magnification. (D) Merged fluorescence signals obtained for the EGFP (A), SYN (B), and V-GLUT 1 (C) immunolabelling. Detail of (D) is shown in (D’) at higher magnification. Scale bar (D) = 10 μm; scale bar (D’) = 5 μm.
Figure 6
Figure 6
Action potential firing in complex cells and neurons. (A) Typical patterns of action potential firing in tangled cells, complex cells, and neurons, upon injection and depolarizing current pulses (500 ms). Tangled cells (N = 8) fired single spikes or no spikes. Young complex cells (y complex, N = 8) and old complex cells (o complex, N = 9) fired sparsely. Young principal neurons (y neurons, N = 10) and old principal neurons (o neurons, N = 11) fired at high frequencies. (B) Relation between amplitude of injected current (input) and action potential firing frequency in young complex cells (triangles) and young principal neurons (circles). (C) Relation between amplitude of injected current (input) and action potential firing frequency in old complex cells (half-shaded triangles) and old neurons (half-shaded circles). (D) Box plots indicate maximal action potential frequency upon sustained depolarization, which was significantly lower in young complex cells, compared with young neurons (E). The maximal action potential firing frequency of old complex cells was significantly lower than that of old neurons. (F) The rheobase current of young complex cells was comparable with that of young neurons. (G) The rheobase current of old complex cells was significantly higher than that of old principal neurons. (H, I) No significant difference in input resistance (Ri), comparing young and old populations of complex cells and neurons. (J) Phase plots of action potentials at rheobase show the first derivative of voltage over time (dV/t) plotted against membrane potential (Em). Plots highlight the slow kinetics of action potential firing in young complex cells, as compared with old complex cells and principal neurons. Threshold (Th) highlights 50 V/s. (K) Plot of maximum/minimum slope in complex cells and neurons at different ages. The scarce overlapping of action potential time course in complex cells and neurons is highlighted by squares encompassing respective data range (continuous line = neurons; dotted line = complex cells). Cell populations are represented according to the same symbol legend of (B and C). *P < 0.05; **P < 0.01; ***P < 0.001.
Figure 7
Figure 7
Inward and outward currents in tangled cells, complex cells, and neurons. (A) Typical sample traces from voltage-clamp measurement, displaying inward current upon application of depolarizing voltage steps to −40 mV from a holding potential of −70 mV and graphs showing the voltage–current relation of peak-inward currents (Iin) in tangled cells (N = 10), young complex cells (N = 8), young neurons (N = 10), old complex cells (N = 11) and old principal neurons (N = 11). (B) Typical sample traces, showing outward currents upon application of depolarizing voltage steps from −70 mV to +20 mV and voltage–current relation for the maximal steady-state outward current (Iout) averaged between 400 and 450 ms (500 ms sweeps). (C) The maximal Iin was significantly smaller in tangled cells and in young complex cells than in young neurons. (D) The maximal Iin of old complex cells was equivalent to that of old principal neurons. (E) The maximal Iout of tangled cells and young complex cells was significantly smaller than that of young principal neurons. (F) The maximal Iout of old complex cells was equivalent to that of old principal neurons. (G, H) Activation kinetics (Iin 10–90) of Iin show no significant difference between complex cells and age-matched neurons. (I, J) Inactivation kinetics of maximal outward currents (Iout R500) of Iout show no significant difference between young complex cells and young neurons (I), but a slightly (not significant) smaller rate of Iout inactivation in old complex cells, compared with old neurons (J, P = 0.05). (K, L) Fractional activation of inward current (K) shows a slight but not significant difference in the voltage sensitivity (Vhalf) of young complex cells and young neurons (L). (M, N) Fractional activation of inward current (M) shows significantly larger Vhalf in old complex cells, compared with old neurons (N), implying the lower voltage sensitivity of complex cells. *P < 0.05; **P < 0.01; ***P < 0.001.
Figure 8
Figure 8
Morphology of AIS in old complex cells and principal neurons. (A) Detection of GFP, NeuN, and ßIV-spectrin in the posterior piriform cortex to analyze the AIS of old complex cells and old principal neurons. Green arrowheads mark a complex cell and its AIS; blue arrowheads mark a principal neuron and its AIS. (B and C) Selected examples (highlighted by arrowheads in A) of a complex cell (B) and principal neuron (C) have been reconstructed with their corresponding AIS to highlight the different AIS length between complex cells and other adult principal neurons. For illustration purposes and to emphasize AIS parameters, all background signals not corresponding to these two cells were deleted manually, using Adobe Photoshop (Adobe Systems Inc.). (D) Boxplot shows that the AIS length of old complex cells (old complex N = 224) was significantly shorter than the AIS of old principal neurons (old neurons N = 1025). (E) Boxplot shows that AIS distance from the soma of complex cells (N = 101) and neurons (N = 100) was not significantly different (P = 0.12). (A–C) Scale bars = 15 μm.

References

    1. Alyan SH. 1996. Evidence for resetting the directional component of path integration in the house mouse (Mus musculus). Ethology. 102:629–638.
    1. Alyan SH, Jander R. 1994. Short-range homing in the house mouse, Mus musculus: stages in the learning of directions. Anim Behav. 48(2):285–298.
    1. Arellano JI, Espinosa A, Fairén A. 2007. Non-synaptic dendritic spines in neocortex. Neuroscience. 145:464–469. - PubMed
    1. Ben-Ari Y. 2002. Excitatory actions of gaba during development: the nature of the nurture. Nat Rev Neurosci. 3:728–739. - PubMed
    1. Bhatt DH, Zhang S, Gan W-B. 2009. Dendritic spine dynamics. Annu Rev Physiol. 71:261–282. - PubMed

Publication types

MeSH terms