. 2019 Dec 1;142(12):3771-3790.
doi: 10.1093/brain/awz302.

C9orf72 expansion within astrocytes reduces metabolic flexibility in amyotrophic lateral sclerosis

Affiliations

C9orf72 expansion within astrocytes reduces metabolic flexibility in amyotrophic lateral sclerosis

Scott P Allen et al. Brain. .

Abstract

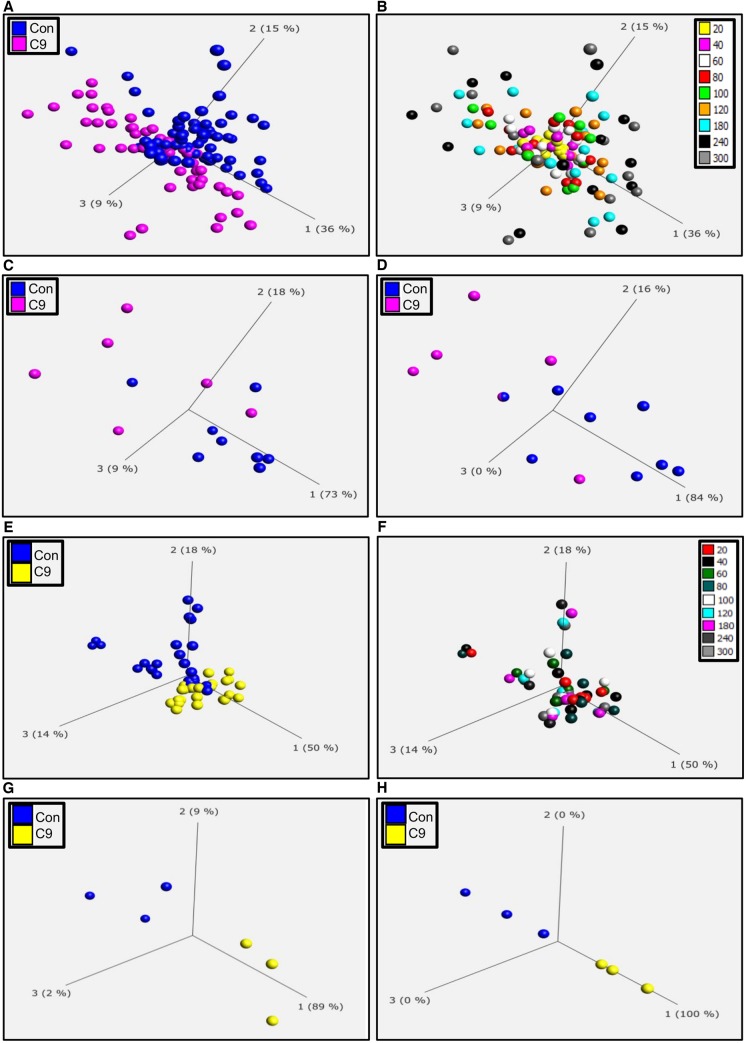
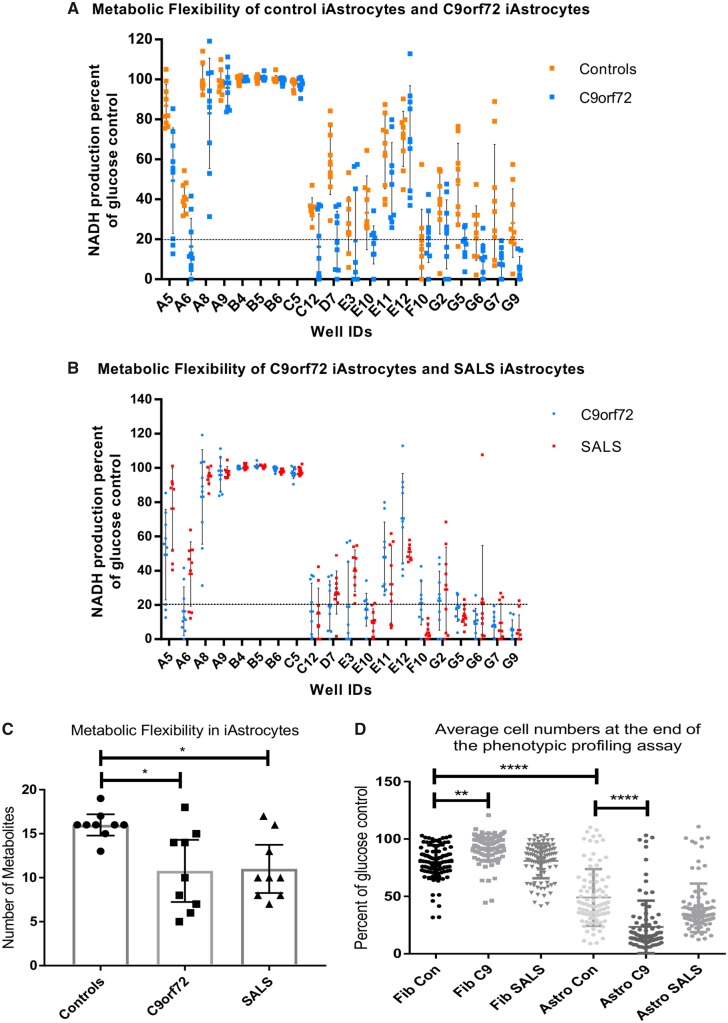
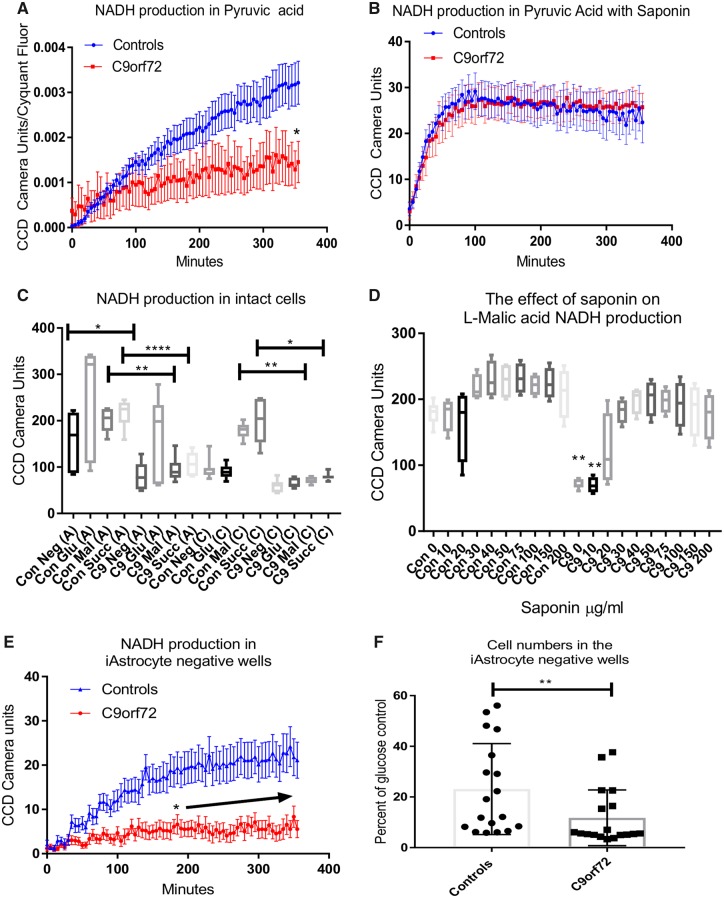
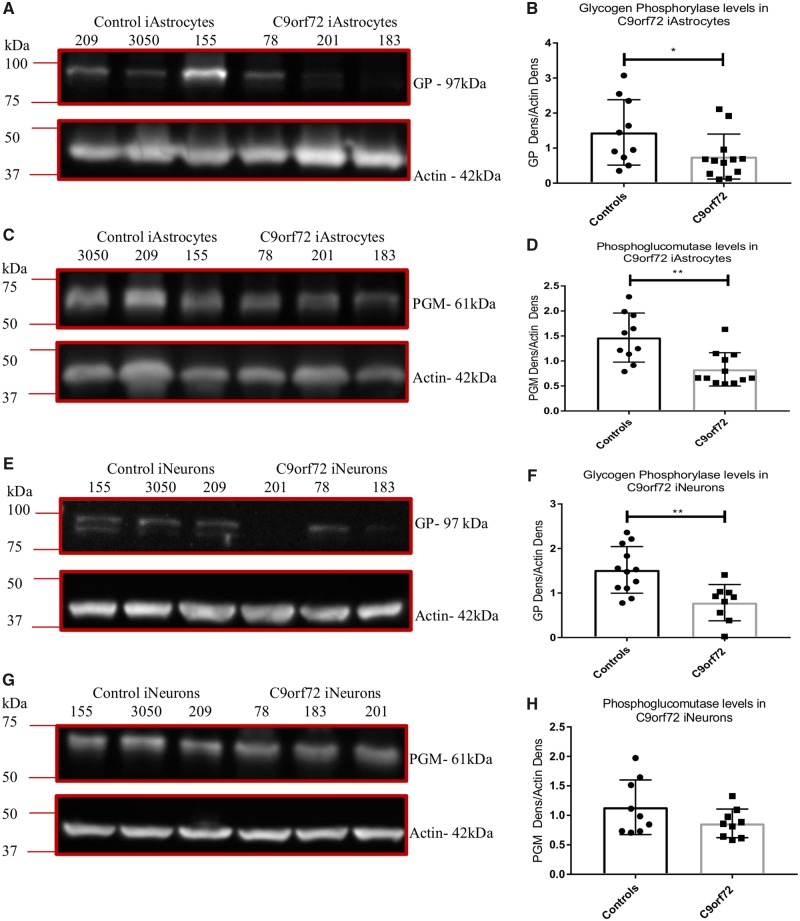
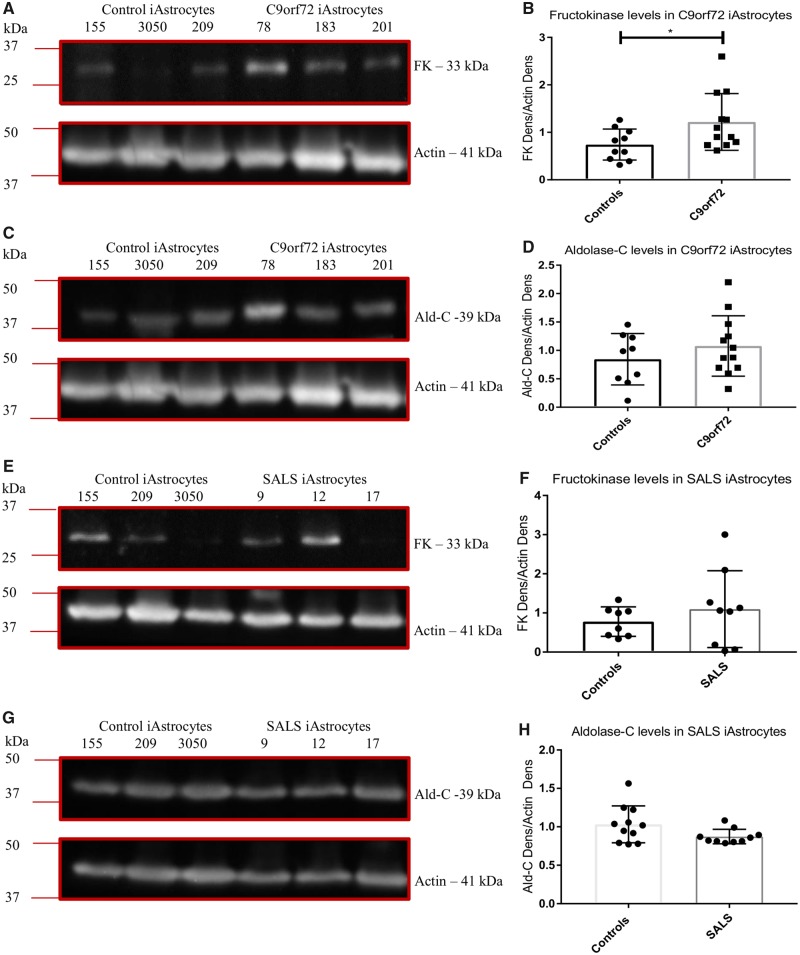
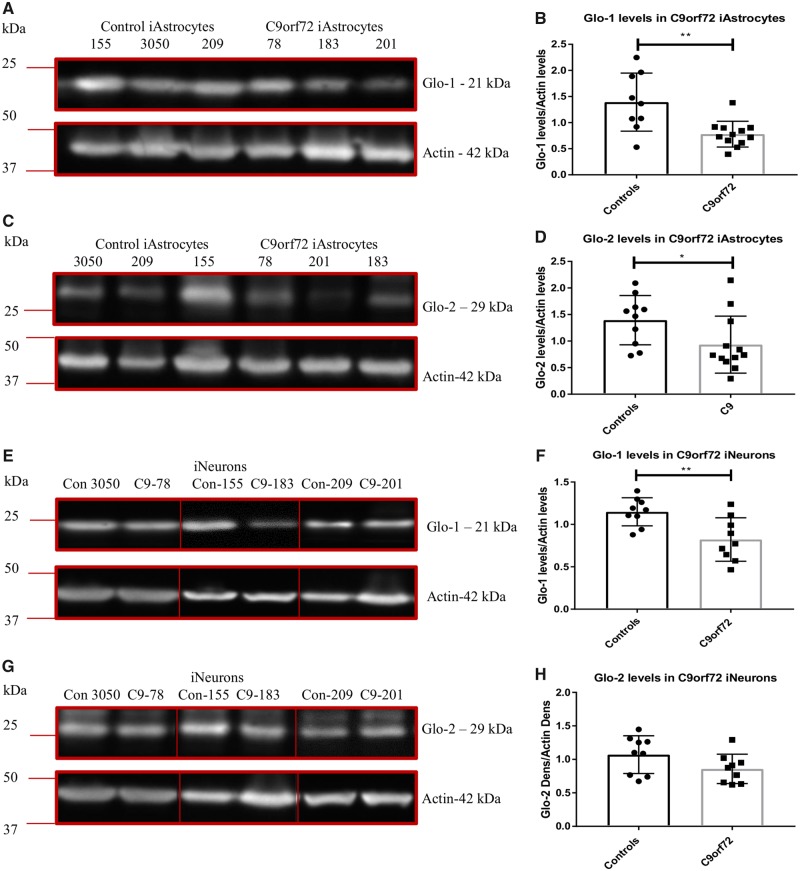
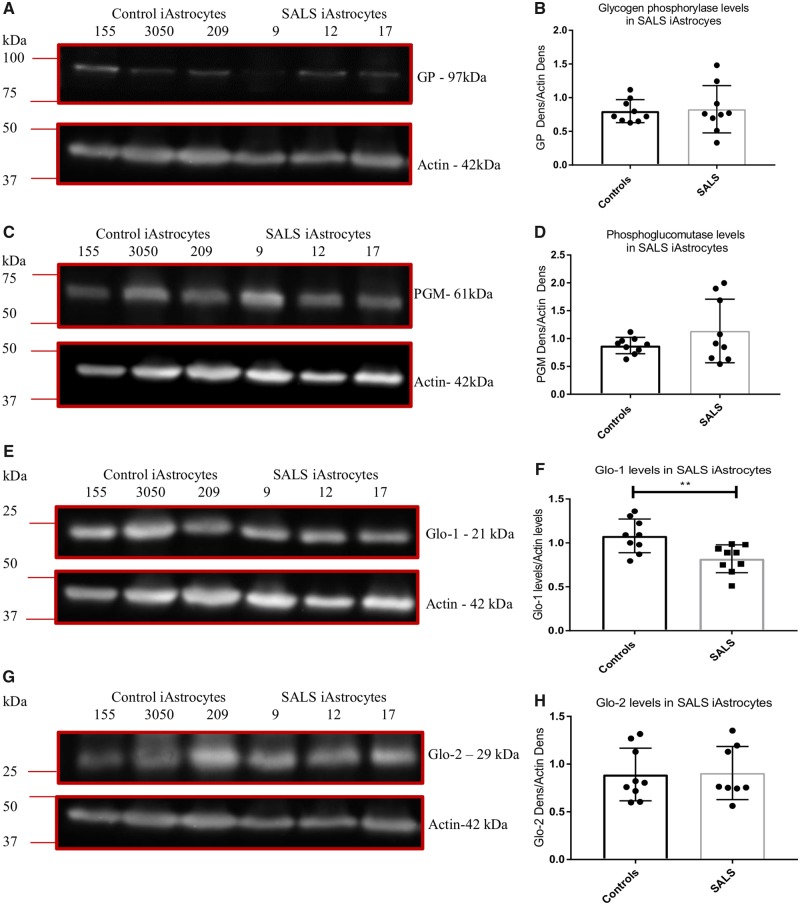
It is important to understand how the disease process affects the metabolic pathways in amyotrophic lateral sclerosis and whether these pathways can be manipulated to ameliorate disease progression. To analyse the basis of the metabolic defect in amyotrophic lateral sclerosis we used a phenotypic metabolic profiling approach. Using fibroblasts and reprogrammed induced astrocytes from C9orf72 and sporadic amyotrophic lateral sclerosis cases we measured the production rate of reduced nicotinamide adenine dinucleotides (NADH) from 91 potential energy substrates simultaneously. Our screening approach identified that C9orf72 and sporadic amyotrophic lateral sclerosis induced astrocytes have distinct metabolic profiles compared to controls and displayed a loss of metabolic flexibility that was not observed in fibroblast models. This loss of metabolic flexibility, involving defects in adenosine, fructose and glycogen metabolism, as well as disruptions in the membrane transport of mitochondrial specific energy substrates, contributed to increased starvation induced toxicity in C9orf72 induced astrocytes. A reduction in glycogen metabolism was attributed to loss of glycogen phosphorylase and phosphoglucomutase at the protein level in both C9orf72 induced astrocytes and induced neurons. In addition, we found alterations in the levels of fructose metabolism enzymes and a reduction in the methylglyoxal removal enzyme GLO1 in both C9orf72 and sporadic models of disease. Our data show that metabolic flexibility is important in the CNS in times of bioenergetic stress.

Keywords: C9orf72; ALS; astrocytes; metabolism; methylglyoxal.


Figures

Figure 1
Figure 1
Cells derived from C9orf72 fibroblast and induced astrocyte cases have an altered metabolic profile. (A) PCA of control fibroblasts (blue, Con) and C9orf72 fibroblasts (pink C9) at all time points. (B) PCA of fibroblasts coloured for individual time points between 20 and 300 min (C) PCA of control fibroblasts (blue, Con) and C9orf72 patient fibroblasts (pink C9) at 120 min. (D) PCA of control fibroblasts (blue, Con) and C9orf72 fibroblasts (pink C9) at 300 min. (E) PCA of control induced astrocytes (blue, Con) and C9orf72 induced astrocytes (yellow, C9) at all time points. (F) PCA of all induced astrocytes coloured for individual time points between 20 and 300 min. (G) PCA of control induced astrocytes (blue, Con) and C9orf72 induced astrocytes (yellow, C9) at 120 min. (H) PCA of control induced astrocytes (blue, Con) and C9orf72 induced astrocytes (yellow, C9) at 300 min. Data are presented as mean of three biological replicates using eight control fibroblasts, six C9orf72 fibroblasts, three control induced astrocytes and three C9of72 induced astrocytes. Analysis performed on Qlucore with the P-value set to ≤0.05. Q-values were 0.113 for control fibroblasts versus C9orf72 and 0.073 for control induced astrocytes versus C9orf72. Percentage values represent eigenvectors calculated for each analysis. The higher the percentage the greater the confidence of the separation based on the vector.
Figure 2
Figure 2
Metabolic flexibility is reduced in C9orf72 induced astrocytes. (A) Metabolic flexibility of control induced astrocytes (orange) versus C9orf72 induced astrocytes (light blue). (B) Metabolic flexibility of C9orf72 (light blue) versus SALS induced astrocytes (red). Data are presented as mean with standard deviation of NADH production as per cent of glucose control (well IDs B4–B6). Metabolic flexibility determined as any energy substrates producing NADH production within 80% of the glucose control. (C) Metabolic flexibility in control, C9orf72 and SALS induced astrocytes. Data are presented as median with 95% confidence intervals followed by one-way ANOVA with Bonferroni post-test analysis. (D) Average cell survival in the metabolic profiling assay. Each datapoint represents cell number in one well of one assay for each ALS case or control, showing mean and standard deviation. Data were transformed 1 = 1/Y and 1 = logit (Y) prior to Kruskal Wallis with Dunn’s post-test analysis. The x-axis displays well IDs from the metabolic screening plate (PM-M1), which corresponds to the position on the 96-well plate, A4 through to H12, each well contains a unique energy substrate apart from B4–B6, which all contain the positive control glucose. A1–A3 are the negative wells and are not included on the graph. *P ≤ 0.05, **P ≤ 0.01, ****P ≤ 0.0001. Astro/iAstrocytes = induced astrocytes; C9 = C9orf72; con = control; Fib = fibroblasts.
Figure 3
Figure 3
C9orf72 induced astrocytes have altered saponin sensitivity compared to control induced astrocytes. (A) NADH production in intact induced astrocytes in the presence of pyruvic acid. Data are presented as mean with standard error followed by two-way ANOVA with Sidak post-test analysis in combination with area under the curve (AUC) analysis and initial (0–120 min) linear regression analysis (Supplementary Table 3). (B) NADH production in the presence of pyruvic acid with saponin. Data are presented as mean with standard error. (C) Induced astrocyte NADH production in the presence of glucose (Glu), l-malic acid (Mal) and succinic acid (Succ). A = Dye A; C = Dye C. Data are presented as mean with standard deviation followed by Kruskal Wallis with Dunn’s post-test analysis. (D) The effect of saponin on l-malic acid induced NADH production in induced astrocytes. Data are presented as mean with standard deviation followed by one-way ANOVA with Bonferroni post-test analysis. (E) Kinetic NADH production in induced astrocyte negative wells (no energy substrate present). Data presented as mean with standard error followed by two-way ANOVA with Sidak post-test analysis in combination with AUC analysis and initial (0–120 min) linear regression analysis (Supplementary Table 3). (F) The effect of starvation on induced astrocyte cell number. Data are presented as mean with standard deviation. Data were transformed 1 = 1/Y and 1 = logit (Y) prior to Mann-Whitney analysis. *P ≤ 0.05, **P ≤ 0.01, ****P ≤ 0.0001. The arrow in E denotes consecutive significant time points.
Figure 4
Figure 4
C9orf72 induced astrocytes and induced neurons have reduced glycogen metabolism enzymes. (A and B) Induced astrocyte GP levels. (C and D) Induced astrocyte PGM levels. (E and F) Induced neuron GP levels. (G and H) Induced neuron PGM levels. Densitometry analysis performed by normalizing the protein level of interest to the loading control (actin). Representative western blot of three controls versus three C9orf72 cases performed n = 3/4 before densitometry analysis followed by a Mann-Whitney (B and D) or an unpaired t-test (F and H). *P ≤ 0.05. iAstrocytes = induced astrocytes; iNeurons = induced neurons.
Figure 5
Figure 5
C9orf72 induced astrocytes have altered levels of fructokinase. (A and B) C9orf72 induced astrocyte fructokinase levels (FK). (C and D) C9orf72 induced astrocyte aldolase-C levels (Ald-C). (E and F) SALS induced astrocyte fructokinase levels. (G and H) SALS induced astrocyte aldolase-C levels (Ald-C). Densitometry analysis performed by normalizing the protein level of interest to the loading control (actin). Representative western blot of three controls versus three ALS cases performed n = 3 before densitometry analysis. Data are presented as mean and standard deviation from three independent biological replicates. All data analysed by an unpaired t-test analysis. *P ≤ 0.05. iAstrocytes = induced astrocytes.
Figure 6
Figure 6
C9orf72 induced astrocytes and induced neurons have reduced methylglyoxal removal enzymes. (A and B) Induced astrocyte GLO1 levels. (C and D) Induced astrocyte GLO2 levels. (E and F) Induced neuron GLO1 levels. (G and H) Induced neuron GLO2 levels. Densitometry analysis performed by normalizing the protein level of interest to the loading control (actin). Representative western blot of three controls versus three C9orf72 cases performed n = 3/4 before densitometry analysis and analysis by an unpaired t-test (B and F) or a Mann-Whitney test (D). *P ≤ 0.05, **P ≤ 0.01. Lines on blots indicated cropped images. For full length blots, see Supplementary Fig. 8C. iAstrocytes = induced astrocytes; iNeurons = induced neurons.
Figure 7
Figure 7
SALS induced astrocytes have reduced GLO1 levels. (A and B) Induced astrocyte GP levels. (C and D) Induced astrocyte PGM levels. (E and F) Induced astrocyte GLO1 levels. (G and H) Induced astrocyte GLO2 levels. Densitometry analysis performed by normalizing the protein level of interest to the loading control (actin). Representative western blot of three controls versus three SALS cases performed n = 3 before densitometry analysis followed by an unpaired t-tests. **P ≤ 0.01. iAstrocytes = induced astrocytes.

References

    1. Allaman I, Belanger M, Magistretti PJ. Methylglyoxal, the dark side of glycolysis. Front Neurosci 2015; 9: 23. - PMC - PubMed
    1. Allen SP, Duffy LM, Shaw PJ, Grierson AJ. Altered age-related changes in bioenergetic properties and mitochondrial morphology in fibroblasts from sporadic amyotrophic lateral sclerosis patients. Neurobiol Aging 2015; 36: 2893–903. - PubMed
    1. Allen SP, Hall B, Castelli LM, Francis L, Woof R, Siskos AP, et al. Astrocyte adenosine deaminase loss increases motor neuron toxicity in amyotrophic lateral sclerosis. Brain 2019; 142: 586–605. - PMC - PubMed
    1. Allen S, Heath PR, Kirby J, Wharton SB, Cookson MR, Menzies FM, et al. Analysis of the cytosolic proteome in a cell culture model of familial amyotrophic lateral sclerosis reveals alterations to the proteasome, antioxidant defenses, and nitric oxide synthetic pathways. J Biol Chem 2003; 278: 6371–83. - PubMed
    1. Allen SP, Rajan S, Duffy L, Mortiboys H, Higginbottom A, Grierson AJ, et al. Superoxide dismutase 1 mutation in a cellular model of amyotrophic lateral sclerosis shifts energy generation from oxidative phosphorylation to glycolysis. Neurobiol Aging 2014; 35: 1499–509. - PubMed

Publication types