. 2020 Jan;44(1):16-25.
doi: 10.1002/gepi.22267. Epub 2019 Oct 24.

Transethnic meta-analysis of metabolic syndrome in a multiethnic study

Affiliations

Transethnic meta-analysis of metabolic syndrome in a multiethnic study

Emileigh L Willems et al. Genet Epidemiol. 2020 Jan.

Abstract

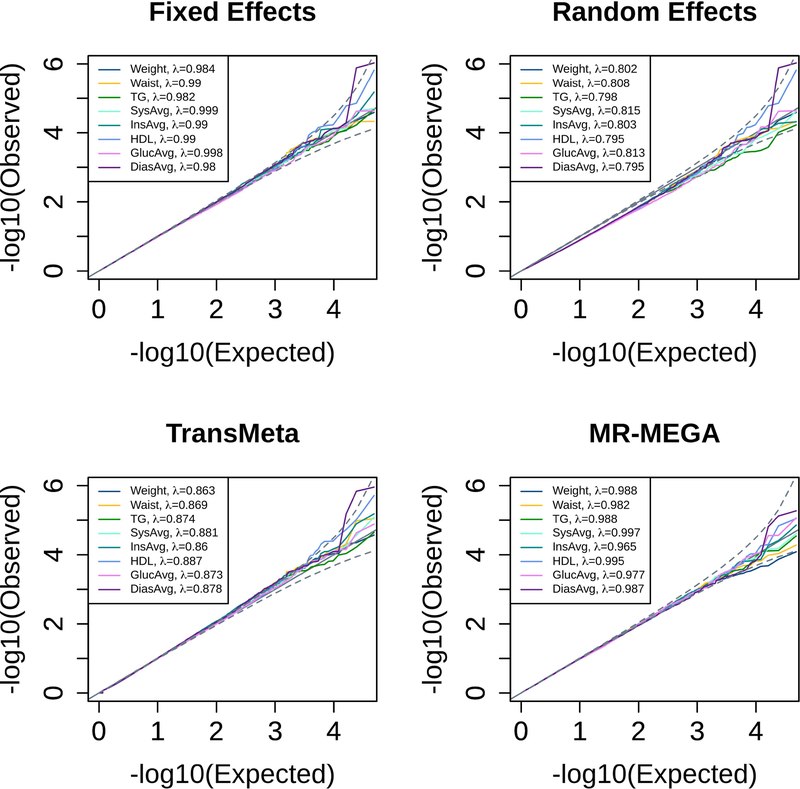
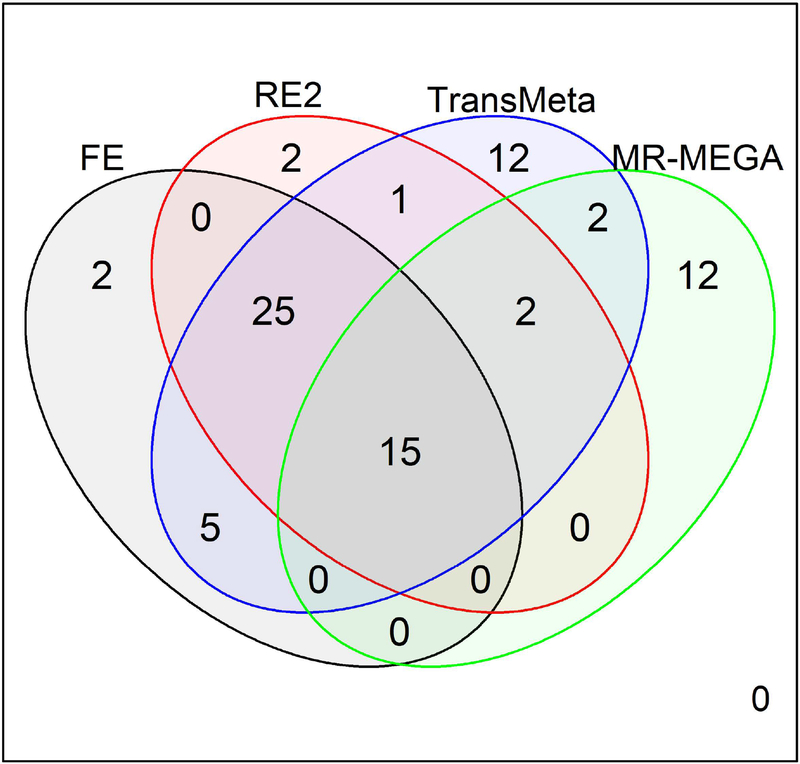
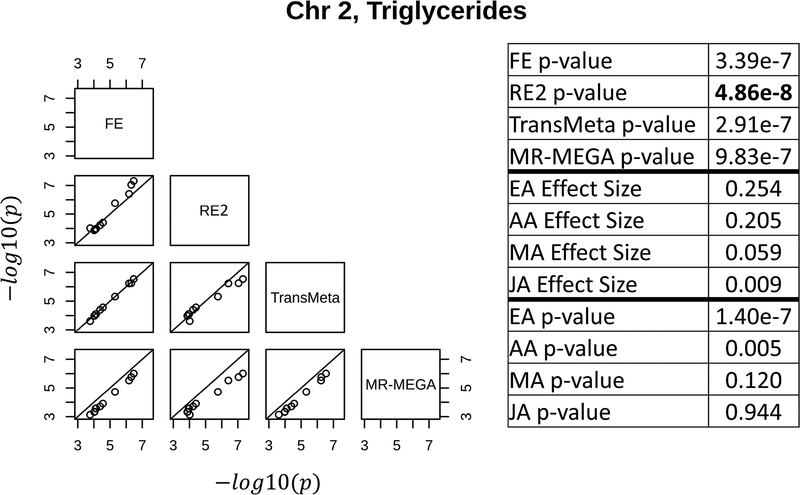
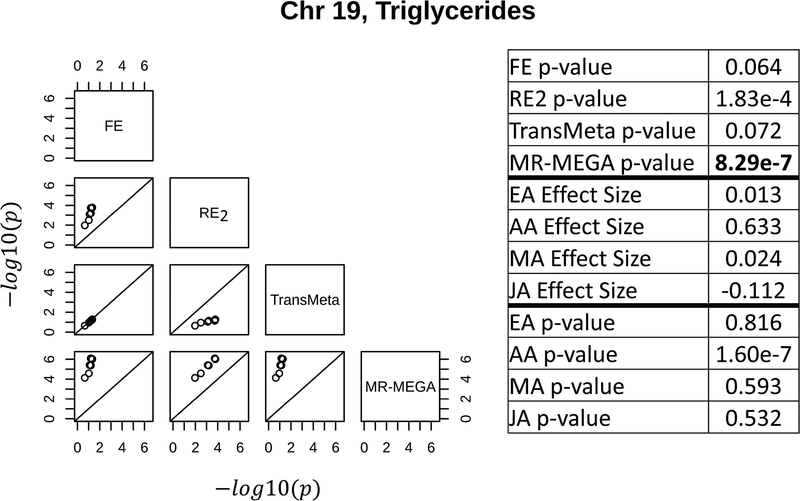
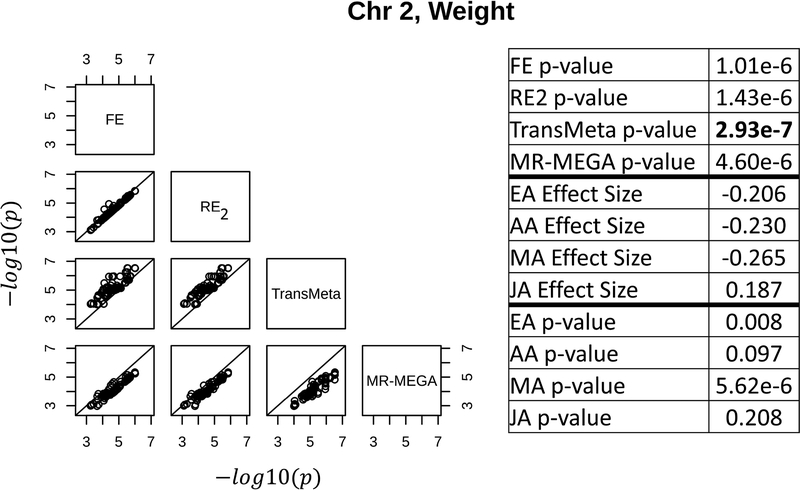
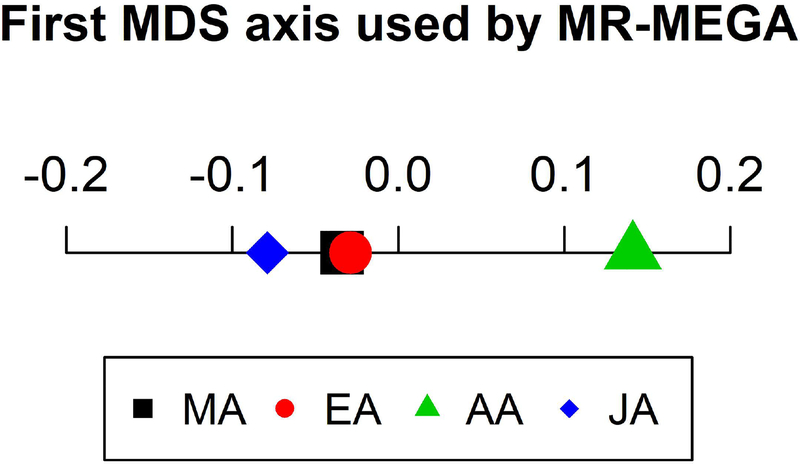
Genome-wide association studies (GWAS) have been used to establish thousands of genetic associations across numerous phenotypes. To improve the power of GWAS and generalize associations across ethnic groups, transethnic meta-analysis methods are used to combine the results of several GWAS from diverse ancestries. The goal of this study is to identify genetic associations for eight quantitative metabolic syndrome (MetS) traits through a meta-analysis across four ethnic groups. Traits were measured in the GENetics of Noninsulin dependent Diabetes Mellitus (GENNID) Study which consists of African-American (families = 73, individuals = 288), European-American (families = 79, individuals = 519), Japanese-American (families = 17, individuals = 132), and Mexican-American (families = 113, individuals = 610) samples. Genome-wide association results from these four ethnic groups were combined using four meta-analysis methods: fixed effects, random effects, TransMeta, and MR-MEGA. We provide an empirical comparison of the four meta-analysis methods from the GENNID results, discuss which types of loci (characterized by allelic heterogeneity) appear to be better detected by each of the four meta-analysis methods in the GENNID Study, and validate our results using previous genetic discoveries. We specifically compare the two transethnic methods, TransMeta and MR-MEGA, and discuss how each transethnic method's framework relates to the types of loci best detected by each method.

Keywords: allelic heterogeneity; genome-wide association; meta-analysis; metabolic syndrome; transethnic.


Figures

Figure 1:
Figure 1:
QQplots of −log10(pvalue) for FE, RE, TransMeta, and MR-MEGA meta-analysis methods. The expected line is shown in black and confidence bands are shown in dashed black lines. All 8 phenotypes used are shown using different colored lines (legend). QQplots were generated using a genome-wide LD pruned set of 48,624 SNPs.
Figure 2:
Figure 2:
Venn Diagram of the 78 suggestively significant (pvalue ≤ 1e − 6) SNPs found by the four meta-analysis methods: FE (black), RE2 (red), TransMeta (blue), and MR-MEGA (green).
Figure 3:
Figure 3:
The left figure shows pairwise scatterplots of the −log10(pvalue) for all SNPs with pvalue ≤ 1e − 4 by at least one meta-analysis method for a locus at 27,598,097 – 28,774,081 bp on chromosome 2 associated with triglycerides (11 SNPs total). RE2 is better able to detect this locus at the genome-wide significance threshold of 5e-8 than the trans-ethnic methods (TransMeta, MR-MEGA). The right table shows the summary statistics (effect sizes and p-values) from each ethnic group for the SNP with the lowest p-value by any of the four meta-analysis methods. The meta-analysis p-values for each method are also shown for the leading SNP, with the lowest meta-analysis p-value (by RE2) in bold. Base pair coordinates are in Build 37. See Supplemental Figure S1 and Supplemental Table D.1 for more information about this locus.
Figure 4:
Figure 4:
The left figure shows pairwise scatterplots of the −log10(pvalue) for all SNPs with pvalue ≤ 1e − 4 by at least one meta-analysis method for a locus at 38,030,933 – 38,097,313 bp on chromosome 19 associated with triglycerides (14 SNPs total). MR-MEGA is better able to detect the locus at the suggestive threshold of 1e-6 than TransMeta. The right table shows the summary statistics (effect sizes and p-values) from each ethnic group for the SNP with the lowest p-value by any of the four meta-analysis methods. The meta-analysis p-values for each method are also shown for this leading SNP, with the lowest meta-analysis p-value (by MR-MEGA) in bold. Base pair coordinates are in Build 37. See Supplemental Figure S2 and Supplemental Table D.1 for more information about this locus.
Figure 5:
Figure 5:
The left figure shows pairwise scatterplots of the −log10(pvalue) for all SNPs with pvalue ≤ 1e − 4 by at least one meta-analysis method for a locus at 161,435,255 – 161,916,409 bp on chromosome 2 associated with weight (107 SNPs total). TransMeta is better able to detect the locus at the suggestive threshold of 1e-6 than MR-MEGA. The right table shows the summary statistics (effect sizes and p-values) from each ethnic group for the SNP with the lowest p-value by any of the four meta-analysis methods. The meta-analysis p-values for each method are also shown for this leading SNP, with the lowest meta-analysis p-value (by TransMeta) in bold. Base pair coordinates are in Build 37. See Supplemental Figure S3 and Supplemental Table D.1 for more information about this locus.
Figure 6:
Figure 6:
First MDS axis of the genetic distance matrix calculated by MR-MEGA. The axis separates the African-American group from the other three groups, allowing MR-MEGA to better detect loci driven by African-American effects.

References

    1. Abecasis GR, Cherny SS, Cookson WO, & Cardon LR (2001). Merlin—rapid analysis of dense genetic maps using sparse gene flow trees. Nature Genetics, 30(1), 97–101. 10.1038/ng786 - DOI - PubMed
    1. Bradburd GS, Ralph PL, & Coop GM (2013). Disentangling the Effects of Geographic and Ecological Isolation on Genetic Differentiation. Evolution, 67(11), 3258–3273. 10.1111/evo.12193 - DOI - PMC - PubMed
    1. Chang CC, Chow CC, Tellier LC, Vattikuti S, Purcell SM, & Lee JJ (2015). Second-generation PLINK: rising to the challenge of larger and richer datasets. GigaScience, 4(1), 7 10.1186/s13742-015-0047-8 - DOI - PMC - PubMed
    1. Coram MA, Duan Q, Hoffmann TJ, Thornton T, Knowles JW, Johnson NA, … Tang H (2013). Genome-wide Characterization of Shared and Distinct Genetic Components that Influence Blood Lipid Levels in Ethnically Diverse Human Populations. The American Journal of Human Genetics, 92(6), 904–916. 10.1016/j.ajhg.2013.04.025 - DOI - PMC - PubMed
    1. Das S, Forer L, Schönherr S, Sidore C, Locke AE, Kwong A, … Fuchsberger C (2016). Next-generation genotype imputation service and methods. Nature Genetics, 48(10), 1284–1287. 10.1038/ng.3656 - DOI - PMC - PubMed

Publication types