. 2020 May;30(5):526-541.
doi: 10.1002/hipo.23169. Epub 2019 Oct 24.

Cardiorespiratory fitness predicts effective connectivity between the hippocampus and default mode network nodes in young adults

Affiliations

Cardiorespiratory fitness predicts effective connectivity between the hippocampus and default mode network nodes in young adults

Corey A Kronman et al. Hippocampus. 2020 May.

Abstract

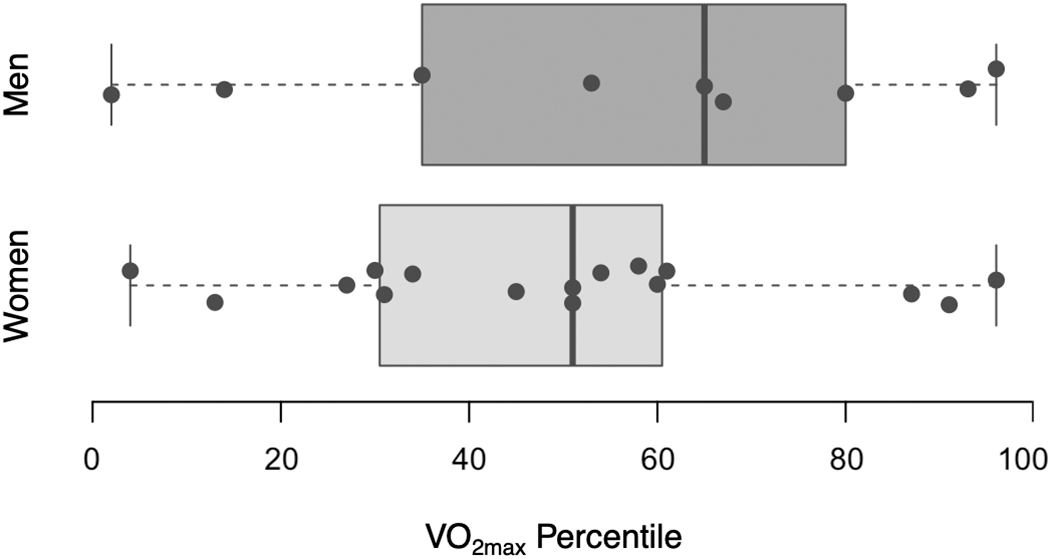
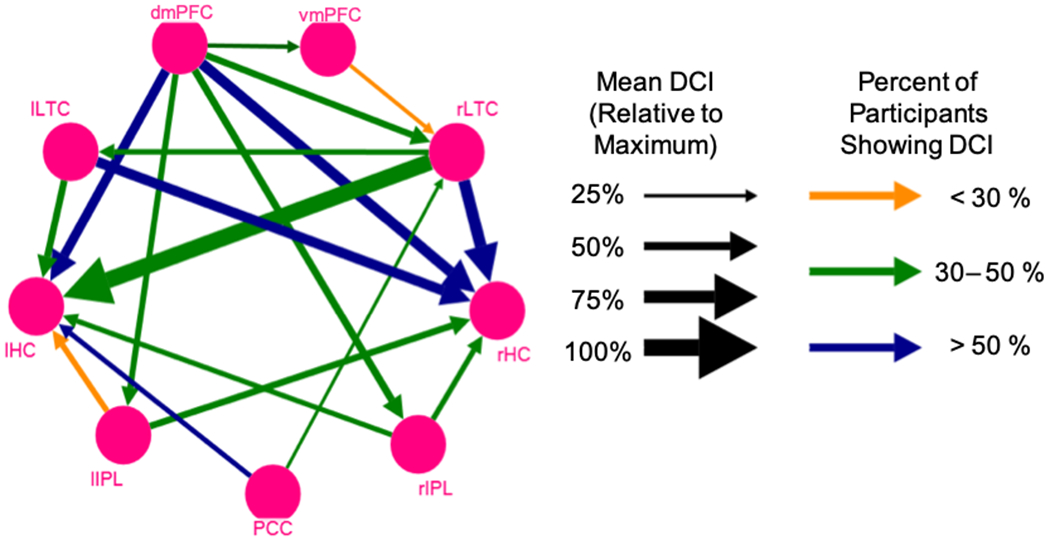
Rodent and human studies examining the relationship between aerobic exercise, brain structure, and brain function indicate that the hippocampus (HC), a brain region critical for episodic memory, demonstrates striking plasticity in response to exercise. Beyond the hippocampal memory system, human studies also indicate that aerobic exercise and cardiorespiratory fitness (CRF) are associated with individual differences in large-scale brain networks responsible for broad cognitive domains. Examining network activity in large-scale resting-state brain networks may provide a link connecting the observed relationships between aerobic exercise, hippocampal plasticity, and cognitive enhancement within broad cognitive domains. Previously, CRF has been associated with increased functional connectivity of the default mode network (DMN), specifically in older adults. However, how CRF relates to the magnitude and directionality of connectivity, or effective connectivity, between the HC and other DMN nodes remains unknown. We used resting-state fMRI and conditional Granger causality analysis (CGCA) to test the hypothesis that CRF positively predicts effective connectivity between the HC and other DMN nodes in healthy young adults. Twenty-six participants (ages 18-35 years) underwent a treadmill test to determine CRF by estimating its primary determinant, maximal oxygen uptake (V. O2max ), and a 10-min resting-state fMRI scan to examine DMN effective connectivity. We identified the DMN using group independent component analysis and examined effective connectivity between nodes using CGCA. Linear regression analyses demonstrated that CRF significantly predicts causal influence from the HC to the ventromedial prefrontal cortex, posterior cingulate cortex, and lateral temporal cortex and to the HC from the dorsomedial prefrontal cortex. The observed relationship between CRF and hippocampal effective connectivity provides a link between the rodent literature, which demonstrates a relationship between aerobic exercise and hippocampal plasticity, and the human literature, which demonstrates a relationship between aerobic exercise and CRF and the enhancement of broad cognitive domains including, but not limited to, memory.

Keywords: cardiorespiratory fitness; connectivity; exercise; hippocampus; resting-state fMRI.


Figures

Figure 1:
Figure 1:. Distribution of Maximal Oxygen Uptake Percentile by Sex
This figure displays the distribution of maximal oxygen uptake (V˙O2max) percentiles, separated out by sex, for the 25 young, healthy participants included in this study. Dots within boxplots represent individual participants. Participants’ V˙O2max percentiles ranged from the 2nd percentile to the 96th percentile for age and sex. V˙O2max percentile did not differ significantly by sex (p = 0.31) or handedness (p = 0.42), as determined by paired 2-tailed t-test.
Figure 2:
Figure 2:. The Default Mode Network
This figure displays the group average default mode network (DMN) functional connectivity in Montreal Neurological Institute (MNI) space at 6 slices through the horizontal plane. Among the regions of interest visible in the view are the dorsomedial prefrontal cortex (dmPFC), ventromedial prefrontal cortex (vmPFC), posterior cingulate cortex (PCC), right and left inferior parietal lobule (rIPL and lIPL, respectively), and right lateral temporal cortex (LTC). Regions of interest that were found to be statistically significant, but are not visible in the selected slices, are the bilateral hippocampus and left lateral temporal cortex.
Figure 3.
Figure 3.. Mean Differences of Causal Influence
This figure displays the average difference of causal influence (DCI) map across all participants, with a minimum threshold of 25% causal influence relative to the maximum DCI. Each vertex represents one DMN region of interest (ROI), as labeled. The arrows represent the directionality of DCI from one ROI to another ROI. Arrow thickness defines the relative DCI, where the thickest arrow (from rLTC to lHC) is the DCI with the maximum magnitude. Arrow shade indicates whether less than 30% (orange), 30% - 50% (green), or greater than 50% (blue) of total participants exhibited a significant DCI. A maximum of 60% of total participants displayed a significant DCI between any pair of ROIs.
Figure 4.
Figure 4.. Linear Regression Models
This figure displays the linear regression models where the maximal oxygen uptake (V˙O2max) percentile significantly predicts the difference of causal influence (DCI) (p < 0.05). The models are grouped by DCI to a region of interest (ROI). Solid lines represent the linear regression model. Dashed lines represent the standard error of the linear regression model in each figure of the same color. Each individual point represents the DCI between the two indicated ROIs for an individual participant. A positive DCI indicates forward DCI from the ROI given in the legend to the ROI given in the title. Negative DCI indicates causality in the reverse direction indicated by the figure title and legend. A DCI of zero indicates the inflection point where the causal influence in both directions is equivalent. Figures A, B, C, D, E, and F display the linear regression model for DCI from the ROIs labeled by each legend to the left hippocampus (lHC), right hippocampus (rHC), posterior cingulate cortex (PCC), ventromedial prefrontal cortex (vmPFC), left lateral temporal cortex (lLTC), and right lateral temporal cortex (rLTC), respectively. The mathematical equation for each linear regression model is given in Supplementary Table S1.

References

    1. American College of Sports Medicine., Thompson WR, Gordon NF, & Pescatello LS (2010). ACSM’s guidelines for exercise testing and prescription. Philadelphia: Wolters Kluwer/Lippincott Williams & Wilkins; /z-wcorg/.
    1. Andrews-Hanna JR (2012). The Brain’s Default Network and Its Adaptive Role in Internal Mentation. The Neuroscientist, 18(3), 251–270. 10.1177/1073858411403316 - DOI - PMC - PubMed
    1. Andrews-Hanna JR, Snyder AZ, Vincent JL, Lustig C, Head D, Raichle ME, & Buckner RL (2007). Disruption of large-scale brain systems in advanced aging. Neuron, 56(5), 924–935. 10.1016/j.neuron.2007.10.038 - DOI - PMC - PubMed
    1. Avila JJ, Kim SK, & Massett MP (2017). Differences in Exercise Capacity and Responses to Training in 24 Inbred Mouse Strains. Frontiers in Physiology, 8 10.3389/fphys.2017.00974 - DOI - PMC - PubMed
    1. Barnes DE, Yaffe K, Satariano WA, & Tager IB (2003). A longitudinal study of cardiorespiratory fitness and cognitive function in healthy older adults. Journal of the American Geriatrics Society, 51(4), 459–465. - PubMed

Publication types