. 2019 Nov;14(6):1034-1061.
doi: 10.1177/1745691619866447. Epub 2019 Oct 24.

The Wiring of Intelligence

Affiliations

The Wiring of Intelligence

Alexander O Savi et al. Perspect Psychol Sci. 2019 Nov.

Abstract

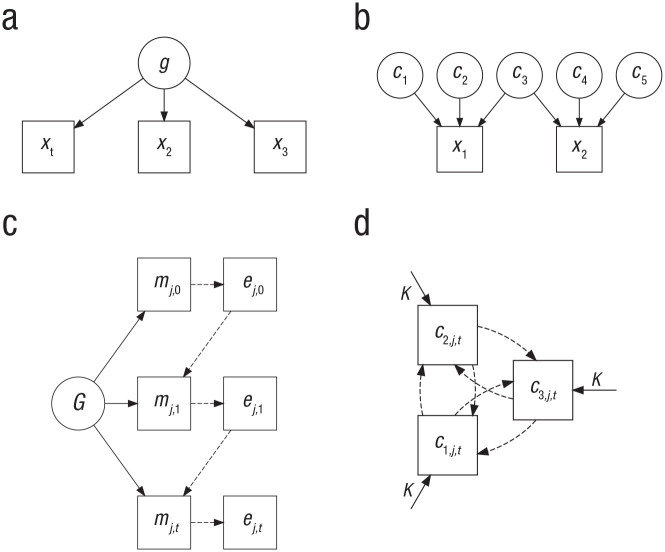
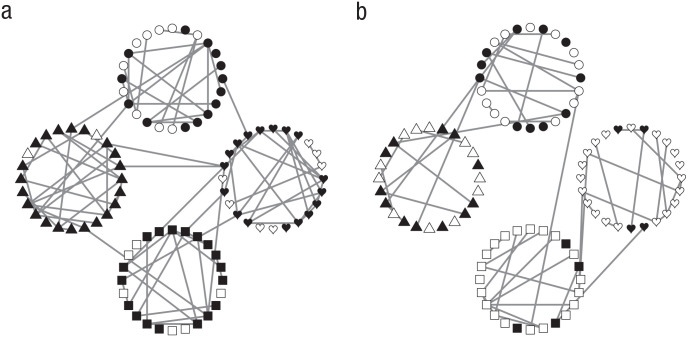
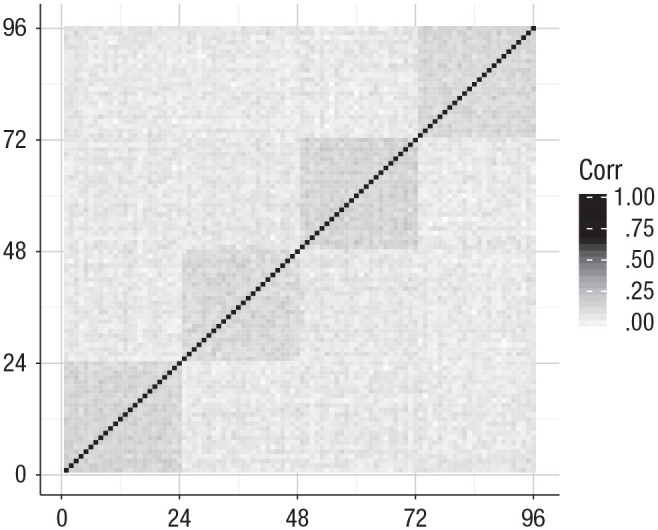
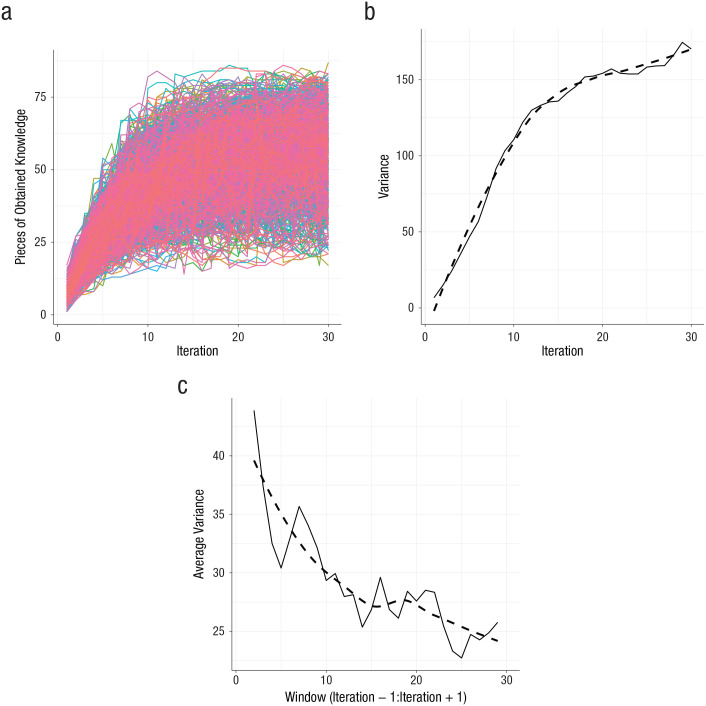
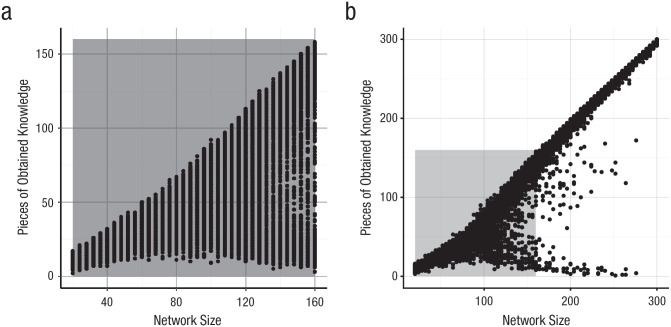
The positive manifold of intelligence has fascinated generations of scholars in human ability. In the past century, various formal explanations have been proposed, including the dominant g factor, the revived sampling theory, and the recent multiplier effect model and mutualism model. In this article, we propose a novel idiographic explanation. We formally conceptualize intelligence as evolving networks in which new facts and procedures are wired together during development. The static model, an extension of the Fortuin-Kasteleyn model, provides a parsimonious explanation of the positive manifold and intelligence's hierarchical factor structure. We show how it can explain the Matthew effect across developmental stages. Finally, we introduce a method for studying growth dynamics. Our truly idiographic approach offers a new view on a century-old construct and ultimately allows the fields of human ability and human learning to coalesce.

Keywords: child development; cognition; idiographic science; individual differences; intelligence; network model; quantitative methodology.


Conflict of interest statement

Declaration of Conflicting Interests: The author(s) declared that there were no conflicts of interest with respect to the authorship or the publication of this article.

Figures

Fig. 1.
Fig. 1.
Four explanations of the positive manifold (simplified). Circles represent unobserved entities, whereas boxes represent observed entities. Dashed lines represent relations that have an influence over time. g = general intelligence, x = cognitive test, c = basic cognitive process (of person j at time t), G = genetic endowment, m = measured IQ of person j at time t, e = environment of person j at time t, K = genetic and environmental factors.
Fig. 2.
Fig. 2.
Pólya urn demonstrations of (a) the Matthew effect and (b) the compensation effect. Starting with an urn that contains a white marble and a black marble, in each trial the drawn marble is replaced with two or three marbles of the same color, depending on the desired effect. The figures show the development of the proportion of marbles for 50 independent urns.
Fig. 3.
Fig. 3.
Heritability estimates of 200 identical twins in Pólya’s urn. Initial urn configurations are sampled such that each urn contains black and white marbles. The standard growth mechanism is used for all twins: One marble is randomly drawn from the urn and replaced by two marbles of the same color. This process is repeated until the urn contains 800 marbles. At each developmental step (x-axis), the heritability is calculated (y-axis) as the squared correlation between the proportions of white marbles in current and past developmental steps of a twin pair, averaged over all twin pairs. This process is repeated for different initial urn sizes (line type and line color).
Fig. 4.
Fig. 4.
Two instances of a Pólya’s urn network. Both networks started with a single black node and a single white node (t = 0). In addition, the networks share an identical growth mechanism: A new node is randomly connected to one of the existing nodes and copies its color. The numbers show the time points at which the nodes were added.
Fig. 5.
Fig. 5.
Two instances of the Fortuin and Kasteleyn (1972) model. The cognitive networks of (a) Cornelius and (b) Pete consist of 96 nodes, equally distributed across four domains (represented by nodes of different shapes). Cornelius has 25 pieces of obtained knowledge (white nodes), and Pete has 65 pieces of obtained knowledge. Networks were generated with θW=.07, θB=.005, and µ =.03; parameters are introduced in the text of the article.
Fig. 6.
Fig. 6.
Heat map of the correlational structure of the nodes of the Fortuin and Kasteleyn (1972) model. As analogues to Spearman’s very first observation of the positive manifold in the correlational structure of his cognitive tests, the exclusively positive patches illustrate the positive manifold as a constraining property of the Fortuin–Kasteleyn model. In addition, the hierarchical structure of intelligence is clearly reflected in the block structure. Networks were generated with θW=.07, θB=.005, and µ =.03. Corr = correlation.
Fig. 7.
Fig. 7.
The Matthew effect when the Gibbs sampler—used to sample a network from the model—is decelerated. The graph in (a) shows the fan spread that characterizes the Matthew effect. The graph in (b) shows the variance in obtained pieces of knowledge across networks. The graph in (c) shows the average variance in obtained pieces of knowledge across subsequent states of individual networks. The dashed line indicates the smoothed variance; the solid line indicates the actual variance.
Fig. 8.
Fig. 8.
The Matthew effect and bifurcation in developing networks. Points represent the number of obtained pieces of knowledge (y-axis) across networks of different sizes (x-axis). Each point represents an independent observation. The gray rectangles show the parts of the figures that overlap.
Fig. 9.
Fig. 9.
Heat maps of the correlational structure of cognitive networks with 40, 80, 120, or 160 nodes (note the scale of each heat map) across four different domains. Each heat map is based on 1,000 networks. The exclusively positive patches illustrate the positive manifold, and the block structures illustrate the hierarchical structure. With networks increasing in size, the positive manifold increases too. Corr = correlation.

Update of

References

    1. Ackerman P. L., Lohman D. F. (2003). Education and g. In Nyborg H. (Ed.), The scientific study of general intelligence (pp. 275–292). Amsterdam, the Netherlands: Elsevier BV.
    1. Bartholomew D. J. (2004). Measuring intelligence. New York, NY: Cambridge University Press.
    1. Bartholomew D. J., Allerhand M., Deary I. J. (2013). Measuring mental capacity: Thomsons bonds model and Spearmans g-model compared. Intelligence, 41, 222–233. doi:10.1016/j.intell.2013.03.007 - DOI
    1. Bartholomew D. J., Deary I. J., Lawn M. (2009). The origin of factor scores: Spearman, Thomson and Bartlett. British Journal of Mathematical and Statistical Psychology, 62, 569–582. doi:10.1348/000711008x365676 - DOI - PubMed
    1. Bartlett F. C. (1932). Remembering: A study in experimental and social psychology. Retrieved from https://archive.org/details/rememberingstudy00bart

Publication types