. 2019 Dec;33(12):14147-14158.
doi: 10.1096/fj.201900786R. Epub 2019 Oct 26.

Endothelial cell-specific redox gene modulation inhibits angiogenesis but promotes B16F0 tumor growth in mice

Affiliations

Endothelial cell-specific redox gene modulation inhibits angiogenesis but promotes B16F0 tumor growth in mice

Yoshimitsu Yura et al. FASEB J. 2019 Dec.

Abstract

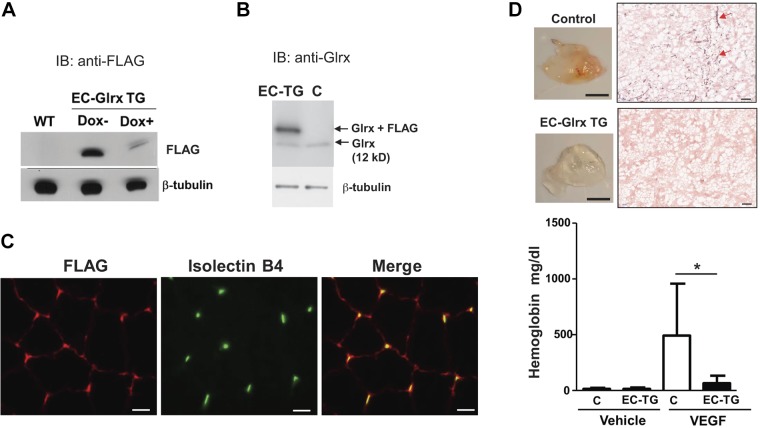
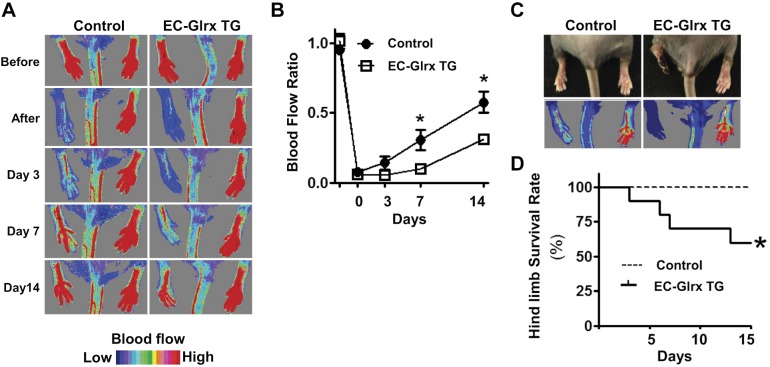
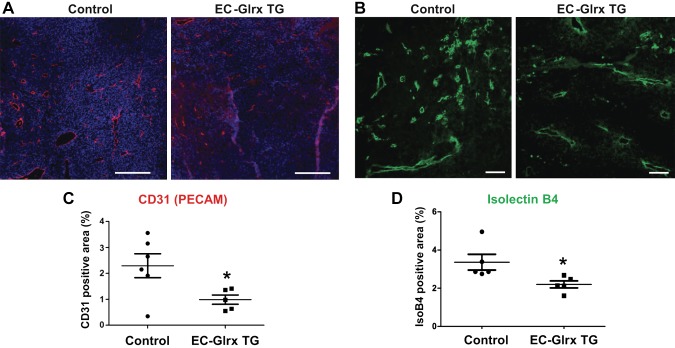
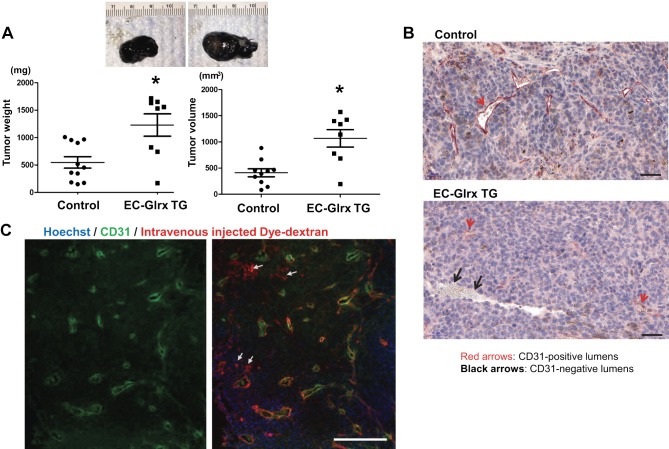
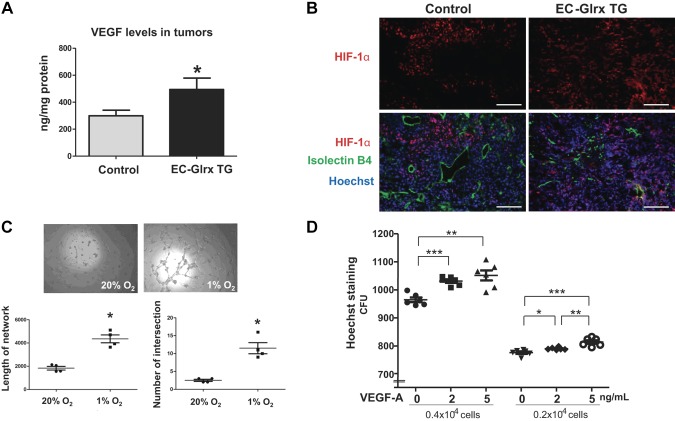
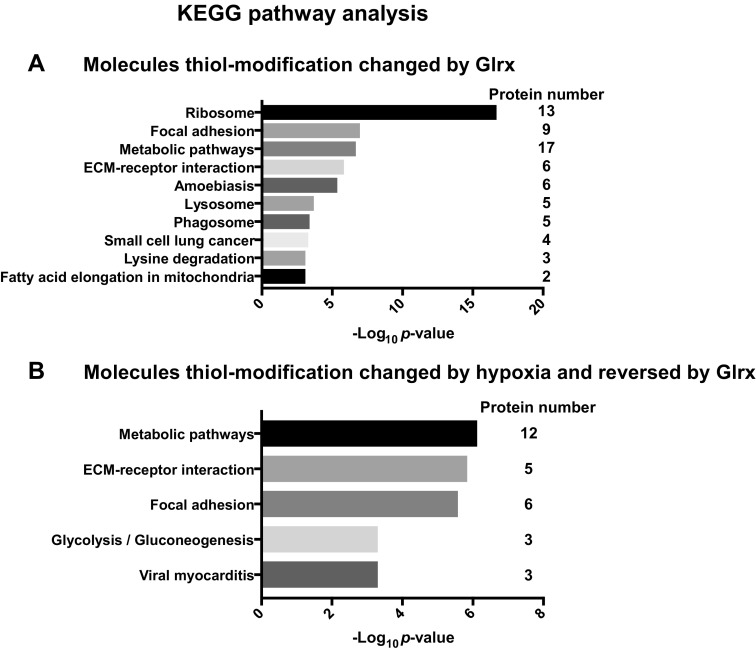
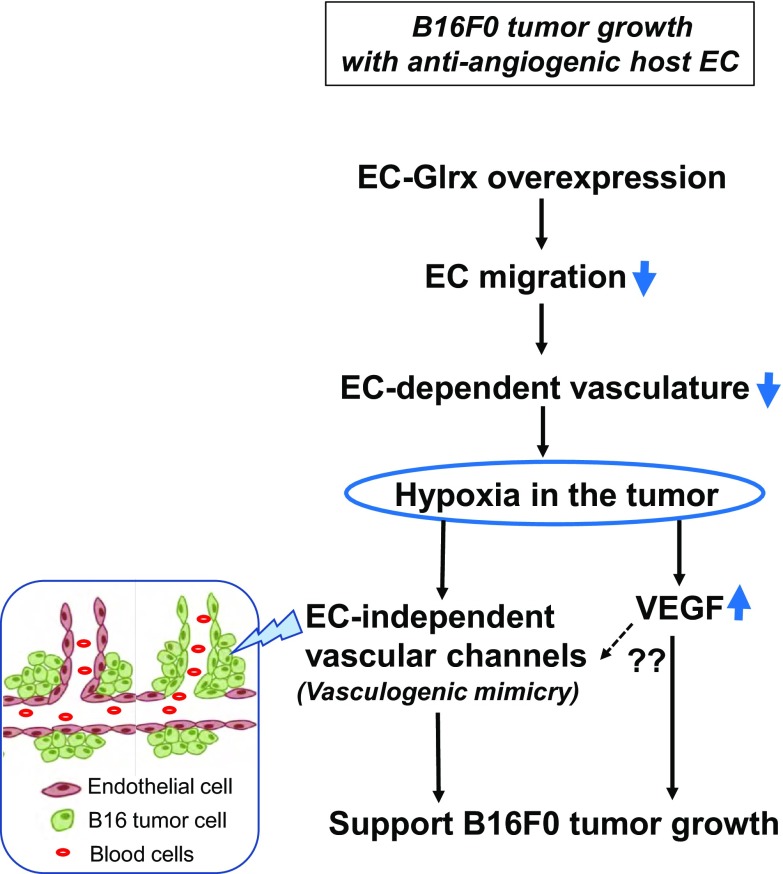
Glutaredoxin-1 (Glrx) is a small cytosolic enzyme that removes S-glutathionylation, glutathione adducts of protein cysteine residues, thus modulating redox signaling and gene transcription. Although Glrx up-regulation prevented endothelial cell (EC) migration and global Glrx transgenic mice had impaired ischemic vascularization, the effects of cell-specific Glrx overexpression remained unknown. Here, we examined the role of EC-specific Glrx up-regulation in distinct models of angiogenesis; namely, hind limb ischemia and tumor angiogenesis. EC-specific Glrx transgenic (EC-Glrx TG) overexpression in mice significantly impaired EC migration in Matrigel implants and hind limb revascularization after femoral artery ligation. Additionally, ECs migrated less into subcutaneously implanted B16F0 melanoma tumors as assessed by decreased staining of EC markers. Despite reduced angiogenesis, EC-Glrx TG mice unexpectedly developed larger tumors compared with control mice. EC-Glrx TG mice showed higher levels of VEGF-A in the tumors, indicating hypoxia, which may stimulate tumor cells to form vascular channels without EC, referred to as vasculogenic mimicry. These data suggest that impaired ischemic vascularization does not necessarily associate with suppression of tumor growth, and that antiangiogenic therapies may be ineffective for melanoma tumors because of their ability to implement vasculogenic mimicry during hypoxia.-Yura, Y., Chong, B. S. H., Johnson, R. D., Watanabe, Y., Tsukahara, Y., Ferran, B., Murdoch, C. E., Behring, J. B., McComb, M. E., Costello, C. E., Janssen-Heininger, Y. M. W., Cohen, R. A., Bachschmid, M. M., Matsui, R. Endothelial cell-specific redox gene modulation inhibits angiogenesis but promotes B16F0 tumor growth in mice.

Keywords: S-glutathionylation; glutaredoxin; melanoma; vascular; vasculogenic mimicry.


Conflict of interest statement

The authors thank Dr. Nader Rahimi for advice, and Dominique Croteau for editing the manuscript (both from the Boston University School of Medicine). The authors also thank Professor Stephen Chlopicki and his laboratory members (Jagiellonian Centre for Experimental Therapeutics, Krakow, Poland) for helpful advice, and the Analytical Instrumentation Core at Boston University Medical Campus for their service. This research was supported by U.S. National Institutes of Health (NIH)/National Heart, Lung, and Blood Institute (NHLBI) Grant R01 HL133013 (to R.M.), postdoctoral training Grant T32 HL70024 (to B.F.), R37 HL104017 (to R.A.C.), and contract HHSN268201000031C (to C.E.C.); NIH/National Institute on Aging Grant R03 AG051857 (to R.M.); NIH/National Center for Advancing Translational Sciences Grant 1UL1 TR001430 (to M.M.B. and R.M.); NIH/National Institute of Diabetes and Digestive and Kidney Diseases Grant R01 DK103750 (to M.M.B.); and American Heart Association Grant 16GRNT27660006 (to M.M.B.). The authors declare no conflicts of interest.

Figures

Figure 1
Figure 1
EC-specific Glrx overexpression impaired EC migration in vivo. A) Protein extracts from lungs in EC-Glrx TG mice with or without DOX were blotted and probed with antibodies directed against FLAG. B) Lung proteins from the control and EC-Glrx TG mice without DOX were blotted with the anti-Glrx antibody; the upper band indicates exogenous FLAG-Glrx, whereas the lower band indicates endogenous Glrx. C) FLAG-Glrx (red) colocalizes with the EC marker isolectin B4 (green) in cross sections of the gastrocnemius muscle. D) EC migration in vivo assay. Hemoglobin content in Matrigel plugs implanted subcutaneously in EC-Glrx TG (EC-TG) and control mice for 2 wk with or without VEGF (n = 8). *P < 0.05. The photos show VEGF-containing Matrigel plugs (scale bars, 5 mm) and immunohistochemistry for CD31 (red arrows; scale bars, 100 μm) in the plugs from control (C) and EC-Glrx TG mice.
Figure 2
Figure 2
EC-specific Glrx overexpression impaired ischemic angiogenesis in mice. A) Blood flow after hind limb ischemia surgery, assessed by Laser Doppler. Representative photos show the blood flow recovery. B) EC-Glrx TG mice were compared with VEcad-tTA (single TG) or wild-type mice as control with quantitative serial assessment, n = 8 each. C) Representative photos show necrotic foot observed with EC-Glrx TG mice. D) Limb survival curve indicates that EC-Glrx TG mice had a higher incidence of necrotic legs. *P < 0.05.
Figure 3
Figure 3
EC-specific Glrx overexpression impaired tumor angiogenesis. A) Vascularization of B16F0 tumors determined by immunofluorescent staining for CD31. Representative images of tumors with CD31 (red) and Hoechst 33342 (blue) from control and EC-Glrx TG tumors (scale bar, 500 μm). B) Representative photos to show isolectin B4 staining (green) in B16F0 tumors from control and EC-Glrx TG mice (scale bar, 200 μm). C) Relative CD31-positive area quantification from tumor section in A (n = 6). D) Relative isolectin B4–positive area quantification from tumor section from B (n = 5).
Figure 4
Figure 4
EC-specific Glrx overexpression promoted tumor growth and EC-independent tube formation in B16F0 tumors. A) B16F0 tumors from control and EC-Glrx TG mice, extracted after 2 wk of inoculation. Representative photos of tumors (top), and weight and volume assessments (n = 8–12). *P < 0.05. B) CD31 staining on the paraffin section of B16F0 tumors demonstrates EC-lining lumina (CD31-positive cells shown in red arrows) as well as blood cell–containing lumen without CD31 staining (shown by black arrows, mostly found in EC-Glrx TG tumors). Photos are representative sections of tumors from EC-Glrx TG and control mice (scale bars, 50 μm). C) Blood flow in a tumor without endothelium in Texas Red-labeled Dextran-injected EC-Glrx TG mouse. CD31 from tumor sections were stained in green (left). The merged photo (right) indicates dye-conjugated dextran in blood flow (red), CD31 in EC (green), and nuclear staining Hoechst 33342 (blue). White arrows point to Dextran-positive CD31-negative areas (scale bar, 500 μm).
Figure 5
Figure 5
Hypoxia may stimulate B16F0 tumor growth and EC-independent vessel formation. A) VEGF levels in the tumor assessed by ELISA. *P < 0.05. B) Immunoflurescence for HIF-1a (red), isolectin B4 (green), and Hoechst 33342 (blue) of B16 tumors (scale bars, 100 μm). C) Capillary tube formation of B16F0 cells on Matrigel assessed <1 or 20% O2. Intersections were determined by recording the number of connections between 2 or more capillary-like structures per field. The length of the tube was quantified by the sum of total tube length per field. Images of B16F0 cells from both 20 and 1% O2 show that hypoxia (6 h) increased tube formation (n = 4 wells/condition). *P < 0.05. Similar results were observed at least in 3 different experiments. D) Two different density of cells were tested to study the effect of VEGF (2–5 ng/ml) on B16F0 cell proliferation. Hoechst 33342 nuclear staining was assessed after 24 h (6 wells each). *P < 0.05, **P < 0.01, ***P < 0.001. The representative data are shown from similar experiments repeated 3 times.
Figure 6
Figure 6
S-glutathionylated proteins regulated by Glrx in EC. KEGG pathway analysis of reversibly thiol-modified proteins using WebGestalt. Adenoviral Glrx or LacZ overexpressing HCMVECs were exposed to hypoxia for 24 h, and proteins were labeled as described in Materials and Methods. All proteins in which thiol modifications were reversed by Glrx overexpression (cutoff: 1.3-fold) are summarized in Supplemental Table S1. The pathways exhibiting significant changes in normoxia (A) or hypoxia (B) are shown. Table 1 lists the proteins by pathway regulated through Glrx in hypoxia.
Figure 7
Figure 7
Hypothetical scheme for the mechanism of B16F0 growth in EC-Glrx TG mice.

References

    1. Sundaresan M., Yu Z. X., Ferrans V. J., Irani K., Finkel T. (1995) Requirement for generation of H2O2 for platelet-derived growth factor signal transduction. Science 270, 296–299 - PubMed
    1. Janssen-Heininger Y. M. W., Mossman B. T., Heintz N. H., Forman H. J., Kalyanaraman B., Finkel T., Stamler J. S., Rhee S. G., van der Vliet A. (2008) Redox-based regulation of signal transduction: principles, pitfalls, and promises. Free Radic. Biol. Med. 45, 1–17 - PMC - PubMed
    1. Schieber M., Chandel N. S. (2014) ROS function in redox signaling and oxidative stress. Curr. Biol. 24, R453–R462 - PMC - PubMed
    1. Pimentel D., Haeussler D. J., Matsui R., Burgoyne J. R., Cohen R. A., Bachschmid M. M. (2012) Regulation of cell physiology and pathology by protein S-glutathionylation: lessons learned from the cardiovascular system. Antioxid. Redox Signal. 16, 524–542 - PMC - PubMed
    1. Dalle-Donne I., Rossi R., Colombo G., Giustarini D., Milzani A. (2009) Protein S-glutathionylation: a regulatory device from bacteria to humans. Trends Biochem. Sci. 34, 85–96 - PubMed

Publication types