Review
. 2019 Oct 23;104(2):205-226.
doi: 10.1016/j.neuron.2019.07.016.

Melanopsin and the Intrinsically Photosensitive Retinal Ganglion Cells: Biophysics to Behavior

Affiliations
Review

Melanopsin and the Intrinsically Photosensitive Retinal Ganglion Cells: Biophysics to Behavior

Michael Tri H Do. Neuron. .

Abstract

The mammalian visual system encodes information over a remarkable breadth of spatiotemporal scales and light intensities. This performance originates with its complement of photoreceptors: the classic rods and cones, as well as the intrinsically photosensitive retinal ganglion cells (ipRGCs). IpRGCs capture light with a G-protein-coupled receptor called melanopsin, depolarize like photoreceptors of invertebrates such as Drosophila, discharge electrical spikes, and innervate dozens of brain areas to influence physiology, behavior, perception, and mood. Several visual responses rely on melanopsin to be sustained and maximal. Some require ipRGCs to occur at all. IpRGCs fulfill their roles using mechanisms that include an unusual conformation of the melanopsin protein, an extraordinarily slow phototransduction cascade, divisions of labor even among cells of a morphological type, and unorthodox configurations of circuitry. The study of ipRGCs has yielded insight into general topics that include photoreceptor evolution, cellular diversity, and the steps from biophysical mechanisms to behavior.

Keywords: circadian rhythms; intrinsically photosensitive retinal ganglion cell; melanopsin; membrane excitability; opsin; phototransduction; pupillary reflex; retina; signal transduction; sleep.


Conflict of interest statement

DECLARATION OF INTERESTS

The author is affiliated with the Center for Brain Science (Harvard University), the Division of Sleep Medicine (Brigham and Women’s Hospital, Harvard Medical School), and the Broad Institute of MIT and Harvard. He declares no competing interests.

Figures

Figure 1.
Figure 1.. Overview of the retina and ipRGCs.
(A) A highly simplified schematic of the retina in cross-section, oriented with the inner aspect (nearer the center of the eye) down. The outer photoreceptors (i.e., rods/cones) drive bipolar cells (BCs). In the inner plexiform layer (IPL), BCs synapse with retinal ganglion cells (RGCs). Left: ON circuitry. Rods (top) drive rod BCs, whose signals pass through amacrine cells (ACs) to cone BCs. In the inner IPL, ON cone BCs convey signals to ON RGCs. ON RGCs show greater depolarization when light intensity increases. Center, OFF circuitry. In the outer IPL, OFF cone BCs provide synaptic input to OFF RGCs. OFF RGCs show greater depolarization when light intensity decreases. Right: a sample of circuits for outer- and inner-stratifying ipRGCs, which are both ON. ON cone BCs make ectopic synapses with the former and conventional synapses with the latter. Rod pathways also drive ipRGCs. IpRGCs make chemical and electrical synapses with ACs (not shown). (B) En face view of mouse M1 ipRGCs that were revealed by melanopsin immunolabeling and traced (Berson et al., 2010). Asterisks mark cells with somata displaced from the RGC layer to above the IPL. (C) A sample of ipRGC influences.
Figure 2.
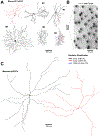
Figure 2.. A comparison of mouse and macaque ipRGCs.
(A) The six types of ipRGC recognized in the mouse retina. Black and red dendrites are those that stratify in the inner (ON) and outer (OFF) IPL, respectively, while blue dendrites are those that visit the outer IPL before returning the inner IPL (Quattrochi et al., 2018). (B) The outer photoreceptor mosaic of the mouse, to scale with the ipRGCs in (A) on the left and expanded on the right. Rods are small and numerous. Cones are stained (Jeon et al., 1998). (C) Inner- and outer-stratifying ipRGCs of the macaque peripheral retina (Liao et al., 2016). The outer-stratifying ipRGCs tend to have their somata displaced from the ganglion cell layer to the opposite side of the IPL. Same scale as A.
Figure 3.
Figure 3.. Major brain targets of mouse ipRGCs.
A sample of ipRGC brain targets is depicted in a quasi-sagittal schematic of the mouse brain. Below is a plot of innervation densities across ipRGC types, drawn after Berson and colleagues (Quattrochi et al., 2018) and incorporating additional information (Ecker et al., 2010; Hattar et al., 2006; Huang et al., 2019; Morin and Studholme, 2014; Zhao et al., 2014). Each blue dot indicates the approximate density of innervation by its size, a white dot indicates undetectable innervation, and lack of a dot indicates an absence of information. M5s and M6s are pooled because their projections were examined together for technical reasons. Abbreviations: AH, anterior hypothalamus; BST, bed nucleus of the stria terminalis; dLGN, dorsal lateral geniculate nucleus; IGL, intergeniculate leaflet; LH, lateral hypothalamus; MA, medial amygdala; OPN, olivary pretectal nucleus (with shell, s, and core, c, regions); PA, preoptic area, which includes the VLPO (ventrolateral preoptic area); PAG, periaqueductal gray; PHb, perihabenular zone; pSON, peri-supraoptic nucleus; SC, superior colliculus; SCN, suprachiasmatic nucleus; sPa, subparaventricular zone; and vLGN, ventral lateral geniculate nucleus.
Figure 4.
Figure 4.. Contributions of ipRGCs and outer photoreceptors to non-image vision.
Depicted are cases for animals that are wild-type (black), have only outer photoreceptors (i.e., rods/cones) for photoreceptors (melanopsin knockout; red), or have only ipRGCs for photoreceptors (outer photoreceptor loss or inactivation; blue). Left, Without melanopsin, responses cannot reach their normal maxima in bright light. Without the outer photoreceptors, responses are insensitive but can reach their normal maxima. Right, Without melanopsin, responses are abnormally transient. Without outer photoreceptors, responses are slow but sustained. These cartoons are not meant to be interpreted quantitatively, and the abscissae are undefined because the general understanding holds across functions that operate over different irradiances and time scales.
Figure 5.
Figure 5.. Spatial, temporal, and spectral integration by mouse M1 ipRGCs.
(A) Increasing the size of a spot within the receptive field of an M1 causes the response (normalized photovoltage) to increase, up to saturation (Zhao et al., 2014). (B) Dim-flash responses of outer photoreceptors and M1s (normalized photocurrent, having the same waveform as the single-photon response). Note the 10-fold longer time base for the M1. The dashed line indicates the baseline current and the timing of the flash is shown below the curves, which are traced from electrophysiological recordings (Emanuel et al., 2017; Field and Rieke, 2002; Nikonov et al., 2006). (C) Top, Repeated presentation of the same pulse of light causes a progressive increase in firing rate due to cumulative activation of melanopsin phototransduction. Bottom, traces taken from the first (i) and sixth (vi) presentations, highlighting persistent firing in darkness. At 35 °C, as shown here, the subthreshold membrane voltage decays in subsequent darkness with an average time constant of ~2 min. No blockers of synaptic transmission. (D) Top, Mouse melanopsin is understood to have three states (R, M, and E). The peak spectral sensitivities of R and E are determined from the electrophysiological responses of M1s. Spectrophotometric measurements of purified melanopsin yielded similar values (467 and 446 nm, respectively) and gave information for M (476 nm; Matsuyama et al., 2012). Bottom, The distribution of melanopsin states as a function of wavelength, estimated from a model based on values from purified melanopsin. (E) The action spectrum of an M1 measured atop a background of broadband (white) light. The spectrum is accounted for by roughly equal fractions of melanopsin molecules activating from R and E (the action spectra of which are shown in black and red, respectively). (F) Voltage response of an M1 at room temperature (where persistent responses are extremely stable). A 50-ms flash of 440-nm light drives an initial burst of firing that is truncated by depolarization block. Adaptation returns the voltage to a range that produces firing, and firing persists in darkness until it is suppressed by a 10-s pulse of 560-nm light. Blockers of synaptic transmission included. Plots in C-F are reproduced from Emanuel and Do, 2015. (G) An explanation of the cellular response in terms of melanopsin tristability. The only state found after prolonged darkness is R. Light drives R to M, which activates the cell. M has a high degree of thermal stability. Longer wavelengths of light drive M to E (and, to a lesser extent, R), which suppresses cellular activity. A subsequent short-wavelength or broadband stimulus can initiate another cycle.
Figure 6.
Figure 6.. Irradiance encoding by mouse M1 ipRGCs.
(A) Top, The irradiance-firing (IF) relation of a “unimodal” M1. Bottom, Excerpts of voltage at the indicated points showing intrinsic depolarization block at high irradiance (iv). (B) The IF relations of different M1s, offset vertically for visualization. These relations are naturally arrayed across the irradiance axis. Scattered in the top end of the range are a few IF relations that are monotonic rather than unimodal. Intensities correspond to moonlight (a), twilight (b), and daylight (c). The shapes and positions of these relations are similar whether synaptic transmission is blocked (as is the case here) or not (Milner and Do, 2017).
Figure 7.
Figure 7.. Functional diversity of mouse ipRGCs.
(A) The receptive field of an M1 from Figure 5, replotted for comparison with the receptive fields of M2s - M6s. The responses of non-M1s decrease as larger stimuli activate increasing amounts of the inhibitory surround (drawn from Quattrochi et al., 2018; Zhao et al., 2014). (B) The melanopsin-driven, intensity-voltage relations of ipRGC types. The stimulus was a relatively brief (10 s) pulse of light (Zhao et al., 2014). Intensity-current relations can show greater differences (Schmidt and Kofuji, 2009). Blockers of synaptic transmission included. (C) Long-lasting steps of light (10 min) evoke relatively sensitive responses in M4s (Sonoda et al., 2018). Blockers of synaptic transmission included. (D) Melanopsin phototransduction increases the contrast sensitivity of M4s (black, wild-type and red, melanopsin-knockout) even at light intensities that evoke no detectable depolarization (top, compare with C). The effect of melanopsin phototransduction is even more pronounced at higher irradiance (bottom). No blockers of synaptic transmission. (E) Opposite responses to different wavelengths by M5s. Top, depolarization in ultraviolet light. Bottom, hyperpolarization in green light (Stabio et al., 2018). No blockers of synaptic transmission.

References

    1. Allen AE, Cameron MA, Brown TM, Vugler AA, and Lucas RJ (2010). Visual responses in mice lacking critical components of all known retinal phototransduction cascades. PLoS ONE 5, e15063. - PMC - PubMed
    1. Allen AE, Martial FP, and Lucas RJ (2019). Form vision from melanopsin in humans. Nature Communications 10, 2274. - PMC - PubMed
    1. Allen AE, Storchi R, Martial FP, Bedford RA, and Lucas RJ (2017). Melanopsin Contributions to the Representation of Images in the Early Visual System. Curr Biol 27, 1623–1632 e1624. - PMC - PubMed
    1. Allen AE, Storchi R, Martial FP, Petersen RS, Montemurro MA, Brown TM, and Lucas RJ (2014). Melanopsin-driven light adaptation in mouse vision. Curr Biol 24, 2481–2490. - PMC - PubMed
    1. Altimus CM, Güler AD, Alam NM, Arman AC, Prusky GT, Sampath AP, and Hattar S (2010). Rod photoreceptors drive circadian photoentrainment across a wide range of light intensities. Nature Neuroscience 13, 1107–1112. - PMC - PubMed

Publication types

LinkOut - more resources