. 2019 Oct 24;14(10):e0224201.
doi: 10.1371/journal.pone.0224201. eCollection 2019.

MANET 3.0: Hierarchy and modularity in evolving metabolic networks

Affiliations

MANET 3.0: Hierarchy and modularity in evolving metabolic networks

Fizza Mughal et al. PLoS One. .

Abstract

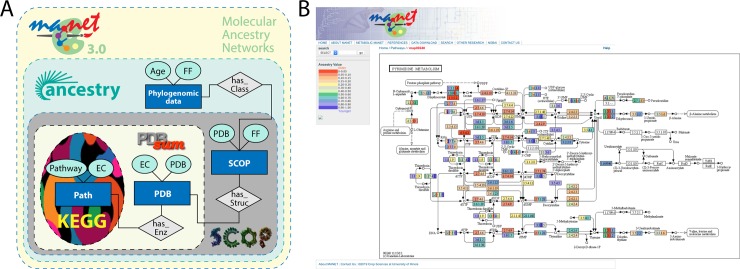
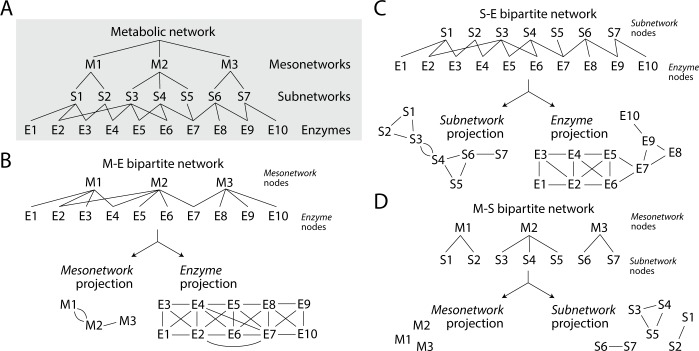
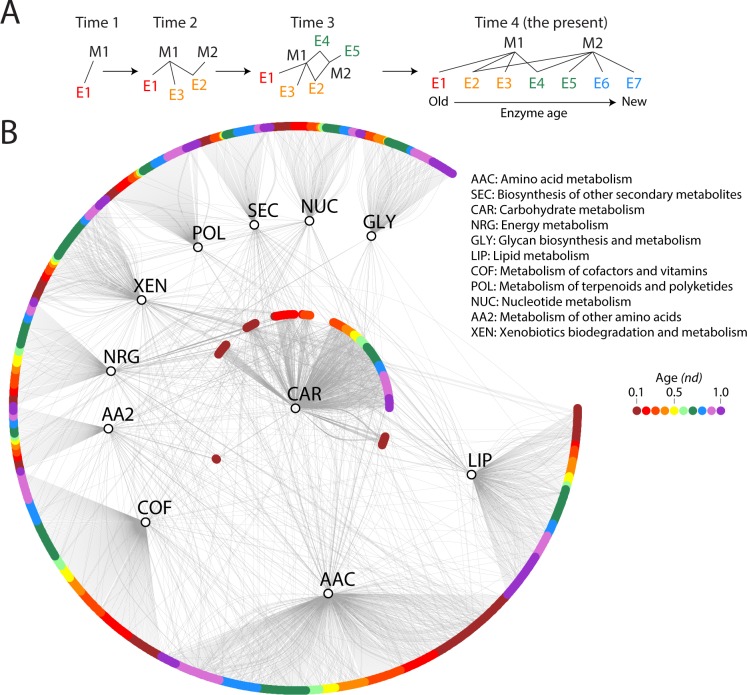
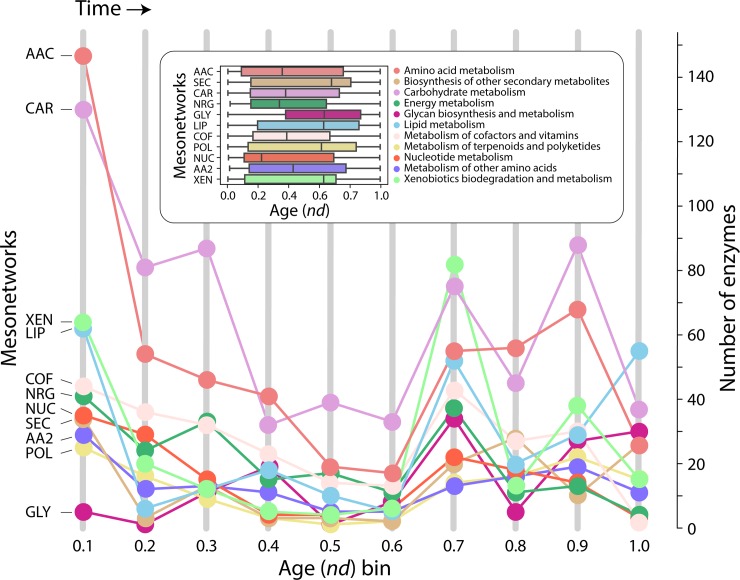
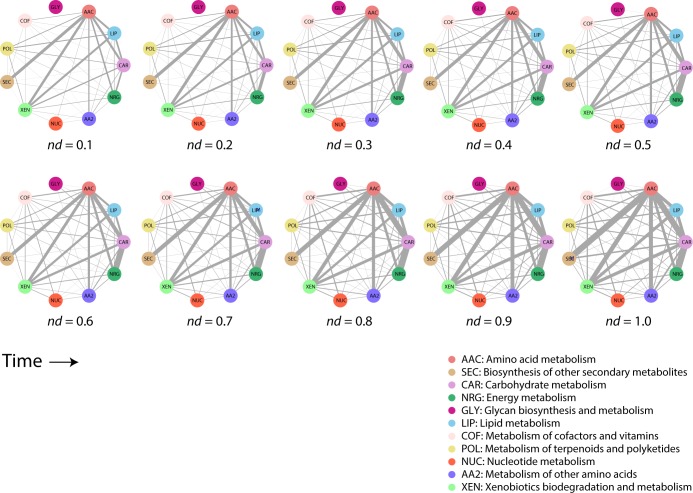
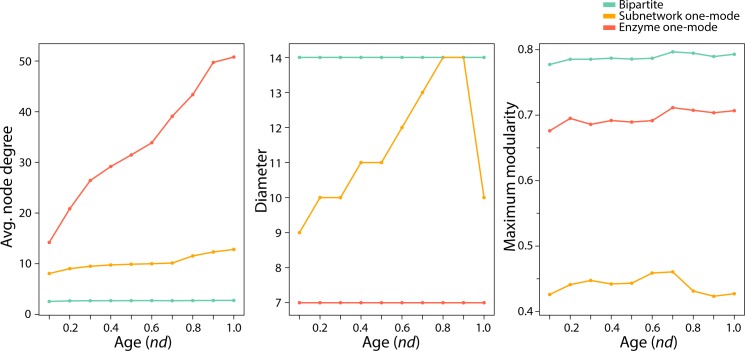
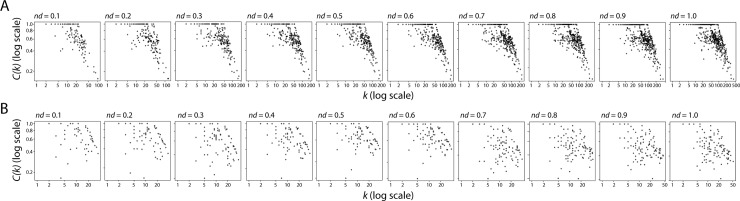
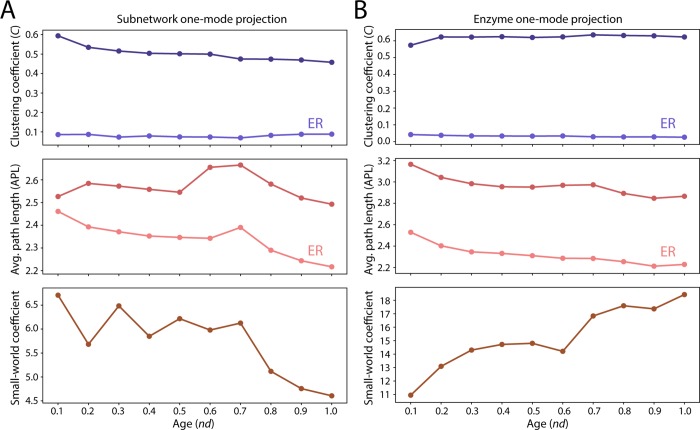
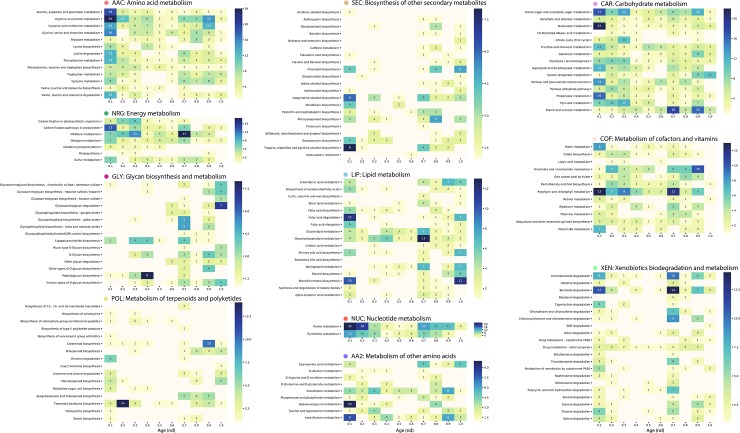
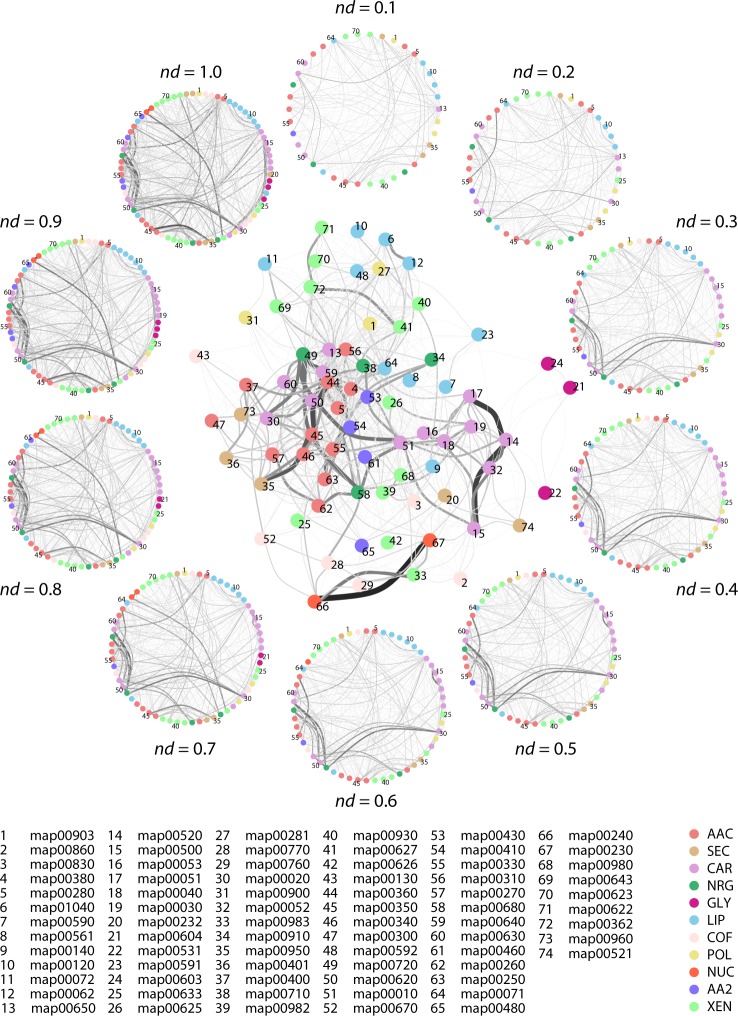
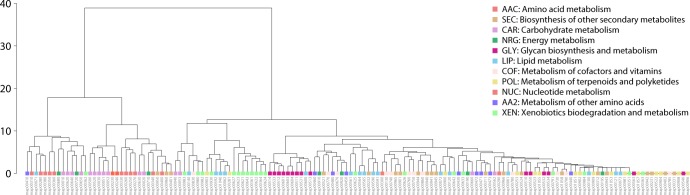
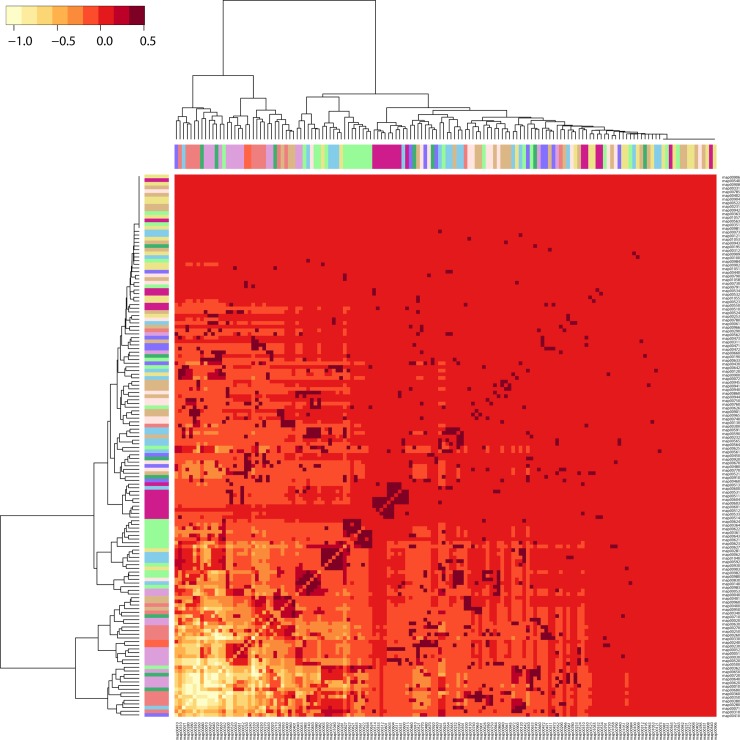
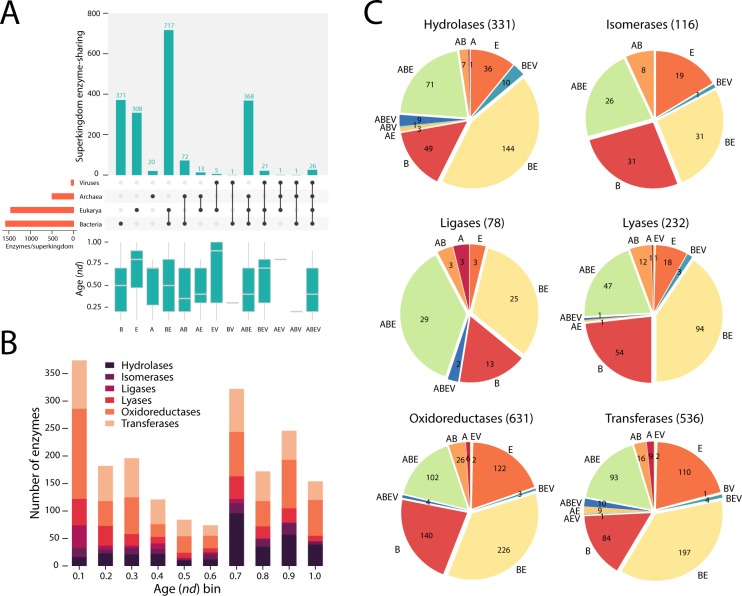
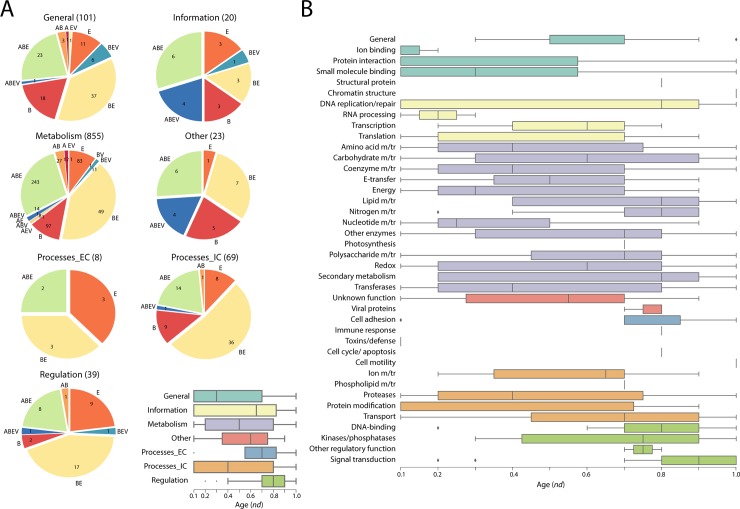
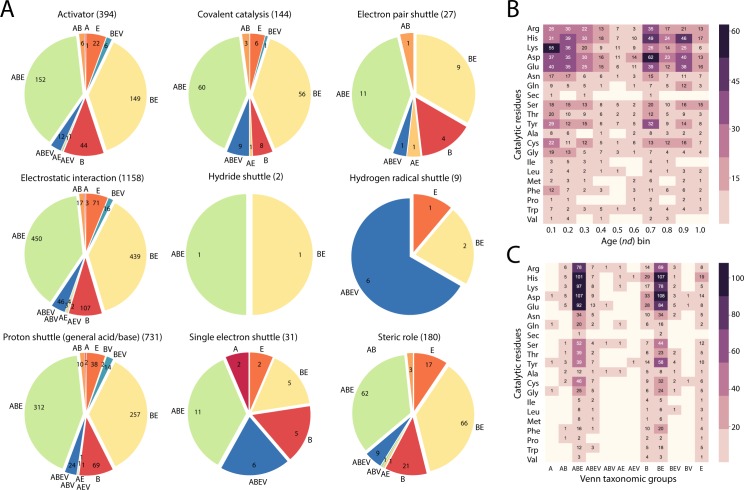
Enzyme recruitment is a fundamental evolutionary driver of modern metabolism. We see evidence of recruitment at work in the metabolic Molecular Ancestry Networks (MANET) database, an online resource that integrates data from KEGG, SCOP and structural phylogenomic reconstruction. The database, which was introduced in 2006, traces the deep history of the structural domains of enzymes in metabolic pathways. Here we release version 3.0 of MANET, which updates data from KEGG and SCOP, links enzyme and PDB information with PDBsum, and traces evolutionary information of domains defined at fold family level of SCOP classification in metabolic subnetwork diagrams. Compared to SCOP folds used in the previous versions, fold families are cohesive units of functional similarity that are highly conserved at sequence level and offer a 10-fold increase of data entries. We surveyed enzymatic, functional and catalytic site distributions among superkingdoms showing that ancient enzymatic innovations followed a biphasic temporal pattern of diversification typical of module innovation. We grouped enzymatic activities of MANET into a hierarchical system of subnetworks and mesonetworks matching KEGG classification. The evolutionary growth of these modules of metabolic activity was studied using bipartite networks and their one-mode projections at enzyme, subnetwork and mesonetwork levels of organization. Evolving metabolic networks revealed patterns of enzyme sharing that transcended mesonetwork boundaries and supported the patchwork model of metabolic evolution. We also explored the scale-freeness, randomness and small-world properties of evolving networks as possible organizing principles of network growth and diversification. The network structure shows an increase in hierarchical modularity and scale-free behavior as metabolic networks unfold in evolutionary time. Remarkably, this evolutionary constraint on structure was stronger at lower levels of metabolic organization. Evolving metabolic structure reveals a 'principle of granularity', an evolutionary increase of the cohesiveness of lower-level parts of a hierarchical system. MANET is available at http://manet.illinois.edu.


Conflict of interest statement

The authors have declared that no competing interests exist.

Figures

Fig 1
Fig 1. Metabolic MANET 3.0.
(A) Entity relationship model of the updated version of metabolic MANET linking ancestries, SCOP, PDBsum and KEGG. (B) Screenshot of a representative subnetwork diagram describing the ‘Pyrimidine metabolism’ subnetwork of MANET. A color scale is used to assign binned ancestry values to enzyme nodes named with EC numbers.
Fig 2
Fig 2. A network view of metabolism.
(A) The enzymatic activities (E) of the metabolic network can be dissected into a hierarchical system of subnetworks (S) and mesonetworks (M), which act as modules of metabolic activity. (B) A bipartite network describing the relationship between mesonetworks and enzymes can be dissected into its two one-mode projections, one describing how enzymes link mesonetworks to each other, the other describing how mesonetworks link enzymes to each other. (C) A bipartite network of subnetworks and enzymes can be dissected into its two one-mode projections, one describing how enzymes link subnetworks to each other, the other describing how subnetworks link enzymes to each other. (D) A bipartite network of mesonetworks and subnetworks can be dissected into its two one-mode projections, one describing how subnetworks link mesonetworks to each other, the other describing how mesonetworks link subnetworks to each other.
Fig 3
Fig 3. Evolution of the mesonetwork-enzyme bipartite network.
(A) Tracing enzyme ages on the bipartite networks, facilitates studying patterns of sharing and show the evolution of networks in time (B) A bipartite graph of mesonetworks and enzymes (nd = 1.0) showing enzymes by nd distribution on a scale of red to violet representing ancestral to recent fold family domain assignments. Mesonetworks are shown as vertices in black while colored nodes denote enzymes.
Fig 4
Fig 4. Run chart of enzymes in mesonetworks appearing in each nd era.
Eras are defined as nd bins of ages; the first nd bin includes enzymes appearing between nd = 0 and nd = 0.1. The inset describes the distribution of enzymes along the evolutionary timeline.
Fig 5
Fig 5. Connectivity patterns among mesonetworks at different stages of the evolutionary timeline. Mesonetworks are represented by vertices while edge thickness shows the number of enzymes shared.
AAC, Amino acid metabolism; SEC, Biosynthesis of other secondary metabolites; CAR, Carbohydrate metabolism; NRG, Energy metabolism; GLY, Glycan biosynthesis and metabolism; LIP, Lipid metabolism; COF, Metabolism of cofactors and vitamins; POL, Metabolism of terpenoids and polyketides; NUC, Nucleotide metabolism; AA2, Metabolism of other amino acids; XEN, Xenobiotics biodegradation and metabolism.
Fig 6
Fig 6. Average node degrees (average number of links), diameter and maximum modularity scores for each type of network (largest connected component) at each time point (0.1 nd interval).
Network sizes (total number of nodes and nodes in the largest connected component) are given in S3 Fig.
Fig 7
Fig 7
Log-log plot of C(k) vs k for the one-mode enzyme (A) and subnetwork (B) projections at nd value intervals of 0.1.
Fig 8
Fig 8. Testing for small-world behavior in the subnetwork and enzyme one-mode networks.
(A) Comparison of clustering coefficient and average path length of the subnetwork one-mode network to that of an Erdős–Rényi (ER) network. The small-world coefficients decrease with the passage of time. (B) Comparison of clustering coefficient and average path length of the enzyme one-mode network to that of an Erdős–Rényi (ER) network. The resulting small-world coefficient increase along the evolutionary timeline.
Fig 9
Fig 9. Matrix representation of subnetwork one-mode graphs by evolutionary age.
Rows represent nodes (subnetworks) with each cell indicating the number of enzymes (edges) per subnetwork in each nd interval.
Fig 10
Fig 10. Evolution of metabolic networks visualized through the subnetwork one-mode projection of the subnetwork-enzyme bipartite network.
A reduced representation of the extant subnetwork one-mode projection (nd = 1.0) is shown in the middle. The reduced network projection shows major nodes (subnetworks) connecting to each other through links (shared enzymes). Greyscale values of links indicate the number of enzymes shared among the subnetworks. A full description of KEGG subnetwork labels can be found in S2 Table and S3 Table. The circle of networks describes a timeline of network growth for the subnetwork projection.
Fig 11
Fig 11. Dendrogram of the subnetwork one-mode network (at nd = 1.0) resulting from hierarchical clustering.
Fig 12
Fig 12. A “tapestry” of enzyme recruitment.
A heatmap based on the modularity matrix was coupled to the dendrogram obtained from hierarchical clustering of the metabolic subnetworks one-mode network (shown in Fig 11).
Fig 13
Fig 13. Enzyme distribution by superkingdom at EC level 1 (N = 1924 enzymes).
(A) Enzyme distribution by superkingdom. (B). Enzymatic functions mapped along the evolutionary timeline. (C) EC level 1 breakdown by superkingdom. A, Archaea; B, Bacteria; E, Eukaryota; V, Viruses.
Fig 14
Fig 14. Functional distribution of enzymes.
(A) Superkingdom makeup Distribution of each general functional category in superkingdoms and viruses. (B) Distribution of detailed functional categories along the evolutionary timeline.
Fig 15
Fig 15. Survey of catalytic sites in all 543 enzymes of the M-CSA database that were mapped to a domain with an nd value.
(A) Distribution of role groups of the catalytic site residues in Venn taxonomic groups of superkingdoms and viruses. (B) Distribution of catalytic residues according to when enzymes possessing these residues appeared along the evolutionary timeline. (C) Distribution of catalytic residues based on association of parent enzymes to the superkingdoms. Highlighted background indicates the group to which the amino acids belong to: purple, basic amino acids; pink, acidic amino acids; green, polar uncharged amino acids; yellow, nonpolar amino acids.

References

    1. Jensen RA. Enzyme recruitment in evolution of new function. Annu Rev Microbiol. 1976; 10.1146/annurev.mi.30.100176.002205 - DOI - PubMed
    1. Caetano-Anollés G, Caetano-Anollés D. An evolutionarily structured universe of protein architecture. Genome Res. 2003;13: 1563–71. 10.1101/gr.1161903 - DOI - PMC - PubMed
    1. Nasir A, Naeem A, Khan MJ, Nicora HDL, Caetano-Anollés G. Annotation of protein domains reveals remarkable conservation in the functional make up of proteomes across superkingdoms. Genes (Basel). 2011;2: 869–911. 10.3390/genes2040869 - DOI - PMC - PubMed
    1. Caetano-Anollés G, Kim HS, Mittenthal JE. The origin of modern metabolic networks inferred from phylogenomic analysis of protein architecture. Proc Natl Acad Sci U S A. 2007;104: 9358–63. 10.1073/pnas.0701214104 - DOI - PMC - PubMed
    1. Caetano-Anollés K, Caetano-Anollés G. Structural phylogenomics reveals gradual evolutionary replacement of abiotic chemistries by protein enzymes in purine metabolism. PLoS One. 2013;8: e59300 10.1371/journal.pone.0059300 - DOI - PMC - PubMed

Publication types