. 2019 Dec;50(12):3569-3577.
doi: 10.1161/STROKEAHA.119.025898. Epub 2019 Oct 25.

Corticospinal Tract Injury Estimated From Acute Stroke Imaging Predicts Upper Extremity Motor Recovery After Stroke

Affiliations

Corticospinal Tract Injury Estimated From Acute Stroke Imaging Predicts Upper Extremity Motor Recovery After Stroke

David J Lin et al. Stroke. 2019 Dec.

Abstract

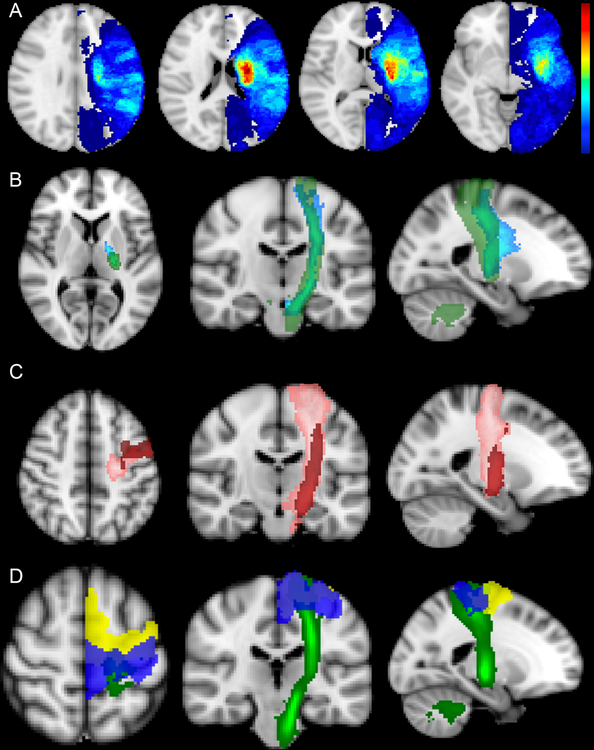
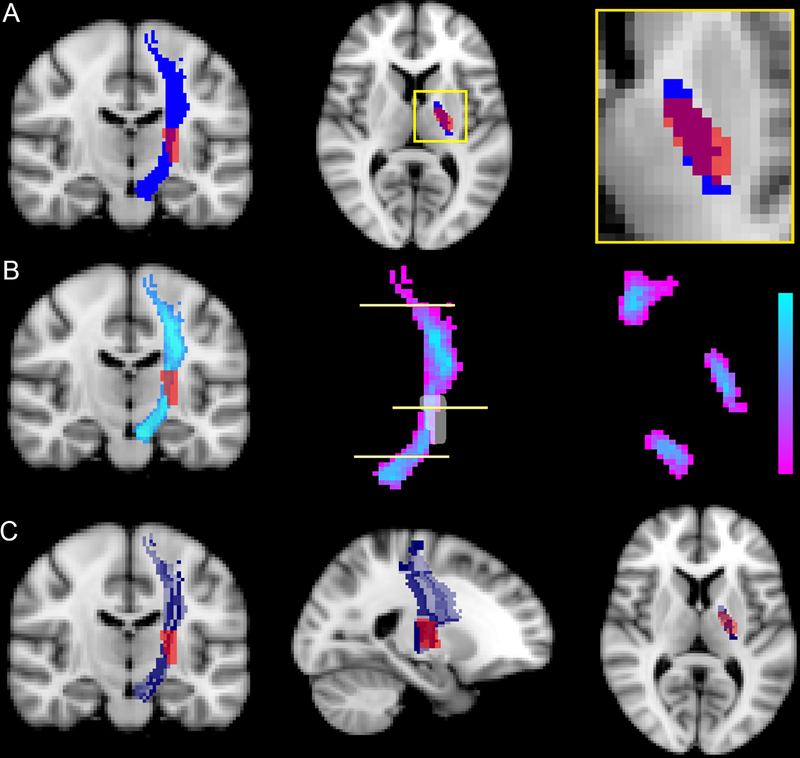
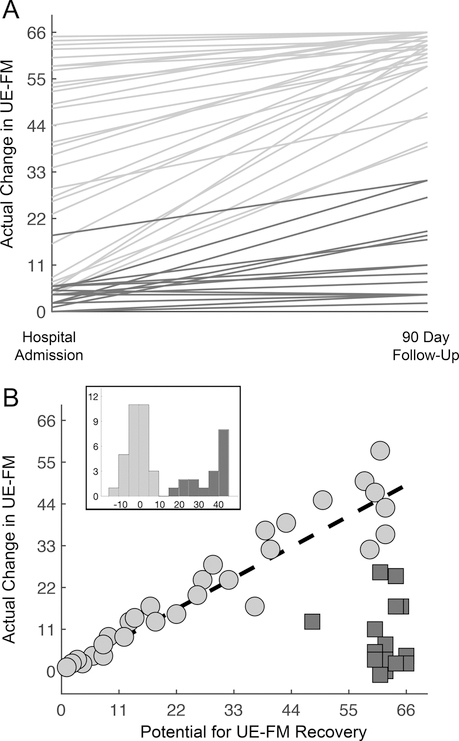
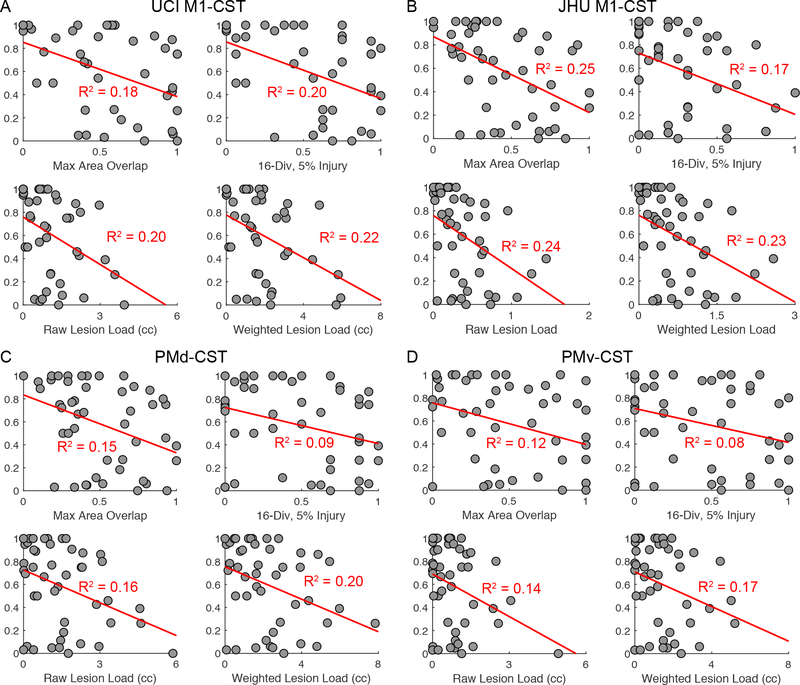
Background and Purpose- Injury to the corticospinal tract (CST) has been shown to have a major effect on upper extremity motor recovery after stroke. This study aimed to examine how well CST injury, measured from neuroimaging acquired during the acute stroke workup, predicts upper extremity motor recovery. Methods- Patients with upper extremity weakness after ischemic stroke were assessed using the upper extremity Fugl-Meyer during the acute stroke hospitalization and again at 3-month follow-up. CST injury was quantified and compared, using 4 different methods, from images obtained as part of the stroke standard-of-care workup. Logistic and linear regression were performed using CST injury to predict ΔFugl-Meyer. Injury to primary motor and premotor cortices were included as potential modifiers of the effect of CST injury on recovery. Results- N=48 patients were enrolled 4.2±2.7 days poststroke and completed 3-month follow-up (median 90-day modified Rankin Scale score, 3; interquartile range, 1.5). CST injury distinguished patients who reached their recovery potential (as predicted from initial impairment) from those who did not, with area under the curve values ranging from 0.70 to 0.8. In addition, CST injury explained ≈20% of the variance in the magnitude of upper extremity recovery, even after controlling for the severity of initial impairment. Results were consistent when comparing 4 different methods of measuring CST injury. Extent of injury to primary motor and premotor cortices did not significantly influence the predictive value that CST injury had for recovery. Conclusions- Structural injury to the CST, as estimated from standard-of-care imaging available during the acute stroke hospitalization, is a robust way to distinguish patients who achieve their predicted recovery potential and explains a significant amount of the variance in poststroke upper extremity motor recovery.

Keywords: area under curve; humans; neuroimaging; neurological rehabilitation; pyramidal tracts.


Figures

Figure 1.
Figure 1.
(A) Stroke lesion overlap maps for the 48 participants. All lesions were flipped onto the left hemisphere for display. Colorbar on the right with maximum value 22 (i.e. maximal overlap voxel, red). (B) Primary motor cortex (M1) - Corticospinal tract (CST) templates constructed using deterministic tractography methods. The light blue tract shows an M1-CST from 17 healthy controls at University of California at Irvine (UCI). The green tract shows an M1-CST from 28 health subjects at Johns Hopkins University (JHU). Note the tracts are slightly offset and that the JHU tract traverses down to the level of the medulla while the UCI tract stops at the level of the mid-pons. (C) Templates of dorsal premotor (PMd, pink) and ventral premotor (PMv, red) CSTs. (D) Templates of primary motor (M1, dark blue), and premotor (pM), yellow) cortices overlaid on the JHU CST template (green).
Figure 2.
Figure 2.
Different methods for estimating CST injury. There are a variety of methods for calculating CST injury from a given stroke lesion and CST template. (A) One method uses area overlap between the stroke lesion and binarized CST tract on the axial slice with maximal overlap. Left panel shows coronal binarized CST tract, middle shows axial slice with maximal overlap between stroke and CST, right shows zoomed overlap of stroke (red) and CST template (blue). The # of voxels overlapped (red-blue overlay) are divided by the total # of blue voxels. (B) In calculating 3D volume overlap between stroke (red) and CST (blue), raw- and weighted- values are incorporated into CST weighting to account for the probabilistic nature of the CST and narrowing of the CST at different points (i.e. the posterior limb of the internal capsule). Left panel shows probabilistic nature of CST in a coronal slice. Middle panel highlights the weighted nature of the tract with purple to light blue colorbar. The horizontal lines indicate corresponding axial slices of the CST that are shown in the right panel. (C) Another method divides the CST into a number of rostral-caudal strands (16 in this case) and calculates % injury to each strand. If any given strand is lesioned by more than 5%, the strand is classified as injured. The right, middle, and left panels show coronal, sagittal, and axial slices respectively with CST strands in different colors (gray-blue gradient) and with stroke lesion shown in red.
Figure 3.
Figure 3.
Proportional and limited recoverers. (A) Upper extremity Fugl-Meyer (FM) recovery curves between hospital admission and 3-month follow-up for 48 patients with stroke. Note that in severe patients (FMInit < 22) there is a group with limited recovery (dark gray lines). (B) Potential for (66 – FMInit) versus actual (FM3mo – FMInit) recovery of upper extremity impairment. The line (black-dashed) represents the amount of recovery as predicted by the proportional recovery model (FMPredicted = 0.7 × FMPotential). Limited recoverers (dark gray squares) are distinguished from proportional recoverers by a model residual of greater than 10 from their 70% predicted recovery. The histogram inset shows the model residuals of proportional recoverers (light gray) and limited recoverers (dark gray).
Figure 4.
Figure 4.
Scatter plots of realized recovery against all different CST injury method values for the (A) UCI M1-CST, (B) JHU M1-CST (C) PMd-CST and (D) PMv-CST. Least-square fit lines and corresponding R2 correlation coefficients are shown in red.

References

    1. Langhorne P, Coupar F, Pollock A. Motor recovery after stroke: A systematic review. Lancet Neurol 2009;8:741–754 - PubMed
    1. Kwakkel G, Kollen B, Twisk J. Impact of time on improvement of outcome after stroke. Stroke. 2006;37:2348–2353 - PubMed
    1. Duncan PW, Goldstein LB, Matchar D, Divine GW, Feussner J. Measurement of motor recovery after stroke. Outcome assessment and sample size requirements. Stroke. 1992;23:1084–1089 - PubMed
    1. Prabhakaran S, Zarahn E, Riley C, Speizer A, Chong JY, Lazar RM, et al. Inter-individual variability in the capacity for motor recovery after ischemic stroke. Neurorehabil Neural Repair. 2008;22:64–71 - PubMed
    1. Winters C, van Wegen EE, Daffertshofer A, Kwakkel G. Generalizability of the proportional recovery model for the upper extremity after an ischemic stroke. Neurorehabil Neural Repair. 2015;29:614–622 - PubMed

Publication types