. 2020 Jan;10(1):104-123.
doi: 10.1158/2159-8290.CD-19-1006. Epub 2019 Oct 24.

Atypical KRASG12R Mutant Is Impaired in PI3K Signaling and Macropinocytosis in Pancreatic Cancer

Affiliations

Atypical KRASG12R Mutant Is Impaired in PI3K Signaling and Macropinocytosis in Pancreatic Cancer

G Aaron Hobbs et al. Cancer Discov. 2020 Jan.

Abstract

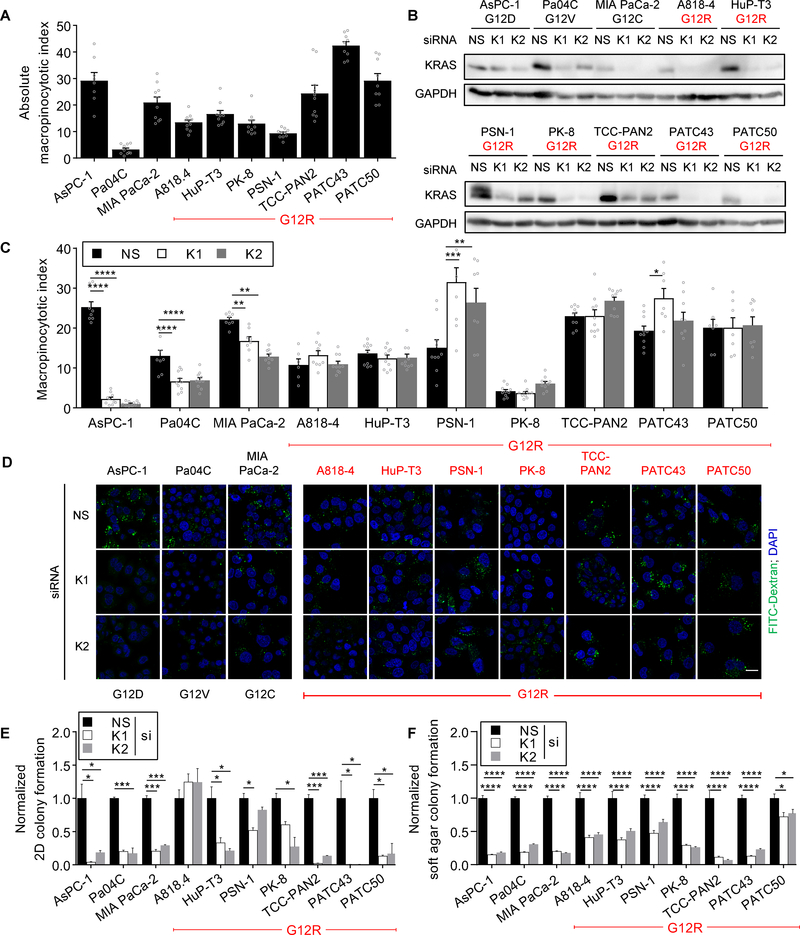
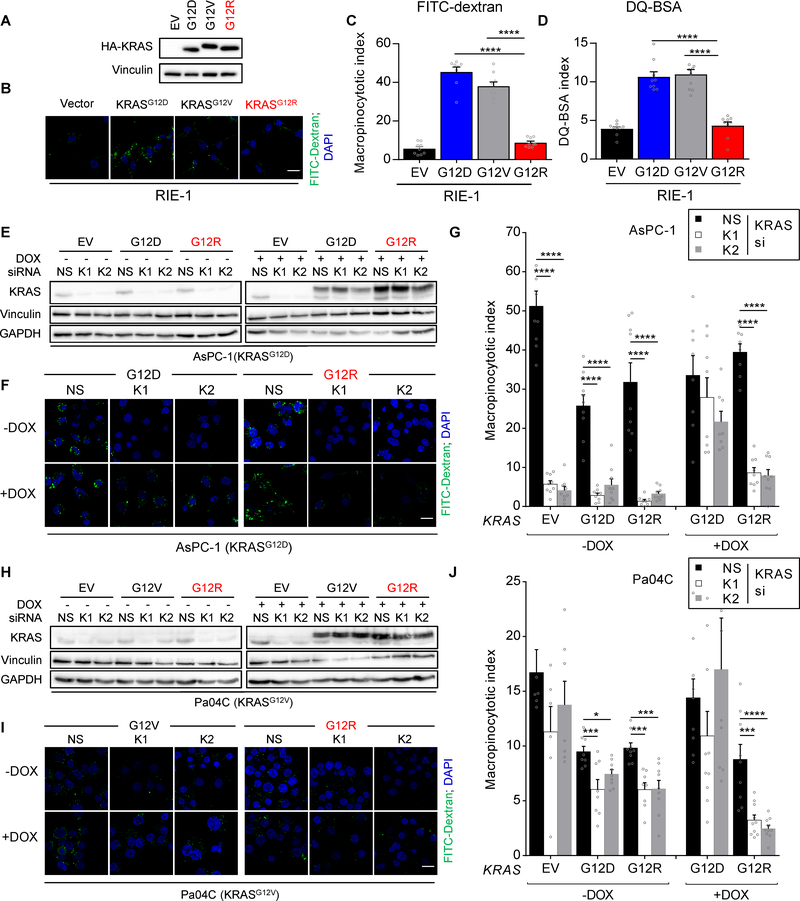
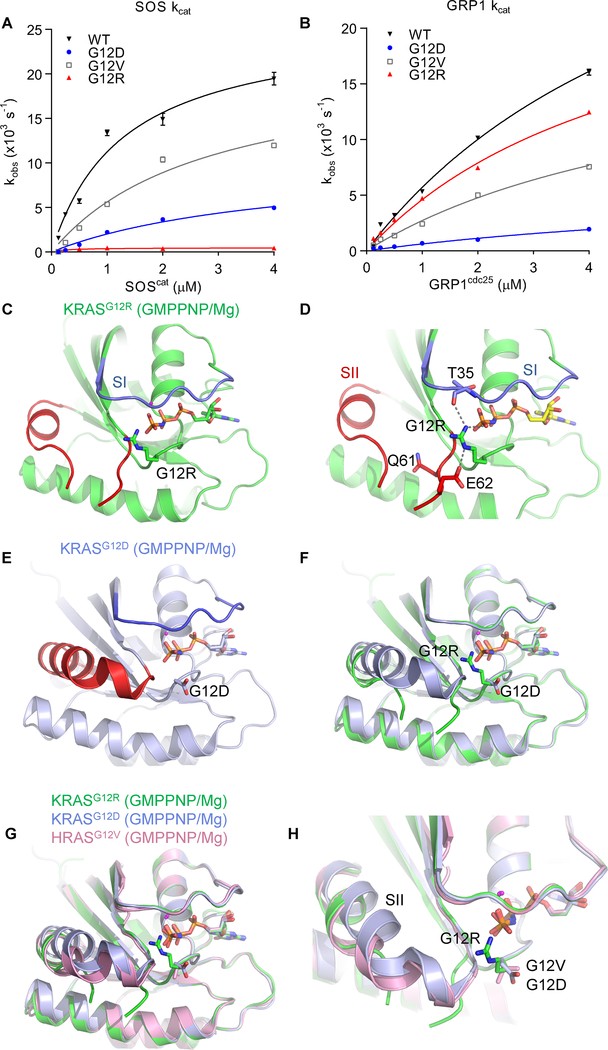
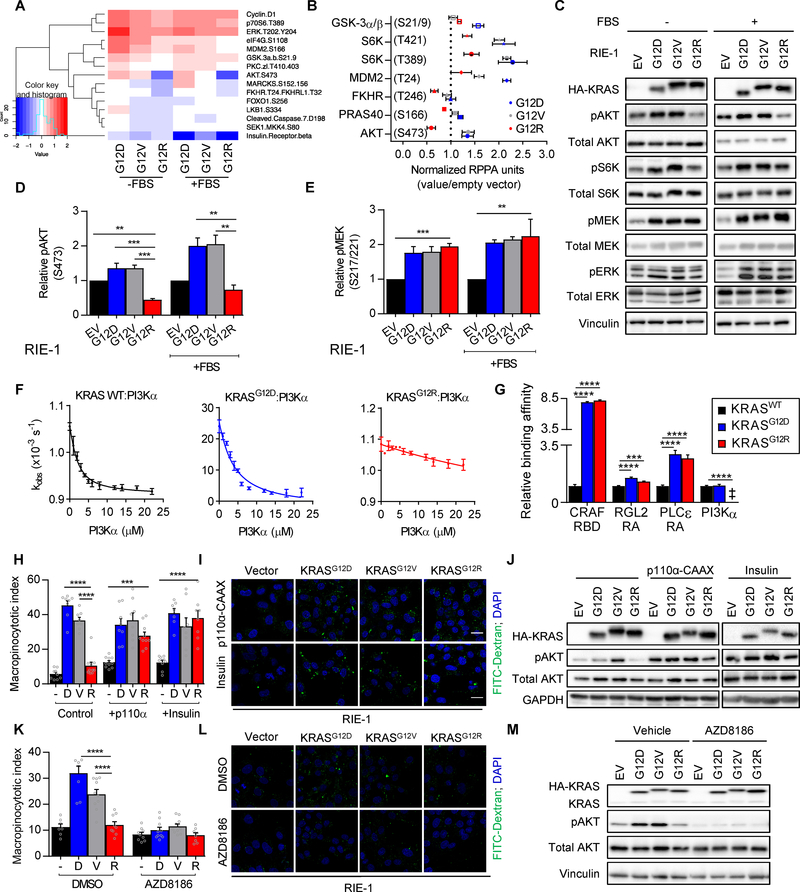
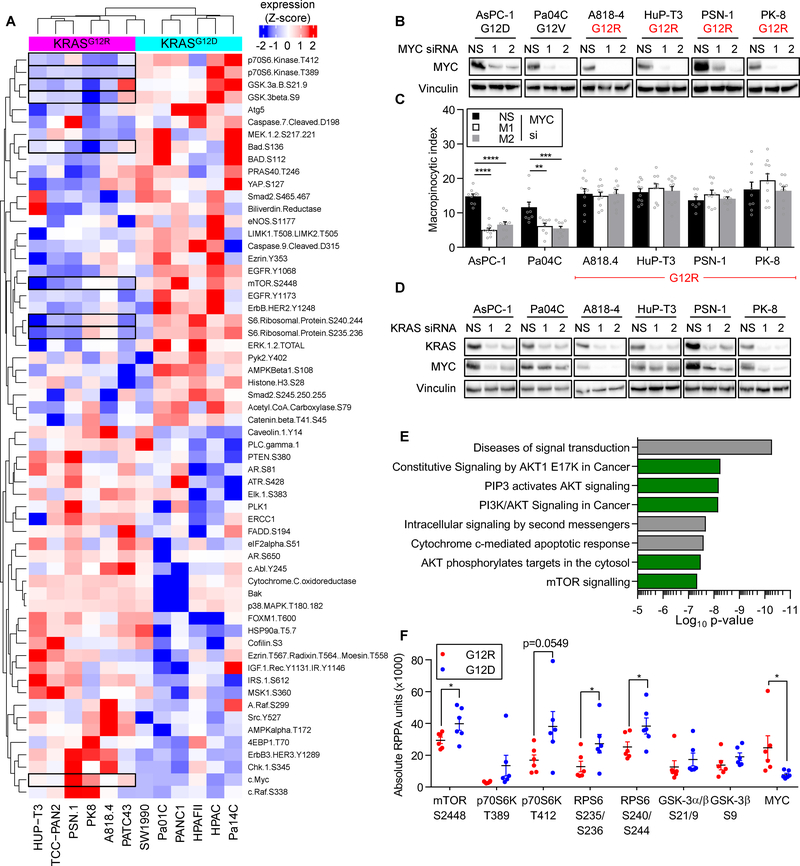
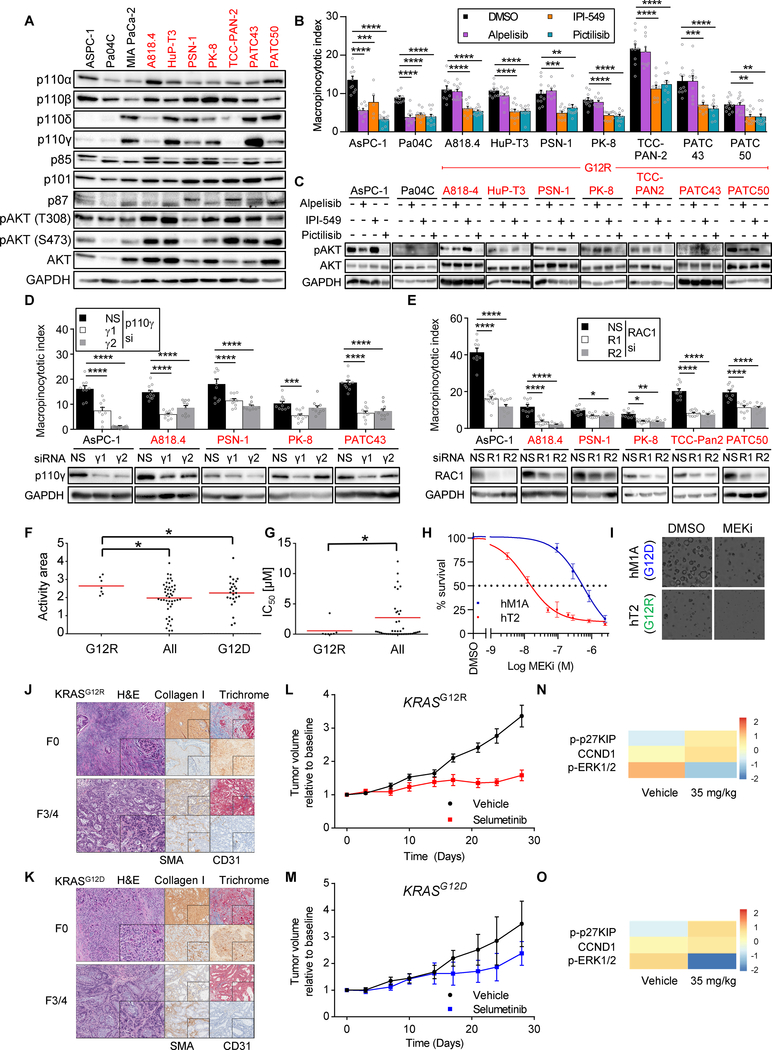
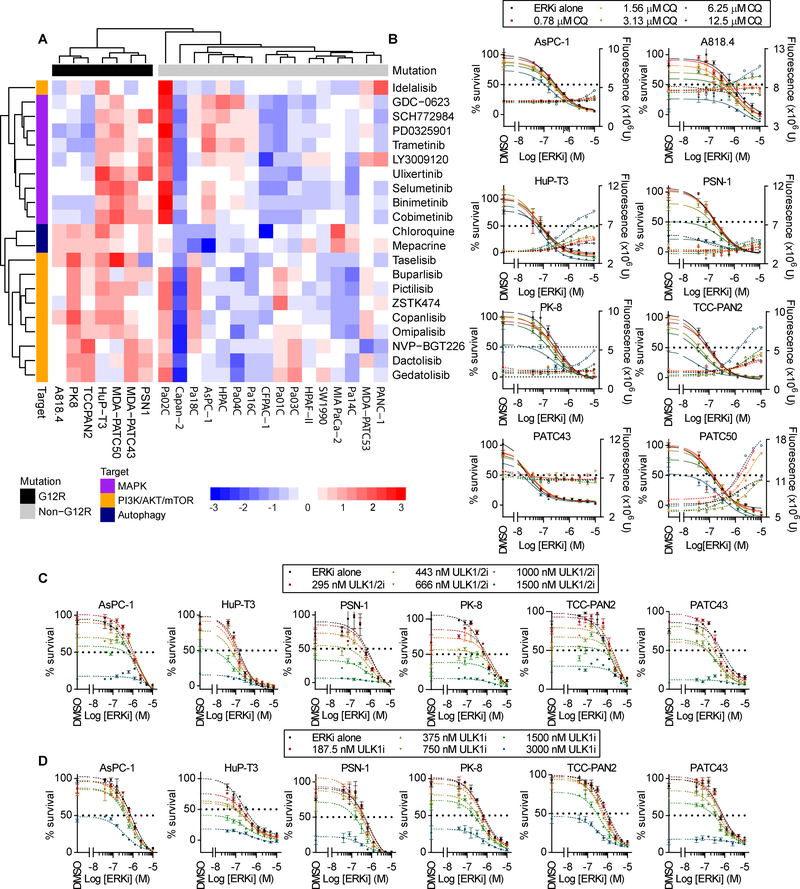
Allele-specific signaling by different KRAS alleles remains poorly understood. The KRAS G12R mutation displays uneven prevalence among cancers that harbor the highest occurrence of KRAS mutations: It is rare (∼1%) in lung and colorectal cancers, yet relatively common (∼20%) in pancreatic ductal adenocarcinoma (PDAC), suggesting context-specific properties. We evaluated whether KRASG12R is functionally distinct from the more common KRASG12D- or KRASG12V-mutant proteins (KRASG12D/V). We found that KRASG12D/V but not KRASG12R drives macropinocytosis and that MYC is essential for macropinocytosis in KRASG12D/V- but not KRASG12R-mutant PDAC. Surprisingly, we found that KRASG12R is defective for interaction with a key effector, p110α PI3K (PI3Kα), due to structural perturbations in switch II. Instead, upregulated KRAS-independent PI3Kγ activity was able to support macropinocytosis in KRASG12R-mutant PDAC. Finally, we determined that KRASG12R-mutant PDAC displayed a distinct drug sensitivity profile compared with KRASG12D-mutant PDAC but is still responsive to the combined inhibition of ERK and autophagy. SIGNIFICANCE: We determined that KRASG12R is impaired in activating a key effector, p110α PI3K. As such, KRASG12R is impaired in driving macropinocytosis. However, overexpression of PI3Kγ in PDAC compensates for this deficiency, providing one basis for the prevalence of this otherwise rare KRAS mutant in pancreatic cancer but not other cancers.See related commentary by Falcomatà et al., p. 23.This article is highlighted in the In This Issue feature, p. 1.


Figures

Figure 1.
Figure 1.
KRAS-independent macropinocytosis in KRASG12R-mutant PDAC cell lines. A, Quantification of FITC-dextran-labeled macropinosomes in PDAC cell lines. Data shown are representative of three independent experiments. All FITC-dextran experiments analyzed at least 75 cells in approximately 10 randomly selected fields of view per condition. B, Immunoblot analysis of KRAS expression upon silencing using a nonspecific (NS) and two KRAS-targeting siRNAs. C, Quantification of FITC-dextran-labeled macropinosomes in KRAS siRNA-silenced PDAC cell lines. Data shown are representative of three independent experiments and normalized to the corresponding NS treatment, unless indicated otherwise. D, Representative images of FITC-dextran-labeled macropinosomes from C. Macropinosomes were labeled by exposure with FITC-dextran (green) and nuclei stained by DAPI (blue). E, Anchorage-dependent colony formation of PDAC treated with KRAS siRNA. Cells were cultured for seven days and developed with crystal violet. Data are the average of six replicates. F, Anchorage-independent colony formation of PDAC treated with KRAS siRNA. Cells were cultured for seven days and developed with AlamarBlue reagent. Data are the average of six replicates. ****P<0.0001, ***P<0.0002, **P<0.0021, *P<0.032, p values from Dunnett’s multiple comparison test after one-way ANOVA, comparing K1/K2 lanes to respective NS controls. Scale bar, 20 μm. Error bars, mean ± s.e.m.
Figure 2.
Figure 2.
Exogenous KRASG12D but not KRASG12R rescues KRAS-dependent macropinocytosis. A, Immunoblot analysis of HA epitope-tagged KRAS mutant proteins stably expressed in RIE-1 cells. B, FITC-dextran-labeled macropinosomes in KRAS-transformed RIE-1 cells. Macropinosomes, green; nuclei, blue. C, Quantification of FITC-dextran uptake in RIE-1 cells. Mean values plotted with each data point representing one field and at least 75 cells per condition were analyzed. Data are representative of at least 3 independent experiments D, Quantification of DQ-BSA in macropinosomes of RIE-1 cells, as in B; data are representative of at least three independent experiments. P values from Dunnett’s multiple comparison test after one-way ANOVA, comparing all conditions to G12R. E, Immunoblot analysis of AsPC-1 cells expressing doxycycline-inducible HA-KRAS mutant proteins with or without siRNA silencing of KRAS. F, FITC-dextran-labeled macropinosomes in AsPC-1 cells. Macropinosomes, green; nuclei, blue. G, Quantification of FITC-dextran uptake in AsPC-1 cells, as in B. H, Immunoblot analysis of Pa04C cells expressing doxycycline-inducible HA-KRAS mutant proteins with or without siRNA silencing of KRAS. I, FITC-dextran-labeled macropinosomes in Pa04C cells. Macropinosomes, green; nuclei, blue. J, Quantification of FITC-dextran uptake in Pa04C cells, as in B. Data are representative of three independent experiments for AsPC-1 cells and two for Pa04C cells. ****P<0.0001, ***P<0.0002, *P<0.032, p values from Dunnett’s multiple comparison test after one-way ANOVA, comparing K1/K2 lanes to respective NS controls. Scale bar, 20 μm. Error bars, mean ± s.e.m.
Figure 3.
Figure 3.
KRASG12R is insensitive to SOScat and has an altered switch II structure. A, Measurement of the kcat of SOS1-mediated nucleotide exchange. B, Measurement of the kcat of GRP1-mediated nucleotide exchange. Data are the average of three independent experiments. Error bars, mean ± s.e.m. C, Ribbon diagram of the crystal structure of KRASG12R; PDB 6CU6. Switch I (SI), blue; switch II (SII), red. The nucleotide analog GMPPNP and arginine (G12R) are drawn as sticks. D, Magnification of the nucleotide binding pocket in KRASG12R. Dotted lines represent hydrogen bonds. Nitrogen, dark blue; oxygen, light red; phosphate, orange. E, KRASG12D (PDB 5USJ) crystal structure shown for reference. Coloring is the same as in panel B. F, Overlay of KRASG12R (green) and KRASG12D (blue) ribbon diagrams. G, Overlay of ribbon diagrams of KRASG12R (green), KRASG12D (blue) and HRASG12V (pink, PDB 1HE8). H, Magnification of the nucleotide binding pocket. Mutant sidechains are drawn as sticks for reference.
Figure 4.
Figure 4.
KRASG12R fails to drive macropinocytosis due to loss of PI3Kα activation. A, Heatmap of the relative RPPA intensities in RIE-1 cells ectopically expressing KRAS mutants. Phosphosites depicted had a P-value <0.1 by Student’s t-test comparing G12D to G12R in serum-free conditions. B, RPPA intensities of select protein features, normalized to empty vector. Data are the average of three independent experiments. C, Immunoblot analysis of RIE-1 cells stably expressing HA-KRAS mutant proteins in the absence or presence of serum. Data are representative of three independent experiments. D, Quantification of phosphorylation of AKT S473 and E, MEK S217/221 in KRAS-transformed RIE-1 cells. Data are an average of three independent experiments. P values from Dunnett’s multiple comparison test after one-way ANOVA, comparing all lanes to G12R for each condition. F, In vitro measurement of KRAS:PI3Kα binding using the inhibition of nucleotide dissociation assay. G, Normalized in vitro binding affinity measurements of KRAS proteins to the RBD/RA domains of RAS effectors and full-length PI3Kα. Binding was normalized to KRAS WT for each effector. ‡ No binding detected. P values from Dunnett’s multiple comparison test after one-way ANOVA, comparing each lane to WT. Data are an average of three independent experiments. H, Quantification of FITC-dextran-labeled macropinosomes in RIE-1 cells expressing HA epitope-tagged KRAS mutants with constitutively activated p110α-CAAX or after addition of insulin to the medium. P values from Dunnett’s multiple comparison test after one-way ANOVA, comparing each lane to G12R. I, Representative images of cells quantified in H. Macropinosomes, green; nuclei, blue. J, Immunoblot analysis cells from panel H. Data are representative of three independent experiments. K, Quantification of FITC-dextran-labeled macropinosomes in RIE-1 cells expressing HA-KRAS mutants treated with the p110α/β/δ inhibitor AZD8186 (1 μM, 48 h). L, Representative images of cells quantified in K. M, Immunoblot analysis cells from panel K. P values from Dunnett’s multiple comparison test after one-way ANOVA, comparing all lanes to G12R for each treatment. Data are representative of three independent experiments. ****P<0.0001, ***P<0.0002, **P<0.0021; Mean values plotted, with each data point representing one field and at least 75 cells per condition. Scale bar, 20 μm. Error bars, mean ± s.e.m.
Figure 5.
Figure 5.
KRASG12R-mutant PDAC cell lines have a distinct cell signaling profile. A, RPPA analysis of six KRASG12R PDAC cell lines and seven KRASG12D/V PDAC cell lines under basal growth conditions. The top and bottom 30 features most differentially expressed between the two mutational groups are shown. Selected features are highlighted. B, Immunoblot analysis of PDAC cell lines after 48 h of MYC siRNA treatment. C, Quantification of FITC-dextran uptake after 48 h of MYC siRNA treatment. Mean values plotted, with each data point representing one field and at least 75 cells per condition. P values from Dunnett’s multiple comparison test after one-way ANOVA, comparing the K1/K2 lanes to the respective NS controls. ****P<0.0001, **P<0.0021; Error bars, mean ± s.e.m. D, Immunoblot analysis of PDAC cell lines treated with siRNA to silence KRAS. E, Reactome2016 profiling of the 30 protein features that were most decreased in the KRASG12R PDAC cell lines. F, Dot plot of selected phosphorylated and total proteins from the RPPA data. Cell lines were grouped into KRASG12R or non-KRASG12R and the median value from three independent experiments for each cell line was plotted. *P<0.05, p values from a two-tailed unpaired t-test for each protein.
Figure 6.
Figure 6.
KRASG12R-mutant PDAC rely on p110γ for macropinocytosis and are more sensitive than KRASG12D-mutant PDAC to MEK/ERK inhibition. A, Immunoblot analysis of p110 isoforms in PDAC. B, Quantification of FITC-dextran-labeled macropinosomes in PDAC cell lines treated with DMSO, alpelisib (p110α-selective inhibitor, 100 nM), IPI-549 (p110γ-selective inhibitor, 300 nM) or pictilisib (pan-p110 inhibitor, 1.5 μM) for 18 h. Data are representative of four independent experiments. C, Immunoblot analysis of cells from B. D, Quantification of FITC-dextran labeled macropinosomes after 72 h of PIK3CG siRNA treatment. Immunoblot analysis below. Data are representative of three independent experiments. E, Quantification of FITC-dextran labeled macropinosomes after 72 h of RAC1 siRNA treatment. Immunoblot analysis below. Data are representative of three independent experiments. Mean values plotted, with each data point representing one field and at least 75 cells per condition. P values from Dunnett’s multiple comparison test after one-way ANOVA, comparing all treatments to DMSO or NS. ****P<0.0001, ***P<0.0002, **P<0.0021, *P<0.032, Error bars, mean ± s.e.m. F, Scatter plot of average activity (AA) area and G, individual IC50 values of KRASG12R vs. non-KRASG12R lines. Whitney Mann U-test, 2-tailed; *p<0.05. H, Cell viability of PDAC organoid cultures treated with MEKi (selumetinib). Organoids were cultured for 10 days. Data are the average of four independent experiments. I, Bright field images from H. J, Cytoarchitecture of KRASG12R-mutant pancreas cancer PDX. F0, prior to xenotransplantation, F3/4, after 3–4 passages in NOD/SCID mice. Left, H&E; right, immunohistochemical stains for collagen I, anti-smooth muscle antigen (SMA), anti-CD31 and trichrome (20x). K, Cytoarchitecture of KRASG12D-mutant pancreas cancer PDX, as in J. L, Tumor volume of patient-derived pancreatic tumors expressing KRASG12R in immunocompromised NOD/SCID mice treated with MEKi. When tumor volume reached 200 mm3, MEKi (35 mg/kg) was given twice daily by oral gavage. Bi-weekly tumor measurements (n≥10 animals per arm) were normalized to tumor volume at the start of treatment. Error bars, mean ± s.e.m. M, Tumor volume of patient-derived pancreatic tumors expressing KRASG12D treated with MEKi, as in L. N, RPPA analysis of KRASG12R-expressing tumors excised after 28 days of treatment (mean of 4 tumors). Protein signals were normalized to total protein, levels shown as log2-transformed measures. O, RPPA analysis of KRASG12D-expressing tumors, as in N.
Figure 7.
Figure 7.
KRASG12R PDAC are sensitive to inhibitors of autophagy. A, Heatmap from drug sensitivity and resistance testing of PDAC cell lines to >525 different inhibitors. KRASG12R cell lines showed increased sensitivity, relative to KRASG12D/V cell lines, to inhibitors of ERK MAPK, PI3K and autophagy. B, Cell viability and cytotoxicity of select PDAC cell lines co-treated with SCH772984 (ERKi) and chloroquine (autophagy inhibitor, CQ). C, Cell viability of select PDAC cell lines co-treated with SCH772984 (ERKi) and the ULK inhibitor MRT68921 (MRT) after five days. D, Cell viability of select PDAC cell lines co-treated with SCH772984 (ERKi) and the ULK inhibitor SBI0206965 (SBI) after five days. All data are representative of three independent experiments.

Comment in

References

    1. Cox AD, Fesik SW, Kimmelman AC, Luo J, Der CJ. Drugging the undruggable RAS: mission possible? Nature reviews Drug discovery 2014;13:828–51. - PMC - PubMed
    1. Papke B, Der CJ. Drugging RAS: Know the enemy. Science 2017;355:1158–63. - PubMed
    1. AMG 510 First to Inhibit “Undruggable” KRAS. Cancer Discov 2019;9:988–9. - PubMed
    1. Haigis KM. KRAS alleles: the devil is in the detail. Trends Cancer 2017;3:686–97. - PMC - PubMed
    1. Waters AM, Der CJ. KRAS: the critical driver and therapeutic target for pancreatic cancer. Cold Spring Harb Perspect Med 2017. - PMC - PubMed

Publication types

MeSH terms

Substances