. 2019 Oct 25;366(6464):eaax6624.
doi: 10.1126/science.aax6624.

MAIT cells are imprinted by the microbiota in early life and promote tissue repair

Affiliations

MAIT cells are imprinted by the microbiota in early life and promote tissue repair

Michael G Constantinides et al. Science. .

Abstract

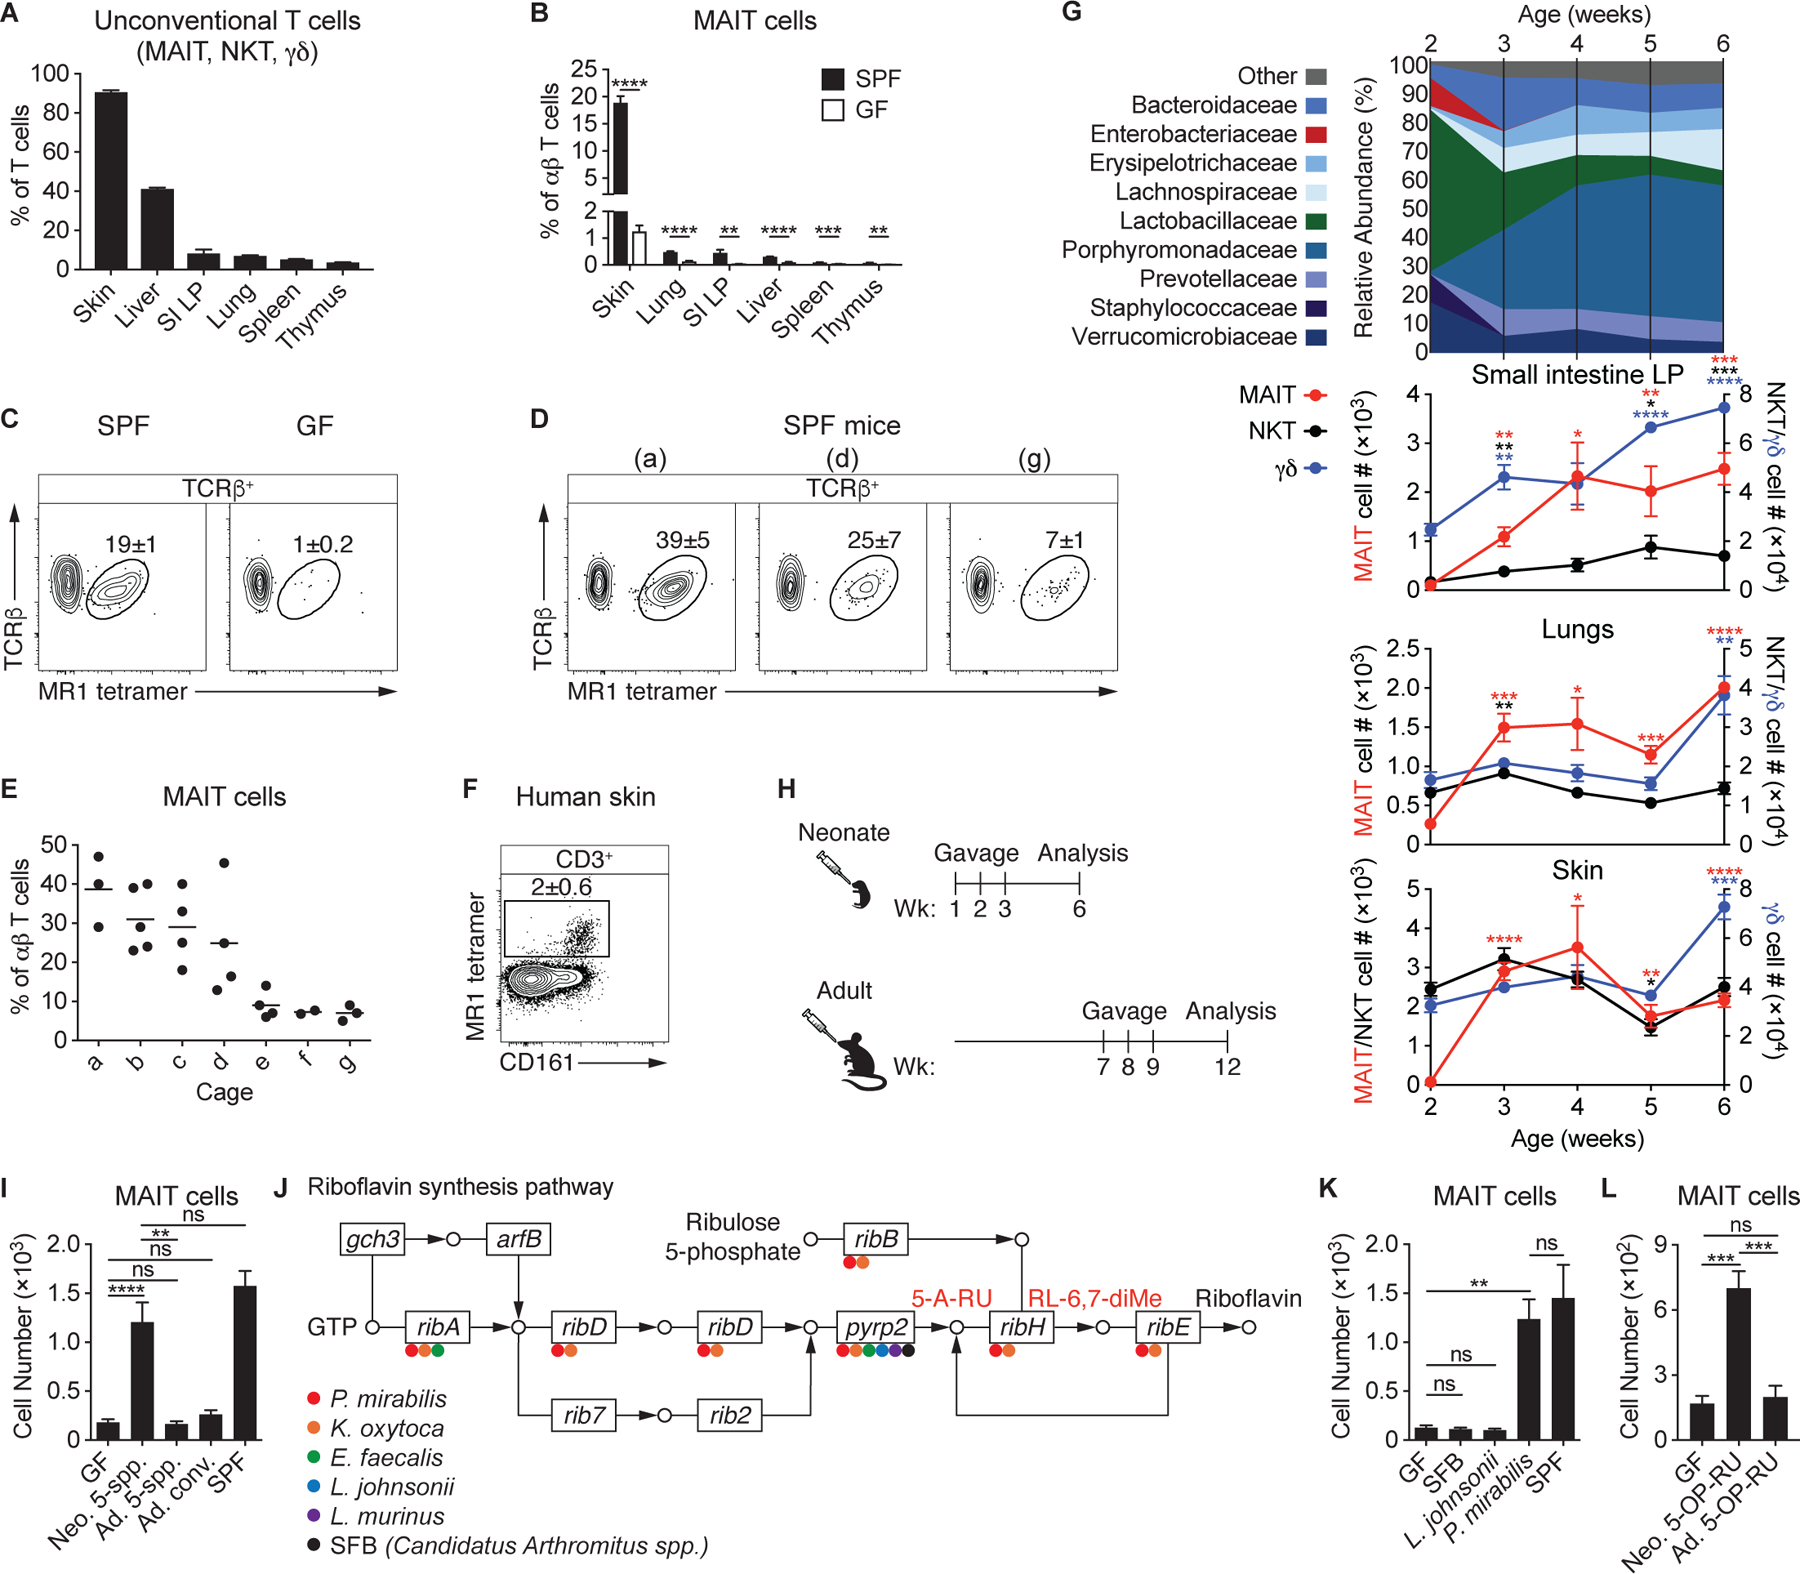
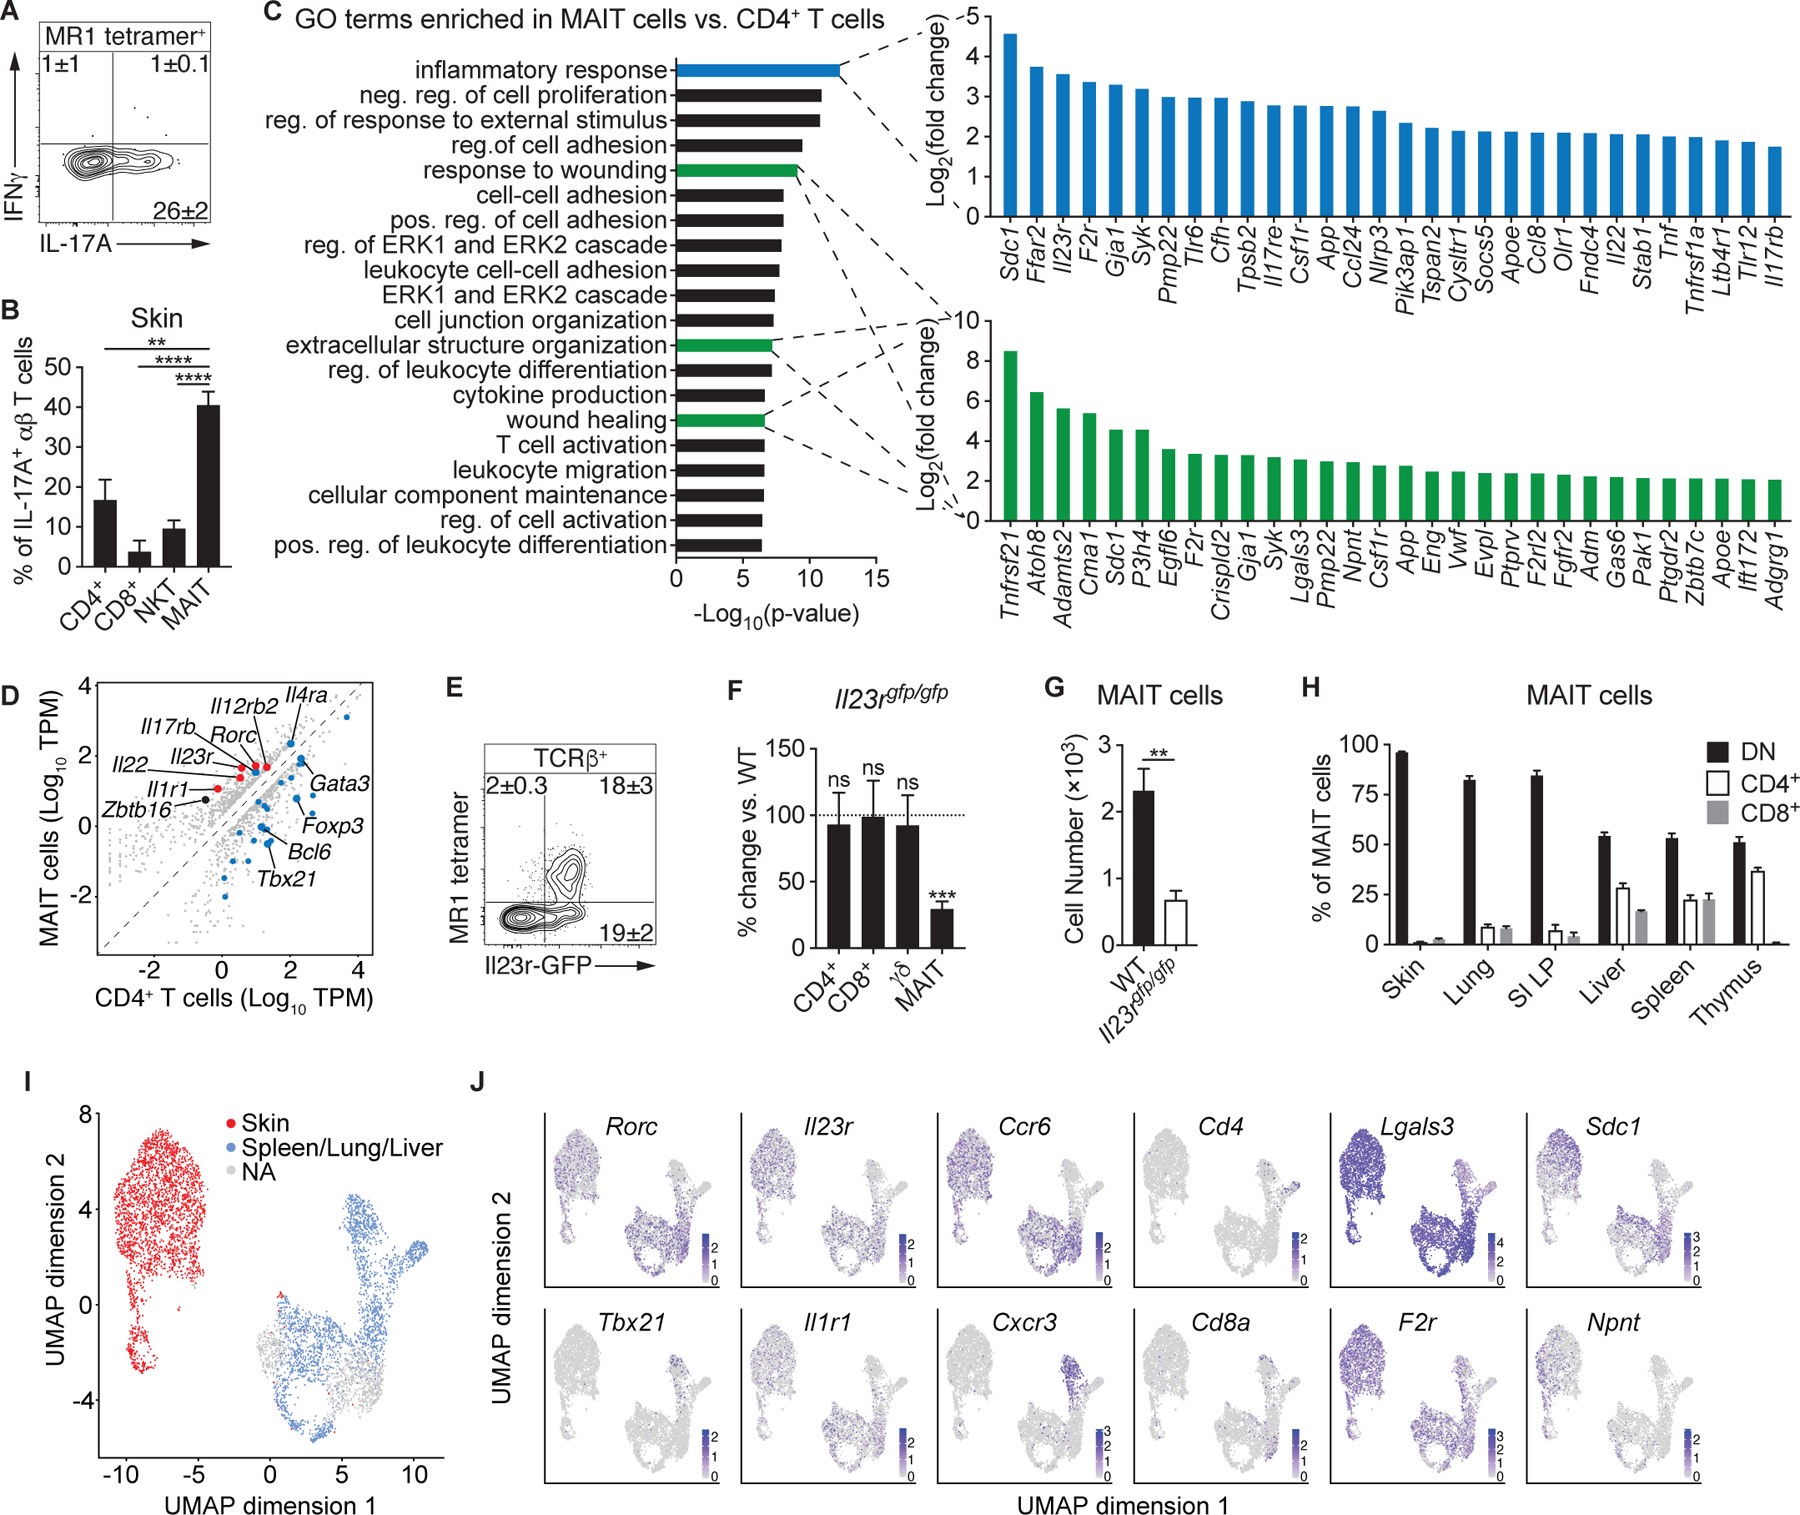
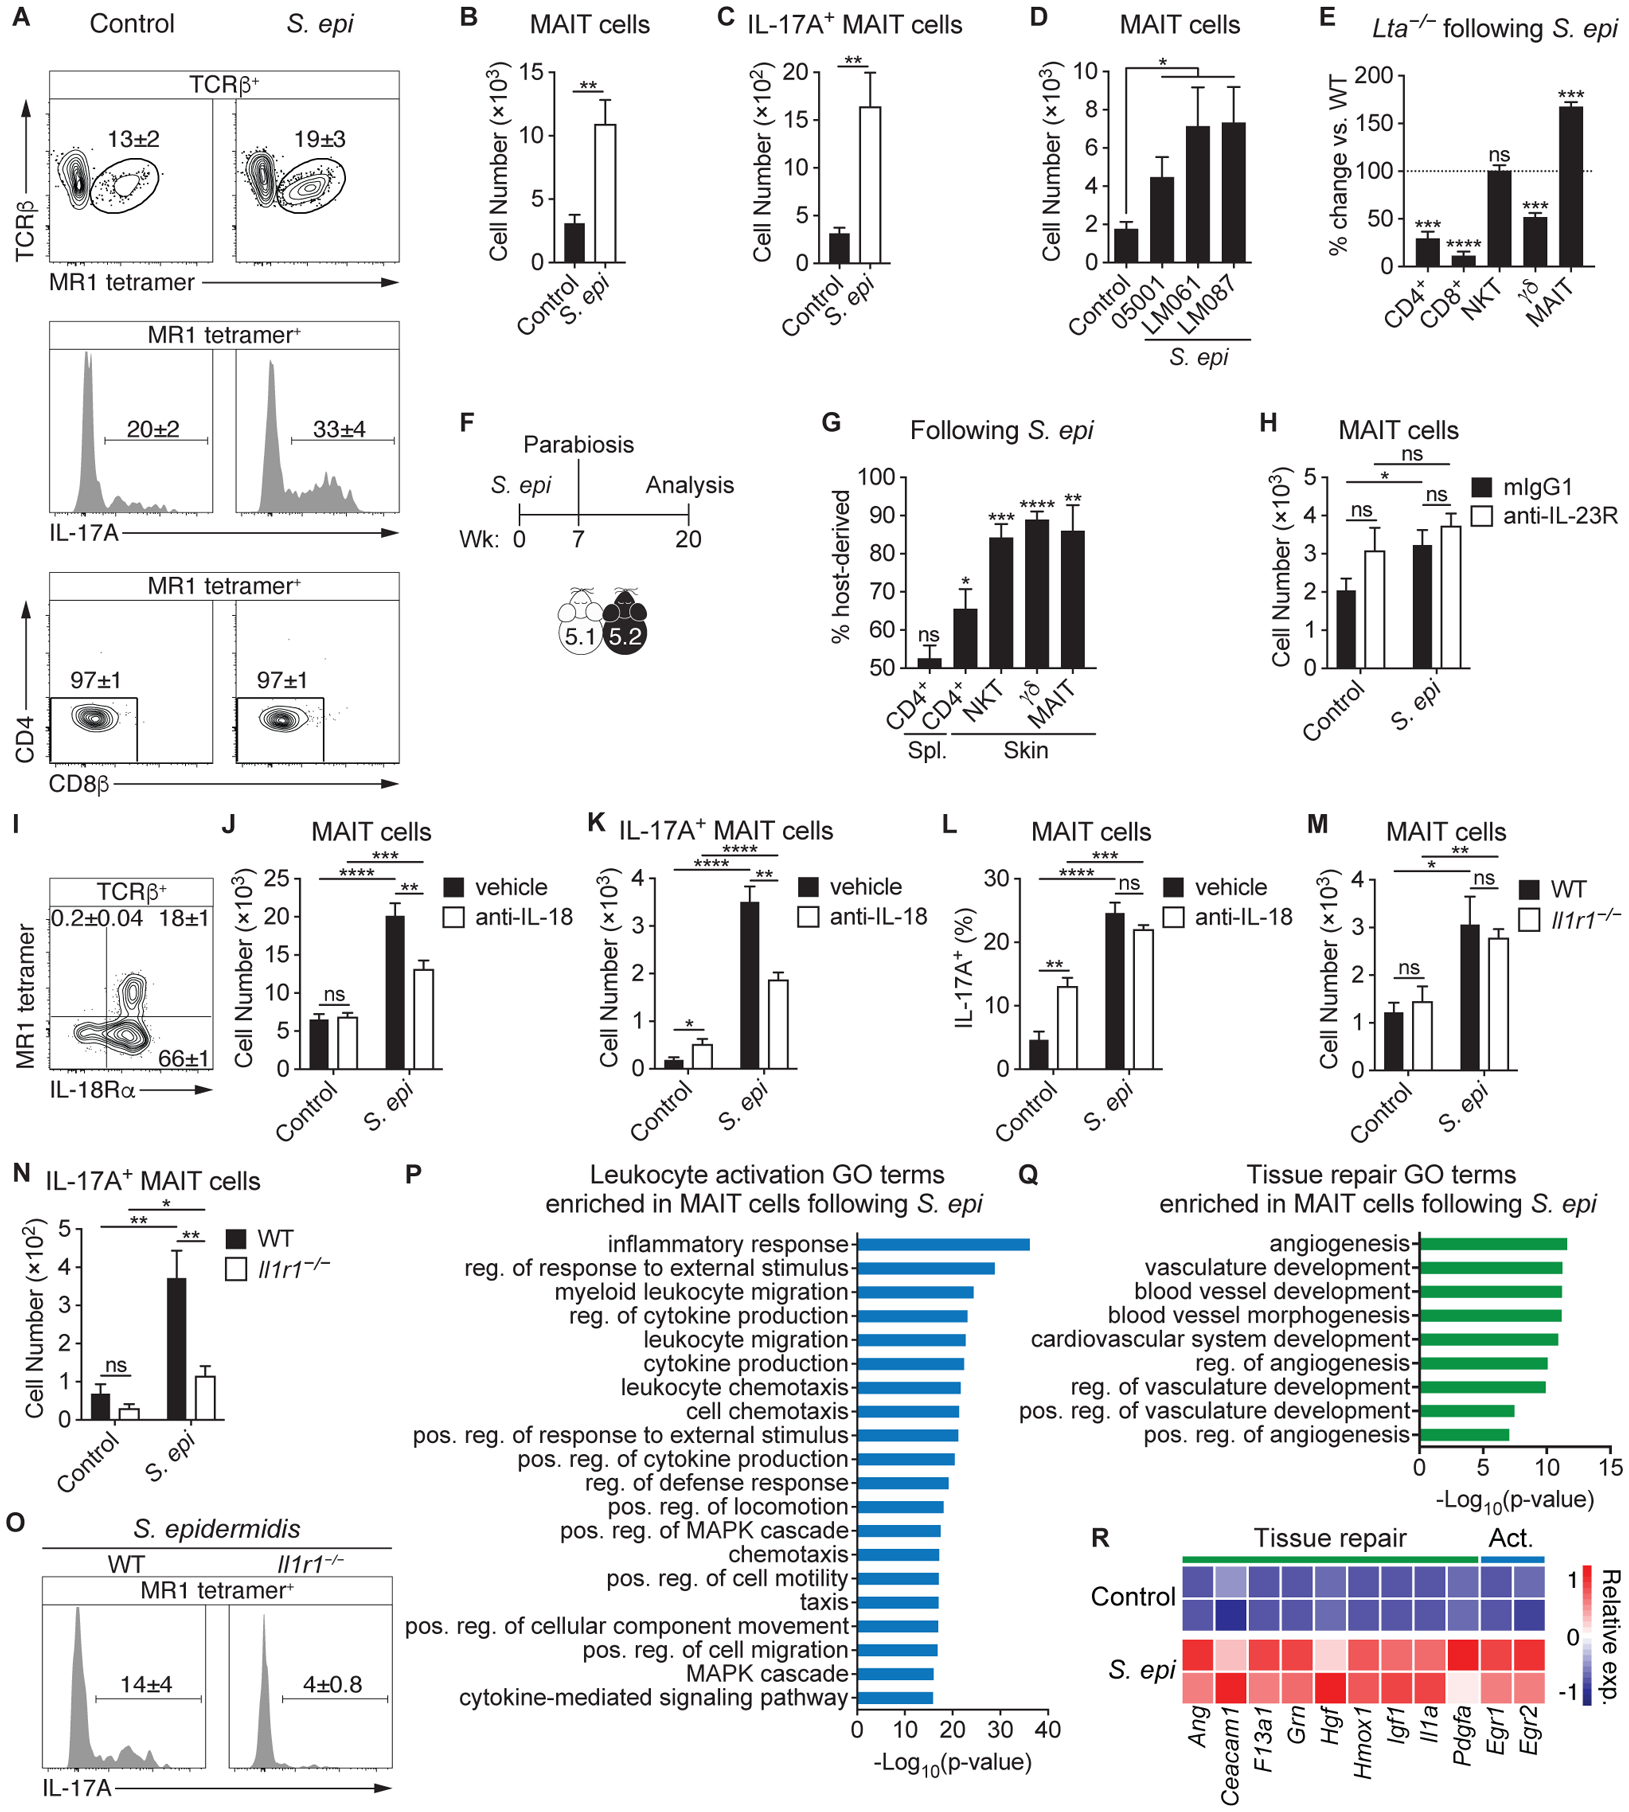
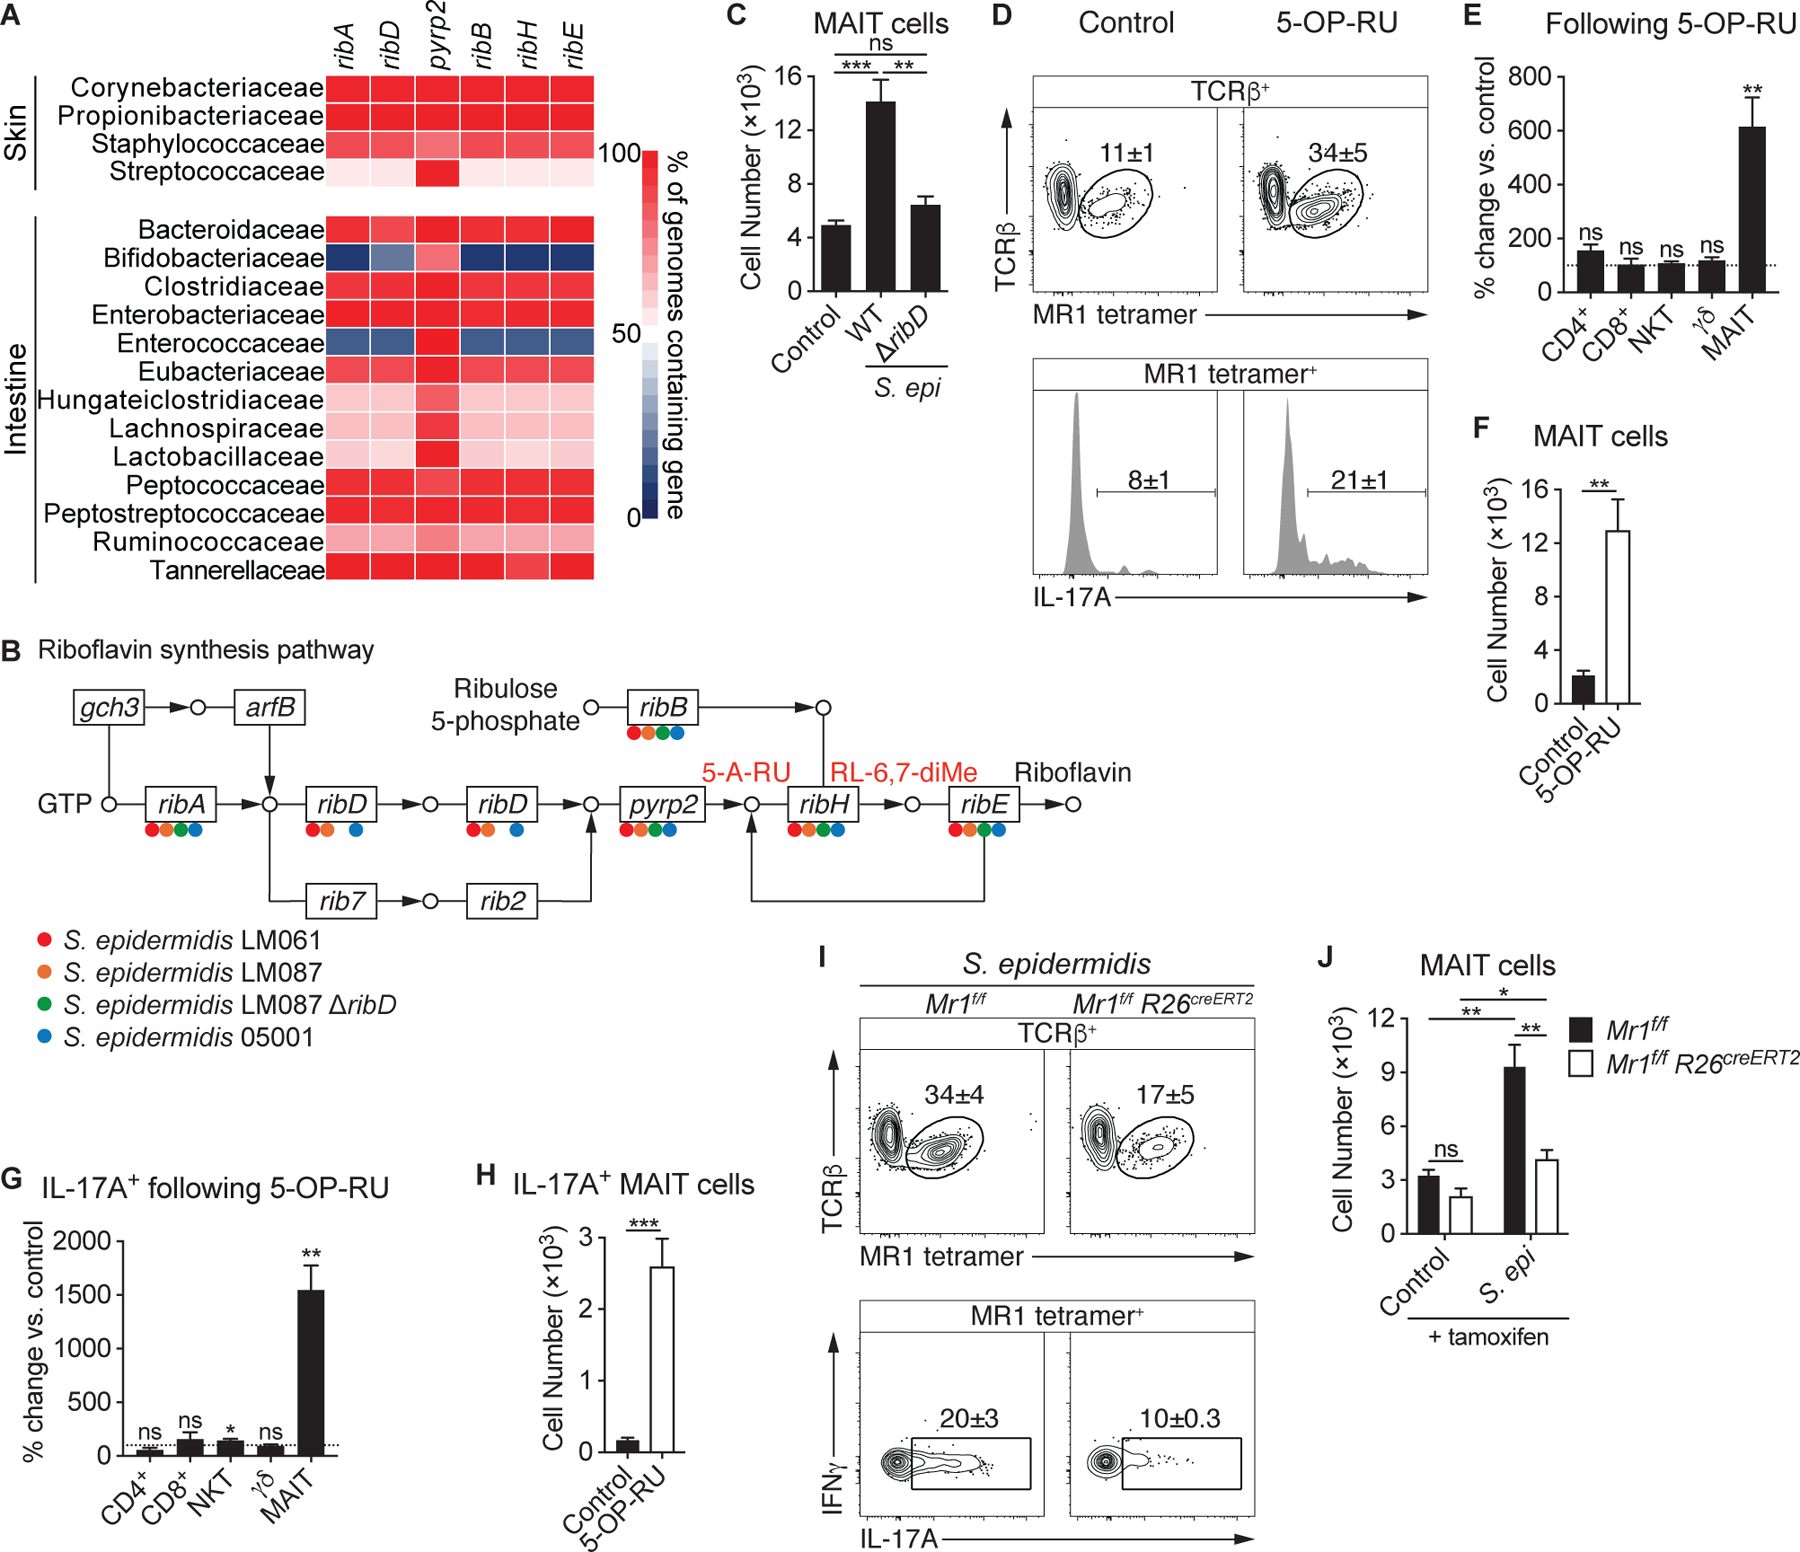
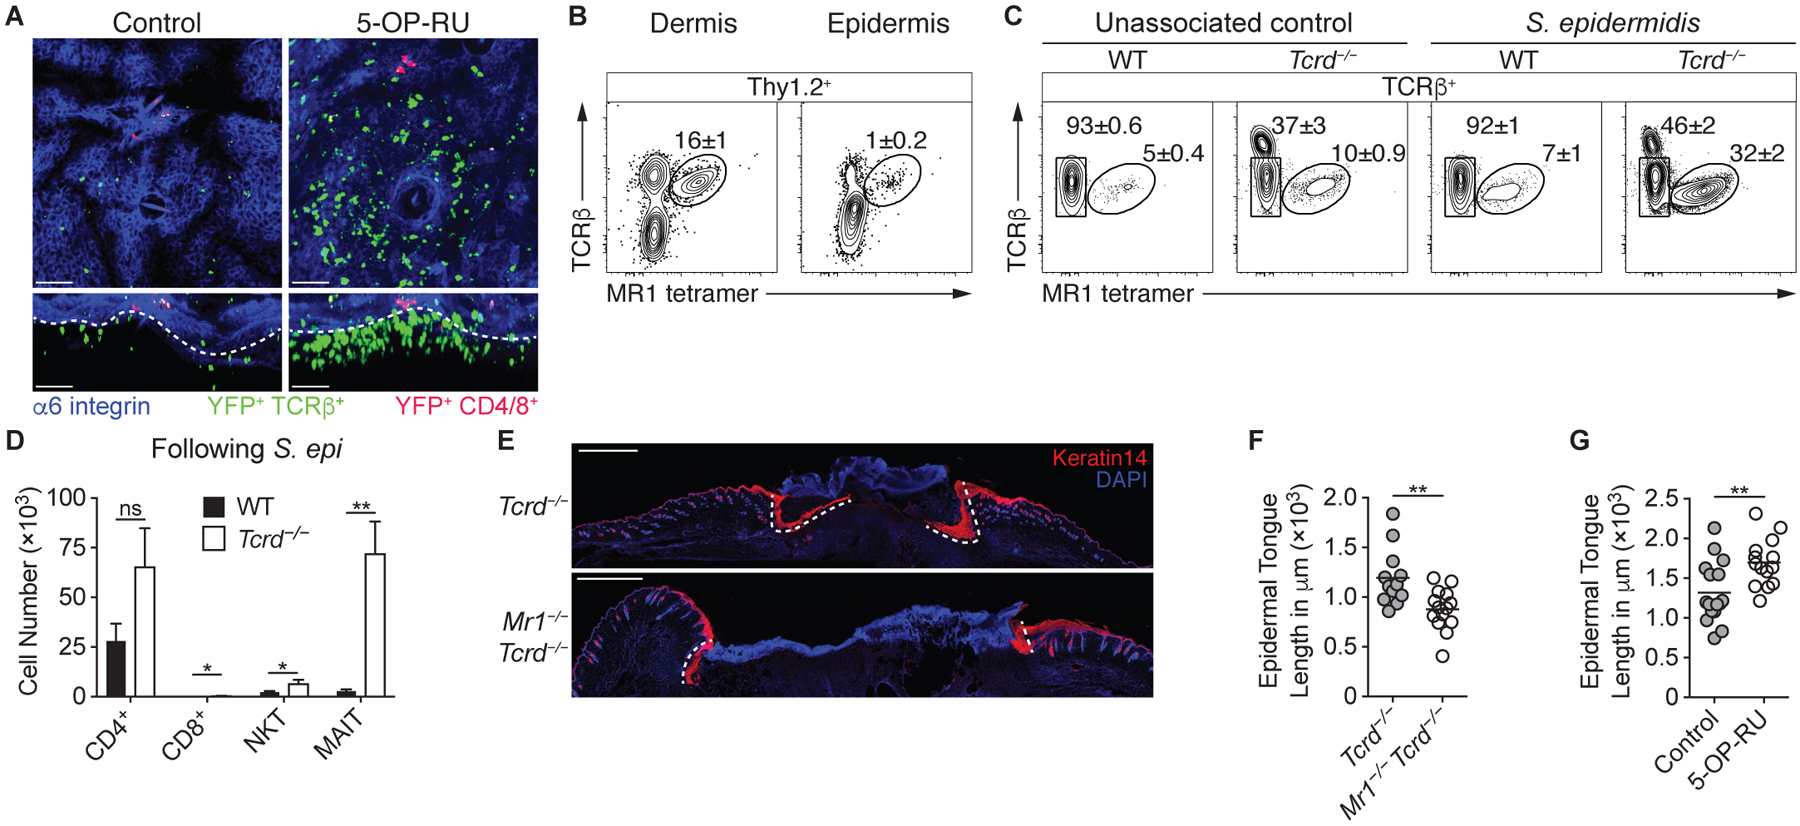
How early-life colonization and subsequent exposure to the microbiota affect long-term tissue immunity remains poorly understood. Here, we show that the development of mucosal-associated invariant T (MAIT) cells relies on a specific temporal window, after which MAIT cell development is permanently impaired. This imprinting depends on early-life exposure to defined microbes that synthesize riboflavin-derived antigens. In adults, cutaneous MAIT cells are a dominant population of interleukin-17A (IL-17A)-producing lymphocytes, which display a distinct transcriptional signature and can subsequently respond to skin commensals in an IL-1-, IL-18-, and antigen-dependent manner. Consequently, local activation of cutaneous MAIT cells promotes wound healing. Together, our work uncovers a privileged interaction between defined members of the microbiota and MAIT cells, which sequentially controls both tissue-imprinting and subsequent responses to injury.


Conflict of interest statement

Competing interests: Authors declare no competing interests.

Figures

Fig. 1.
Fig. 1.. Early-life exposure to riboflavin-synthesizing commensals is required for MAIT cell development.
(A) Percentage of T cells (TCRβ+ or TCRγδ+) that are MAIT, NKT, or γδ T cells in wild-type (WT) mice. “SI LP” denotes small intestine lamina propria. (B) Percentage of MAIT cells among αβ T cells in specific-pathogen-free (SPF) and germ-free (GF) WT mice. (C) Flow cytometry of TCRβ+ lymphocytes from the skin of SPF and GF WT mice. (D-E) Analysis of SPF mice housed in different cages (denoted a-g). (D) Flow cytometry of TCRβ+ lymphocytes from the skin of mice housed in the indicated cages and (E) the percentage of MAIT cells among αβ T cells, with each dot representing an individual mouse. (F) Flow cytometry of CD3+ lymphocytes from a human skin biopsy. (G) 16S ribosomal RNA (rRNA) gene sequencing of feces from WT SPF mice longitudinally sampled from 2–6 weeks of age and the number of MAIT, NKT, and γδ T cells present in WT SPF mice at the corresponding ages. Asterisks denote statistically significant changes in cell number from 2 weeks of age. (H) Neonatal GF mice received oral gavages at 1, 2, and 3 weeks after birth, while adult GF mice received oral gavages at 7, 8, and 9 weeks of age. Both were analyzed 5 weeks after the initial gavage. (I) Number of MAIT cells in the skin of GF mice administered oral gavages of the 5-species (5-spp.) community (Proteus mirabilis, Klebsiella oxytoca, Enterococcus faecalis, Lactobacillus johnsonii, and Lactobacillus murinus) either as neonates (Neo.) or adults (Ad.) as depicted in (H) or conventionalized (conv.) by cohousing with SPF mice for 3 weeks as adults. (J) Presence of riboflavin synthesis genes in bacteria of the 5-species community and SFB denoted with the appropriate color. 5-amino-6-D-ribitylaminouracil (5-A-RU), which reacts with methylglyoxal to form the MAIT cell antigen 5-(2-oxopropylideneamino)-6-D-ribitylaminouracil (5-OP-RU), and 6,7-dimethyl-8-(1-D-ribityl)lumazine (RL-6,7-diMe), are denoted in red. (K) Number of MAIT cells in the skin of GF mice monocolonized as neonates with the indicated bacterial species compared to GF and SPF controls. (L) PBS solution of 1 mM 5-A-RU and 25 mM methylglyoxal (referred to as 5-OP-RU) was topically applied once per week to the skin of GF mice beginning either at 1 week of age (Neo.) or 7 weeks of age (Ad.). Number of MAIT cells in the skin was assessed 5 weeks after the initial application. Flow cytometry gate frequencies and graphs indicate means ± SEM. Data represent at least two experiments with four or more mice per group. *p<0.05, **p<0.01, ***p<0.001, and ****p<0.0001 as calculated by Student’s t-test. “ns” denotes that comparison was not significant.
Fig. 2.
Fig. 2.. Cutaneous MAIT cells express a type-17 transcriptional program and require homeostatic IL-23.
(A) Flow cytometry of cytokine production by MAIT cells from the skin of WT mice. (B) Percentage of IL-17A+ αβ T cells within WT murine skin that were CD4+, CD8+, NKT, or MAIT cells. (C-D) RNA-sequencing (RNA-seq) data of cutaneous MAIT cells and CD4+ CD25 T cells. (C) Top 20 gene ontology (GO) terms that were enriched in MAIT cells and, for the indicated GO terms, the top 30 genes upregulated in MAIT cells. Positive (pos.), negative (neg.), and regulation (reg.) are abbreviated. (D) Expression plot normalized to transcripts per million (TPM), with a minimum fold change of 2 and FDR < 5%. Type-17 genes are denoted in red and genes associated with Type-1, Type-2, T regulatory, and T helper programs are highlighted in blue. (E) Representative flow cytometry plot of TCRβ+ lymphocytes from the skin of Il23rgfp/+ mice. (F) Percentage change of the indicated T cells in the skin of Il23rgfp/gfp mice compared to WT controls. Statistics denote whether the percentage differs significantly from the WT mean (100%). (G) Number of cutaneous MAIT cells in Il23rgfp/gfp mice and WT controls. (H) Percentage of MAIT cells in the indicated organs that expressed CD4, CD8, or neither coreceptor (double negative; DN). (I-J) Single-cell RNA-seq (scRNA-seq) data of MAIT cells sorted from murine skin, spleen, lung, and liver. Clusters were assigned to “Skin” or “Spleen/Lung/Liver” based on the presence of hashtag oligonucleotides (HTOs) from those tissues. Clusters that did not have a predominance of HTOs from either skin or the other tissues were not assigned (“NA”). (I) UMAP plot displaying the distribution of MAIT cell clusters assigned to skin and the other tissues. (J) UMAP plots depicting expression of the indicated transcripts. Flow cytometry gate frequencies and graphs indicate means ± SEM. Data represent at least two experiments with four or more mice per group. **p<0.01, ***p<0.001, and ****p<0.0001 as calculated by Student’s t-test. “ns” denotes that comparison was not significant.
Fig. 3.
Fig. 3.. Skin-resident MAIT cells respond to cutaneous microbes in an IL-1and IL-18-dependent manner.
(A-C) S. epidermidis LM061 (S. epi) was topically applied to the skin of WT mice on days 0, 2, 4, and 6. Fourteen days after the initial application, animals were compared to unassociated (control) mice. (A) Flow cytometry of TCRβ+ lymphocytes (top), IL-17A production by MAIT cells (middle), and coreceptor expression of MAIT cells (bottom) within the skin. (B) Number of cutaneous MAIT cells and (C) IL-17A+ MAIT cells. (D) Number of cutaneous MAIT cells following topical association with CD8+ T cell-inducing (LM087) and non-inducing (05001 and LM061) strains of S. epidermidis. (E) Both Lta−/− and WT mice were topically associated with S. epidermidis LM087 and the percentage change of T cells in the skin of Lta−/− mice compared to WT controls is depicted. Statistics denote whether the percentage differs significantly from the WT mean (100%). (F-G) (F) CD45.1 (5.1) and CD45.2 (5.2) mice were topically associated with S. epidermidis LM087, conjoined 7 weeks later, and analyzed 13 weeks following parabiosis. (G) Frequency of T cells in the indicated tissues of parabiotic mice that are host-derived. (H) WT mice were injected subcutaneously with 1 mg of either anti-IL-23R antibody or mIgG1 isotype control 2 days before the initial application of S. epidermidis LM061 on day 0 and again on day 6. Number of cutaneous MAIT cells is depicted. (I) Flow cytometry of TCRβ+ lymphocytes from the skin of WT mice. (J-L) WT mice were injected intraperitoneally with either 1 mg of anti-IL-18 antibody or saline (vehicle) 2 days before the initial application of S. epidermidis LM061 on day 0 and again on days 1, 5, 8, and 11. (J) Number of cutaneous MAIT cells and (K) IL-17A+ MAIT cells and (L) percentage of MAIT cells that are IL-17A+ in anti-IL-18-treated and control mice (vehicle) that were associated with S. epidermidis LM061. (M-O) (M) Number of cutaneous MAIT cells and (N) IL-17A+ MAIT cells in Il1r1−/− mice and WT controls associated with S. epidermidis LM061. (O) Flow cytometry of IL-17A production by MAIT cells within the skin of S. epidermidis-associated mice. (P-R) RNA-sequencing data of cutaneous MAIT cells from mice associated with S. epidermidis LM061 and unassociated controls. GO terms enriched in MAIT cells from S. epidermidis-associated mice that are related to (P) leukocyte activation and (Q) tissue repair. Positive (pos.), negative (neg.), and regulation (reg.) are abbreviated. (R) Heatmap depicting relative expression (exp.) of genes associated with tissue repair and leukocyte activation (Act.). Flow cytometry gate frequencies and graphs indicate means ± SEM. Data represent at least two experiments with four or more mice per group. *p<0.05, **p<0.01, ***p<0.001, and ****p<0.0001 as calculated by Student’s t-test. “ns” denotes that comparison was not significant.
Fig. 4.
Fig. 4.. MR1-mediated presentation of riboflavin metabolites is necessary and sufficient for MAIT cell recognition of skin commensals.
(A) Heatmap displaying the abundance of riboflavin synthesis genes among species in the indicated bacterial families. (B) Presence of riboflavin synthesis genes in strains of S. epidermidis denoted with the appropriate color. (C) Number of cutaneous MAIT cells in WT mice associated with either S. epidermidis LM087 or mutant S. epidermidis LM087 ΔribD. (D-H) 5-OP-RU was topically applied to the skin of WT mice on days 0, 2, 4, and 6. Fourteen days after the initial application, animals were compared to untreated (control) mice. (D) Flow cytometry of TCRβ+ lymphocytes (top) and IL-17A production by MAIT cells (bottom) within the skin of 5-OP-RU-treated and control mice. Percentage change of the indicated (E) T cells and (G) IL-17A+ T cells in the skin of mice treated with 5-OP-RU compared to untreated controls. Statistics denote whether the percentage differs significantly from the control mean (100%). Number of cutaneous (F) MAIT cells and (H) IL-17A+ MAIT cells in 5-OP-RU-treated and untreated control mice. (I-J) Mr1f/f R26creERT2 and Mr1f/f littermate controls were injected intraperitoneally with 3 mg of tamoxifen 8, 6, 4, and 2 days prior to the initial association with S. epidermidis LM061 and were analyzed 14 days later. (I) Flow cytometry of TCRβ+ lymphocytes and cytokine production by MAIT cells. (J) Number of cutaneous MAIT cells. Flow cytometry gate frequencies and graphs indicate means ± SEM. Data represent at least two experiments with four or more mice per group. *p<0.05, **p<0.01, and ***p<0.001 as calculated by Student’s t-test. “ns” denotes that comparison was not significant.
Fig. 5.
Fig. 5.. MAIT cells promote tissue repair.
(A) Representative confocal microscopy images of the skin of Il17acre R26-STOP-YFP mice that received topical 5-OP-RU and untreated controls. Projection along the z-axis (top) or x-axis (bottom). Colocalization of YFP and TCRβ is depicted in green, whereas the colocalization of YFP and either CD4 or CD8 is in red. White dashed lines denote the dermal/epidermal interface. Scale bars represent 50 μm. (B) Flow cytometry of Thy1.2+ lymphocytes within the dermis and epidermis of WT mice. (C) Flow cytometry of TCRβ+ lymphocytes from the skin of Tcrd−/− and WT mice either associated with S. epidermidis LM061 or left untreated. Note that the TCRβhi cells in the Tcrd−/− samples are dendritic epidermal T cells (DETCs) that express αβ TCRs. (D) Number of cutaneous T cells in Tcrd−/− and WT mice following association with S. epidermidis LM061. (E-F) S. epidermidis LM061 was topically applied to the backs of MAIT cell-deficient Mr1−/− Tcrd−/− mice and Tcrd−/− littermates on days 0, 2, 4, and 6. Twelve days after the initial application, punch biopsies were taken through the back skin, and animals were assessed 5 days later. (E) Representative immunofluorescence images of back skin wounds 5 days after punch biopsies. Tissue sections were immunolabeled with Keratin 14 (red), which stains the advancing epidermal tongues (demarcated with white dashed lines) during re-epithelialization of the wounds. Scale bars represent 1 mm. (F) Quantification of the epidermal tongue length 5 days after wounding, with each dot representing the measured length of an individual epidermal tongue. (G) 5-OP-RU was topically applied to the backs of WT mice on days 0, 2, 4, and 6. Twelve days after the initial application, punch biopsies were taken through the back skin, and animals were assessed 5 days later, when epidermal tongue lengths were quantified. Flow cytometry gate frequencies and graphs indicate means ± SEM. Data represent at least two experiments with four or more mice per group. *p<0.05 and **p<0.01 as calculated by Student’s t-test. “ns” denotes that comparison was not significant.

Comment in

Similar articles

Cited by

References

    1. Belkaid Y, Hand TW, Role of the microbiota in immunity and inflammation. Cell 157, 121–141 (2014). - PMC - PubMed
    1. Rooks MG, Garrett WS, Gut microbiota, metabolites and host immunity. Nat Rev Immunol 16, 341–352 (2016). - PMC - PubMed
    1. Gollwitzer ES et al., Lung microbiota promotes tolerance to allergens in neonates via PD-L1. Nat Med 20, 642–647 (2014). - PubMed
    1. Scharschmidt TC et al., A Wave of Regulatory T Cells into Neonatal Skin Mediates Tolerance to Commensal Microbes. Immunity 43, 1011–1021 (2015). - PMC - PubMed
    1. Mao K et al., Innate and adaptive lymphocytes sequentially shape the gut microbiota and lipid metabolism. Nature 554, 255–259 (2018). - PubMed

Publication types

MeSH terms