. 2019 Oct 24;10(1):4862.
doi: 10.1038/s41467-019-12412-1.

Fate-mapping post-hypoxic tumor cells reveals a ROS-resistant phenotype that promotes metastasis

Affiliations

Fate-mapping post-hypoxic tumor cells reveals a ROS-resistant phenotype that promotes metastasis

Inês Godet et al. Nat Commun. .

Abstract

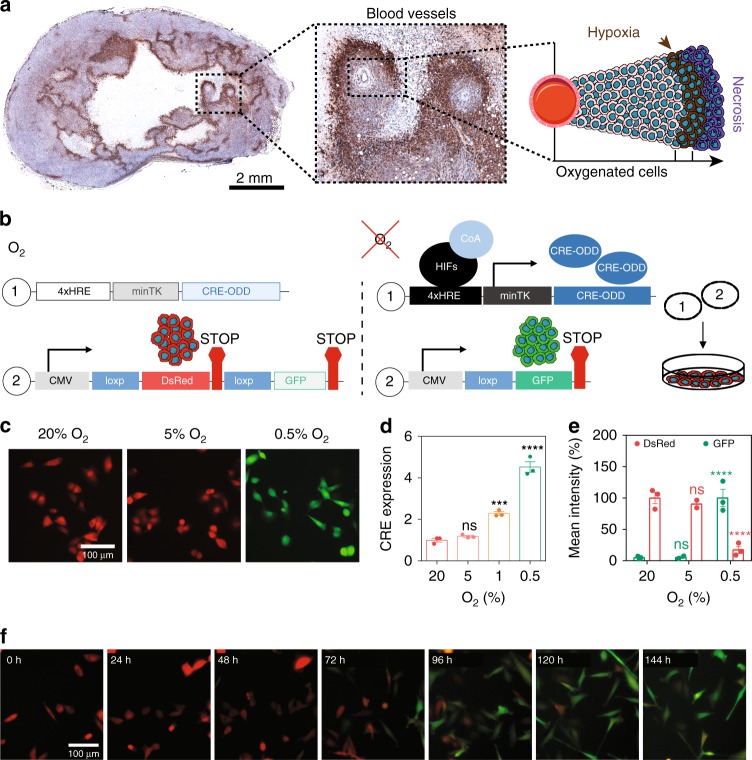
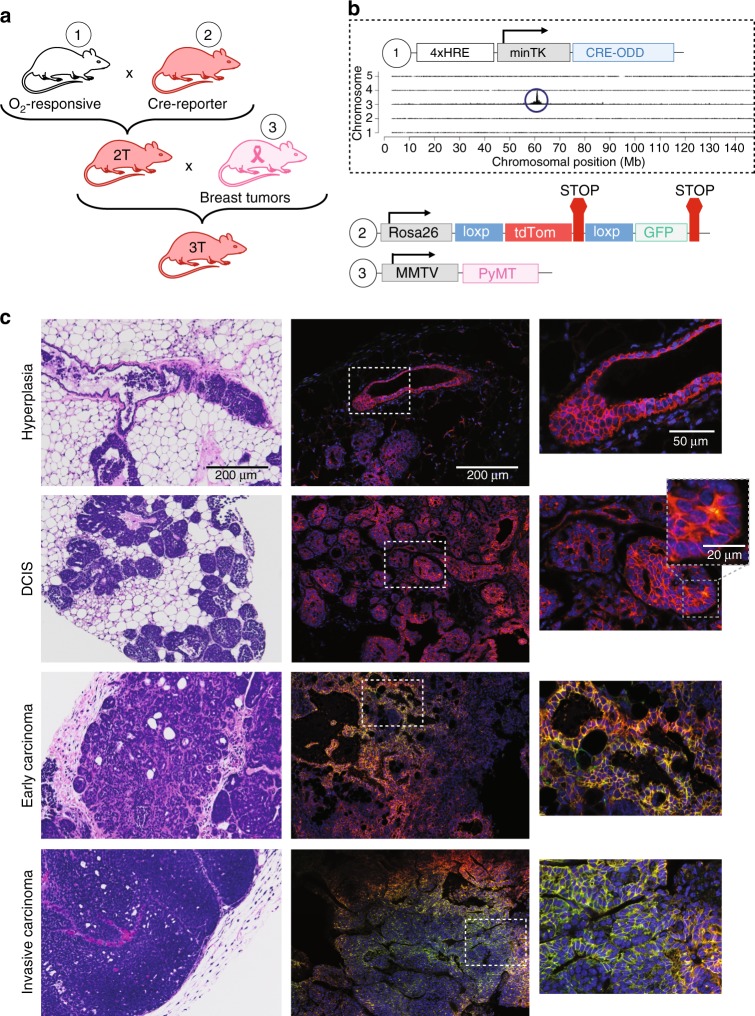
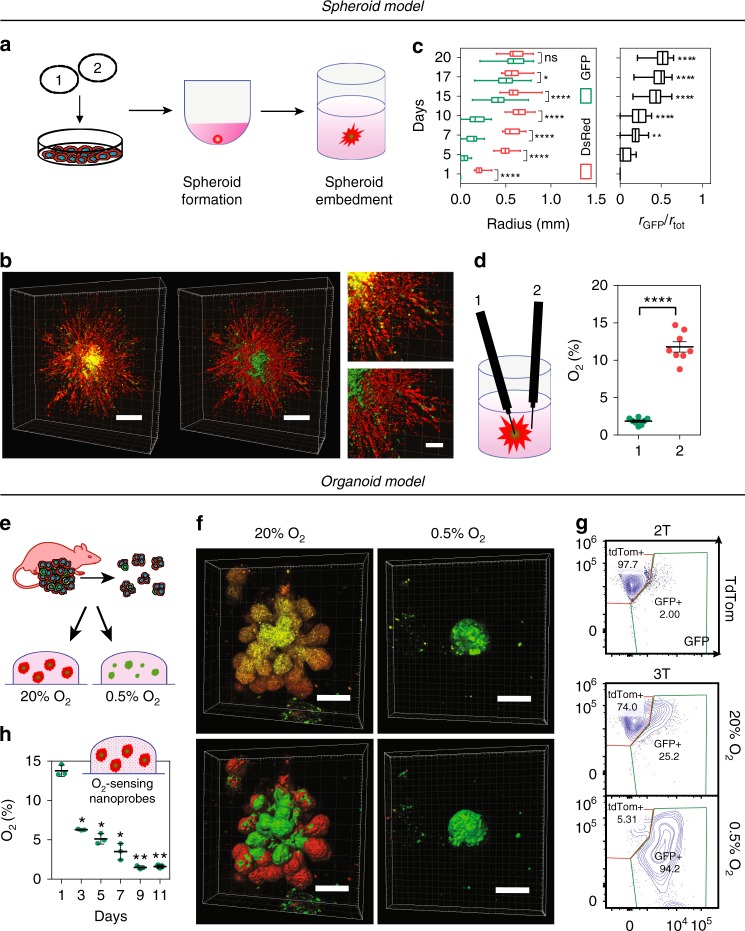
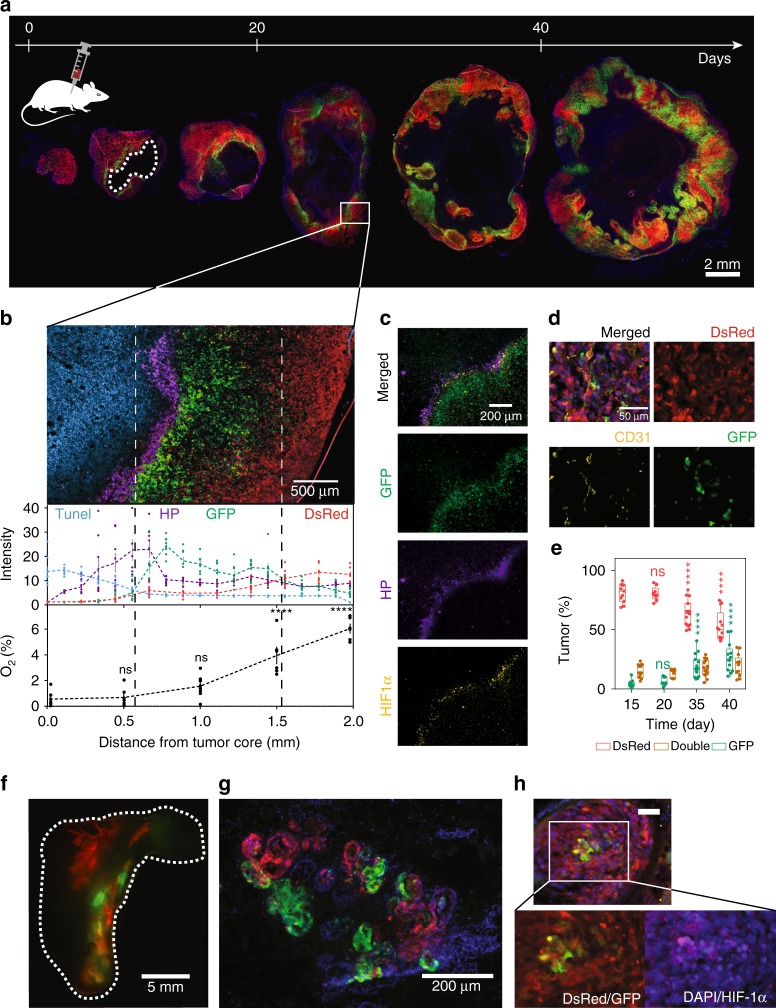
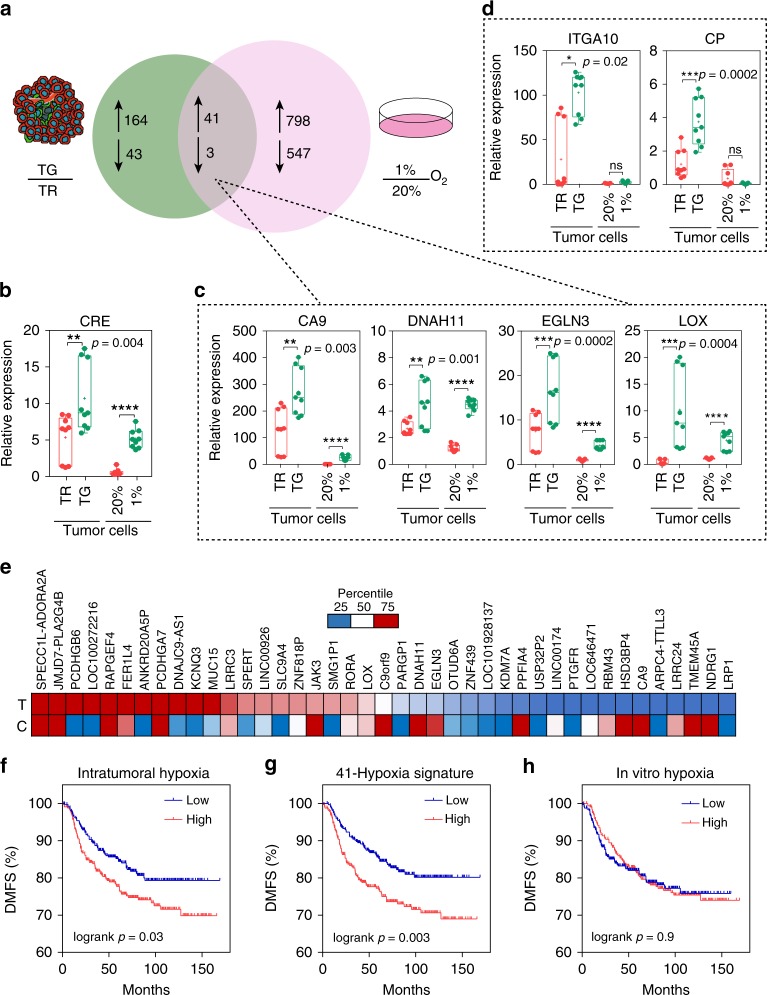
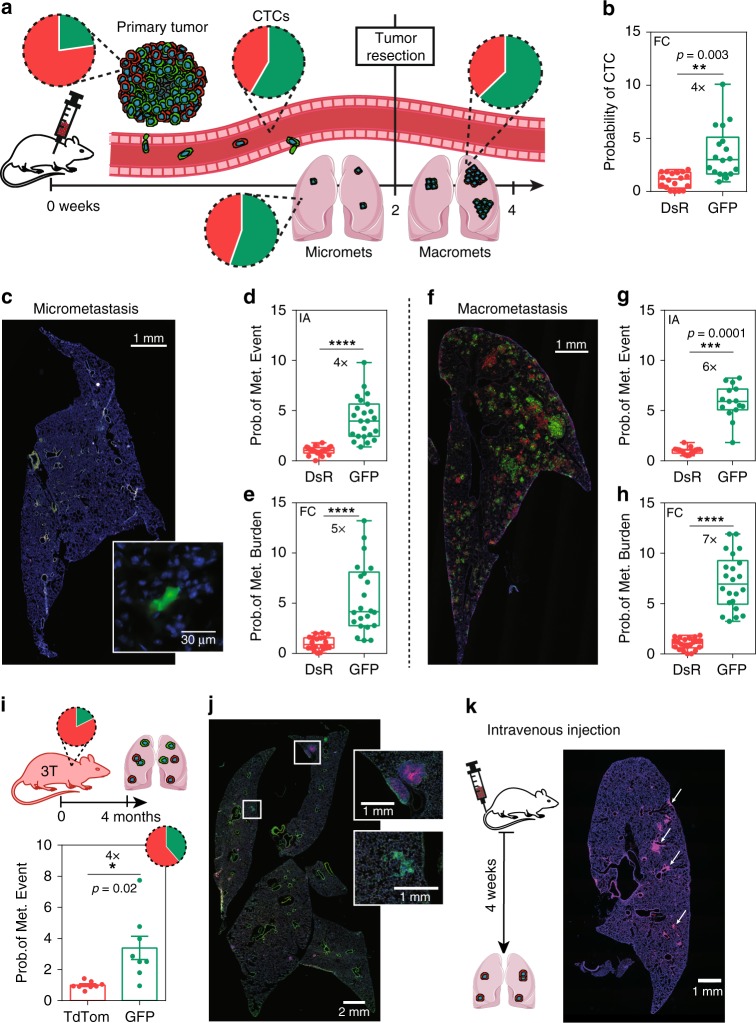
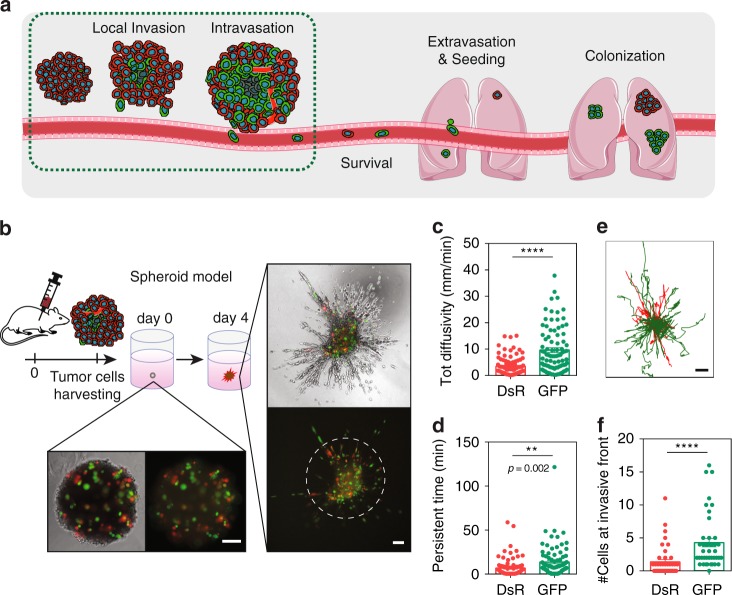
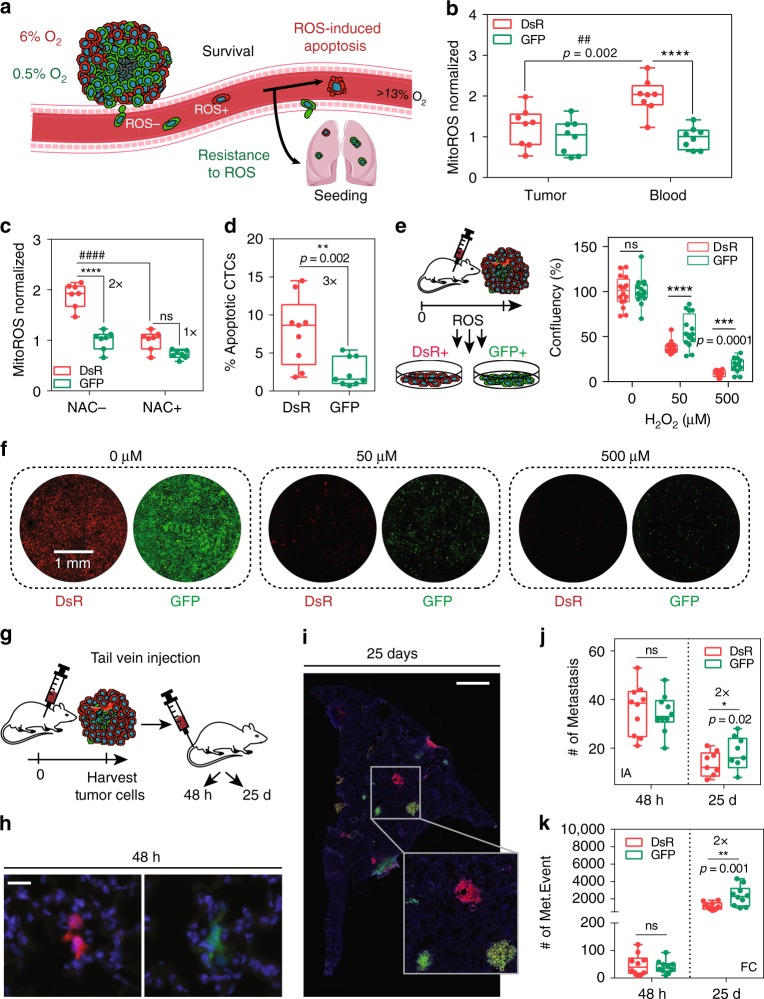
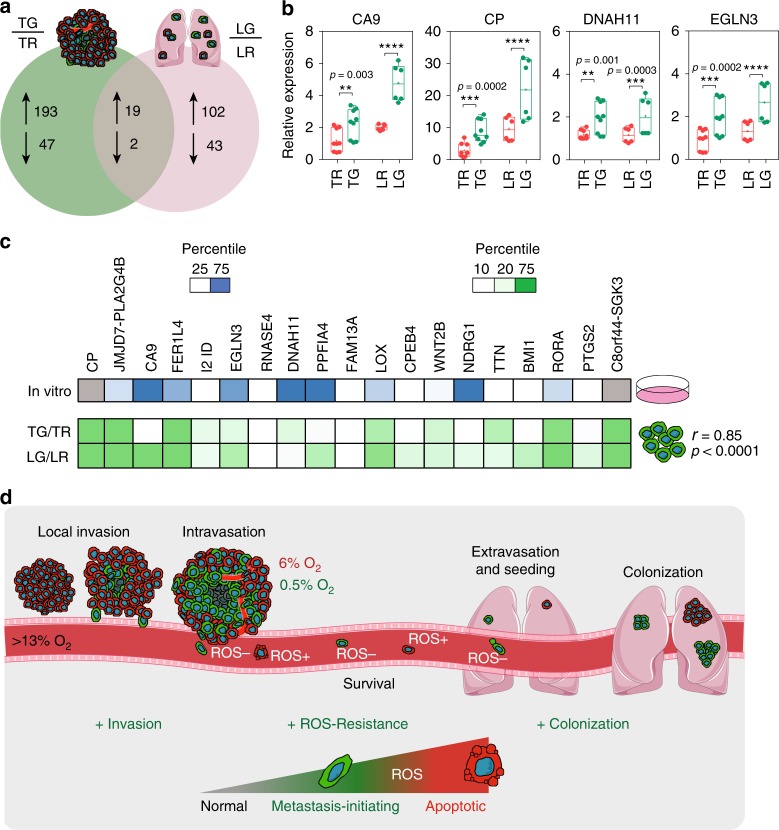
Hypoxia is known to be detrimental in cancer and contributes to its development. In this work, we present an approach to fate-map hypoxic cells in vivo in order to determine their cellular response to physiological O2 gradients as well as to quantify their contribution to metastatic spread. We demonstrate the ability of the system to fate-map hypoxic cells in 2D, and in 3D spheroids and organoids. We identify distinct gene expression patterns in cells that experienced intratumoral hypoxia in vivo compared to cells exposed to hypoxia in vitro. The intratumoral hypoxia gene-signature is a better prognostic indicator for distant metastasis-free survival. Post-hypoxic tumor cells have an ROS-resistant phenotype that provides a survival advantage in the bloodstream and promotes their ability to establish overt metastasis. Post-hypoxic cells retain an increase in the expression of a subset of hypoxia-inducible genes at the metastatic site, suggesting the possibility of a 'hypoxic memory.'


Conflict of interest statement

The authors declare no competing interests.

Figures

Fig. 1
Fig. 1
Establishing a hypoxia fate-mapping system. a A full cross section of a mouse mammary tumor stained with Hypoxyprobe™ (brown). The inset shows cancer cells surrounding two blood vessels. The cartoon depicts the spatial distribution of hypoxic cells (brown) adjacent to necrotic cells (purple) and oxygenated cells (pink). b Two lentiviral vectors used to generate a hypoxia fate-mapping system. c Fluorescent images of MDA-MB-231 hypoxia fate-mapping cells following exposure to 20%, 5%, or 0.5% O2 for 7 days. Scale bar: 100 μm. d Relative expression of CRE mRNA levels measured by qPCR in hypoxia fate-mapping MDA-MB-231 cells exposed to 20%, 5%, 1%, or 0.5% O2 (mean ± SEM, N = 1, n = 3); ****P < 0.0001 versus 20% (one-way ANOVA with Bonferroni posttest). e Normalized quantification of flow cytometry analysis of MDA-MB-231 hypoxia fate-mapping cells following exposure to 20%, 5%, or 0.5% O2 for 7 days (mean ± SEM, N = 2–3, n > 10,000 for 20%, 5%, and 0.5% O2); ****P < 0.0001 versus 20% DsRed or GFP (Two-way ANOVA with Bonferroni posttest). f Fluorescent live-cell time-lapse imaging of MDA-MB-231 hypoxia fate-mapping cells cultured under 0.5% O2 imaged over a 6-day time course (see also Supplementary movie 1)
Fig. 2
Fig. 2
Establishing a hypoxia fate-mapping triple-transgenic mouse model. a Design of a triple-transgenic mouse generated by (1) developing a transgenic mouse that produces Cre recombinase in cells exposed to hypoxia followed by (2) breeding to the mT/mG reporter mouse (Jackson Labs; 007676). The double-transgenic mouse (2 T) was then crossed to a (3) mouse expressing the MMTV promoter-driven PyMT oncogene that develops spontaneous breast tumors (3 T). b TLA sequence coverage across the mouse genome by using primer sets 1 and 2 (Supplementary Table 2) was conducted to determine the location of our transgene. The 4xHRE-CRE-ODD transgene integrated at chromosome 3 position 61,062,240. c Triple-transgenic mice were sacrificed at different time points over a 4-month period in order to detect hypoxic cells during breast cancer progression from hyperplasia, to ductal carcinoma in situ (DCIS), to early carcinoma and invasive late-stage carcinoma. H&E-stained sections of paraffin-embedded tissue (left) or fluorescent imaging of frozen tissue sections (right). Marked insets are displayed on the right. The second inset at the DCIS stage highlights early detection of hypoxia
Fig. 3
Fig. 3
Fate mapping of hypoxic cells in 3D models. a Hypoxia fate-mapping cells were used to generate 3D spheroid cultures. Spheroids were formed in spheroid formation media in round-bottom well plates and transferred to the center of 3D collagen matrices 72 h later. b 3D reconstruction of a spheroid imaged after 15 days in culture and correspondent 3D surface rendering (right and bottom). Scale bar: 500 μm (left), 200 μm (right). c Analysis of color distribution measured along the spheroid radius (mean ± SEM, N = 3, n = 27); ****P < 0.0001 GFP versus DsRed on each day (Two-way ANOVA with Bonferroni posttest) (left). Length of the GFP+ radius (rGFP) over the total spheroid radius (rtot) (mean ± SEM, N = 3, n = 27); ****P < 0.0001 versus day 5 (one-way ANOVA with Bonferroni posttest) (right). The box extends from the 25th to 75th percentiles, the median is marked by the vertical line inside the box, and the whiskers represent the minimum and maximum points. d O2 measurements in the core (1) or periphery (2) of MDA-MB-231 spheroids following 20 days in culture under 20% O2 (mean ± SEM, N = 8); ****P < 0.0001 position 1 versus 2 (two-tailed t-test). e Organoids derived from 3 T mouse tumors were embedded in 3D in Matrigel and cultured under 20% or 0.5% O2. f 3D reconstruction of fluorescent images of organoids following 10 days of culture under 20% or 0.5% O2 with corresponding 3D surface rendering (bottom). Scale bar: 100 μm. g Representative contour plots of flow cytometry data from 3 T mouse tumor organoids cultured under 20% or 0.5% O2 for 20 days. 2 T tumor organoids were used to define tdTom+ and GFP+ gates for flow cytometry analysis (Supplementary Fig. 4d). h O2 measurements performed by using OXNANO nanoprobes dispersed in 3D Matrigel surrounding embedded organoids (mean ± SEM, N = 3, n > 200); ****P < 0.0001 versus day 1 (matched one-way ANOVA with Bonferroni posttest)
Fig. 4
Fig. 4
Implementing a hypoxia fate-mapping system in breast cancer models. a Fluorescent images of full cross sections of orthotopic mammary tumors derived from MDA-MB-231 hypoxia fate-mapping cells. Tumors were excised at various times over a 45-day period and sectioned for imaging. The white dashed line outlines the necrotic core. b Fluorescent images of DsRed and GFP expression, and TUNEL (blue) and Hypoxyprobe™ (purple) labeling. Normalized intensity plots for each fluorophore (top) (mean ± SEM, n = 8), or O2 measurements (bottom) are displayed as a function of distance from the tumor core. O2 measurements were performed by using a fixed-needle microprobe (mean ± SEM, N = 8; ****P < 0.0001 vs. 0 (one-way ANOVA with Bonferroni posttest). c Fluorescent images of GFP expression and Hypoxyprobe™ (purple) and HIF-1α (yellow) immunofluorescent labeling. d Fluorescent images of DsRed and GFP expression, and CD31 (yellow) immunofluorescent labeling to detect endothelial cells lining blood vessels in a tumor region far from the necrotic core. e Full tumor cross sections were imaged in tiles, linearly stitched, binarized by ImageJ, and used to determine the ratio of DsRed-, double- (both DsRed and GFP), and GFP-positive areas of MDA-MB-231 orthotopic tumors (see Supplementary Fig. 5b for an illustration of the calculation method). Ratios (%) are displayed in the graph at different time points of tumor progression (mean ± SEM, N = 3, n = 48); ****P < 0.0001 versus day 15 (Two-way ANOVA with Bonferroni posttest). The box extends from the 25th to 75th percentiles, the median is marked by the vertical line inside the box, and the whiskers represent the minimum and maximum points. f MCF7 hypoxia fate-mapping cells were injected into the nipple and delivered to a single ductal tree of multiparous NSG mice. A whole mount of the mammary fat pad was imaged by fluorescent microscopy 60 days after injection. g Tissue sections were stained with DAPI to detect cell nuclei and imaged for DsRed and GFP. h Tissue sections were stained with DAPI to detect cell nuclei and labeled with a HIF-1α antibody. Scale bar: 50 μm
Fig. 5
Fig. 5
Hypoxia fate-mapping system facilitates profiling of intratumoral hypoxia. a Tumors derived from hypoxia fate-mapping MDA-MB-231 cells were harvested 2 weeks after implantation and sorted into DsRed+/GFP− or GFP+ populations directly into Trizol (N = 2). Venn diagram displaying the overlap of the number of genes with differential expression (−1.5 ≥ FC ≥ 1.5) in GFP+ versus DsRed+ tumor cells (green circle) and MDA-MB-231 cells exposed to 1% O2 versus 20% O2 (pink circle) (Supplementary Table 6). bd Relative expression of mRNA measured by qPCR in tumor-derived cells (TG or TR) or MDA-MB-231 cells exposed to 20% or 1% O2 in vitro, b CRE, c genes co-regulated by intratumoral and in vitro hypoxia (CA9, DNAH11, EGLN3, and LOX), and d genes exclusive to upregulation upon intratumoral hypoxia (ITGA10 and CP) (mean ± SEM, N = 3, n = 3); ****P < 0.0001 TG versus TR and 1% versus 20% (two-tailed t-test). The box extends from the 25th to 75th percentiles, the median is marked by the vertical line inside the box, and the whiskers represent the minimum and maximum points. e Heat map of the 41-gene signature derived from the overlap of intratumoral and in vitro hypoxia. The distribution of the relative fold change of each gene in the 41-gene signature is displayed for GFP+ versus DsRed+ sorted tumor cells (T) or cells (C) exposed to 1% versus 20% O2 conditions. Genes with fold change higher than 75% of the fold change of genes in the set are red and genes with fold change lower than 25% of the fold change of genes in the set are blue (Pearson correlation factor r = 0.84 and P = 9.6 × 10−7). fh Microarray expression data from 664 breast cancer patients were used to perform multigene survival analysis (n = 664; HGU133 plus 2.0 arrays, KMplotter). Kaplan–Meier analysis of distant metastasis-free survival (DMFS) of breast cancer patients stratified by high or low expression by using f the 40 most induced genes by intratumoral hypoxia, g the 41-gene signature derived from the overlap of intratumoral and in vitro hypoxia, or h the 40 most induced genes by in vitro hypoxia
Fig. 6
Fig. 6
Post-hypoxic cells have enhanced metastatic potential. a Orthotopic tumors derived from MDA-MB-231 hypoxia fate-mapping cells. Blood, lungs, and tumor were harvested at 2 weeks for half of the mouse cohort. Surgical tumor resection was performed on the second half of the cohort, and lungs were harvested 2 weeks after tumor removal to assess late-stage metastasis. Pie charts represent the ratio of DsRed+ to GFP+ cells in each site. b The probability of a GFP+ (or DsRed+) CTC in the blood was obtained by dividing the percentage of GFP+ (or DsRed+) CTCs detected in the bloodstream with the percentage of GFP+ (or DsRed+) cells in the matched primary tumor (N = 3, n = 17) by using flow cytometry (FC); ****P < 0.0001 GFP versus DsRed (two-tailed t-test). c Cross-sectional imaging of DsRed and GFP expression and DAPI labeling of lung micrometastasis at week 2. The inset shows magnified GFP+ micrometastasis. d, e The probability of a GFP+ metastatic event in the lung is obtained by dividing the percentage of GFP+ micrometastases by the percentage of GFP+ cells in the matched primary tumor by using d image analysis or e flow cytometry (N = 3, IA: n = 23; FC: n = 22); ****P < 0.0001 GFP versus DsRed (two-tailed t-test). The box extends from the 25th to 75th percentiles, median is marked by the line inside the box, and whiskers represent the minimum and maximum. f Cross-sectional imaging of DsRed and GFP expression and DAPI labeling of lung macrometastasis 2 weeks after tumor resection. g, h The probability of a GFP+ metastatic event in the lung is obtained by dividing the percentage of individual GFP+ macrometastatic colonies by the percentage of GFP+ cells in the matched primary tumor by using g image analysis or h flow cytometry (N = 3, IA: n = 16; FC: n = 22); ****P < 0.0001 GFP versus DsRed (two-tailed t-test). i, j Tumor and lungs from triple-transgenic mice were harvested at 4 months of age. Probability of lung metastatic events was obtained as described in g (mean ± SEM, N = 8); ****P < 0.0001 GFP versus tdTom (two-tailed t-test). k MDA-MB-231 hypoxia fate-mapping cells were injected into the tail vein of NSG mice and harvested 5 weeks later
Fig. 7
Fig. 7
Exposure to intratumoral hypoxia promotes invasion. a Schematic representation of the early and late steps of the metastatic cascade. b Tumor-derived cells were incorporated with 90% non-labeled wild-type MDA-MB-231 cells in a 3D spheroid fully embedded in collagen. After 4 days in culture, spheroids were subjected to time-lapse imaging every 5 min for 16 h. Phase-contrast and fluorescent images taken on days 0 and 4 of the same spheroid. Scale bar = 100 μm. The white dashed ring marks the invasive front of the spheroid. c, d Total diffusivity (mm/min) (c) and persistent time (min) (d) of DsRed+ and GFP+ (mean ± SEM, N = 3, n = 80–92 cells); ****P < 0.0001 GFP versus DsRed (two-tailed t-test). e Projection of DsRed+ (red) or GFP+ (green) cell trajectories. Scale bar = 100 μm. f Number of DsRed+ and GFP+ cells at the invasive front of the spheroid (beyond the dashed white line in (b)) (mean ± SEM, N = 3, n = 44 spheroids); ****P < 0.0001 GFP versus DsRed (two-tailed t-test)
Fig. 8
Fig. 8
Post-hypoxic CTCs have ROS-resistant phenotype. a Schematic representation of the proposed mechanism. Post-hypoxic cells (GFP+) are resistant to ROS and have a survival advantage over DsRed+ cells in the bloodstream. b Mitochondrial ROS levels were measured by using MitoROS by flow cytometry in matched tumor and blood samples freshly harvested from mice (N = 2, n = 8); ****P < 0.0001 GFP versus DsRed and ####P < 0.0001 tumor versus blood (Two-way ANOVA with Bonferroni posttest). The box extends from the 25th to 75th percentiles, the median is the vertical line inside the box, and the whiskers represent the minimum and maximum. c Freshly isolated CTCs were treated with the ROS inhibitor N-acetylcysteine (NAC) for 1 h, and ROS levels were measured using MitoROS by flow cytometry (N = 1, n = 7); ****P < 0.0001 GFP versus DsRed and ####P < 0.0001 NAC– versus NAC+ (Two-way ANOVA with Bonferroni posttest). d Cell viability was measured by using Sytox Blue by flow cytometry (N = 1, n = 9); ****P < 0.0001 GFP versus DsRed (two-tailed t-test). e, f Tumor-derived cells sorted for DsRed+ or GFP+ expression were treated ex vivo with H2O2 for 1 h and f were quantified 48 h later by image analysis by using nuclei segmentation to determine cell confluence (e) (N = 4, n = 16); ****P < 0.0001 GFP versus DsRed (Two-way ANOVA with Bonferroni posttest). g Tumor-derived hypoxia fate-mapping cells (1 × 105 cells) were injected directly into the tail vein of NSG mice. Organs were harvested either 48 h or 25 days after injection. h, i Cryo-sections of the lung were stained with DAPI and imaged for DsRed and GFP to detect micrometastasis after 48 h (h) or macrometastasis after 25 days (i). Scale bar: 50 μm (h), 1 mm (i). j Quantification of the number of metastatic events by image analysis of mounted lung sections after 48 h or 25 days (N = 1, n = 9–10); ****P < 0.0001 GFP versus DsRed (Two-way ANOVA with Bonferroni posttest). k Quantification of metastatic burden by flow cytometry analysis of lungs after 48 h or 25 days (N = 1, n = 10); ****P < 0.0001 GFP versus DsRed (Two-way ANOVA with Bonferroni posttest)
Fig. 9
Fig. 9
Post-hypoxic ‘memory’ at the metastatic site. a Venn diagram displaying the overlap of the number of genes with differential expression (−1.5 ≥ FC ≥ 1.5) in GFP+ (TG) versus DsRed+ (TR) tumor cells (green circle) and GFP+ (LG) versus DsRed+ (LR) metastatic cells in the lung (pink circle) (Supplementary Table 9). b Relative mRNA expression was confirmed with independent samples by using qPCR in tumor cells (TR and TG) and metastatic cells in the lung (LR and LG) (mean ± SEM, N = 2–3, n = 3); ****P < 0.0001 TG versus TR and LG versus LR (two-tailed t-test). Primer sequences are available in Supplementary Table 1. The box extends from the 25th to 75th percentiles, the median is marked by the vertical line inside the box, and the whiskers represent the minimum and maximum points. c Heat map of the 19-gene signature derived from the overlap of tumor and lung GFP+ induction. The distribution of the relative fold change of each gene in the 19-gene signature is displayed for in vitro hypoxic exposure (in vitro), GFP+ versus DsRed+ sorted tumor cells (TG/TR), and GFP+ versus DsRed+ sorted lung metastatic cells (LG/LR). Genes with fold change higher than 75% of the fold change of genes in the in vitro set are blue and genes with fold change lower than 25% of the fold change of genes are white. Genes with fold change higher than 75% of the fold change of genes in the in vivo sets are dark green and genes with fold change lower than 10% of the fold change of genes are white (Pearson correlation factor TG/TR vs. LG/LR r = 0.85 and P < 0.0001). d Overview of the role of post-hypoxic cells in the metastatic cascade. Post-hypoxic cells (GFP+) have enhanced metastatic potential associated with enhanced invasion, metastatic initiating capacity, and a ROS-resistant phenotype that improves survival in the bloodstream

References

    1. Kim JW, Gao P, Dang CV. Effects of hypoxia on tumor metabolism. Cancer Metastasis Rev. 2007;26:291–298. doi: 10.1007/s10555-007-9060-4. - DOI - PubMed
    1. Liao D, Johnson RS. Hypoxia: a key regulator of angiogenesis in cancer. Cancer Metastasis Rev. 2007;26:281–290. doi: 10.1007/s10555-007-9066-y. - DOI - PubMed
    1. Chen J, Imanaka N, Griffin JD. Hypoxia potentiates Notch signaling in breast cancer leading to decreased E-cadherin expression and increased cell migration and invasion. Br. J. Cancer. 2009;102:351–360. doi: 10.1038/sj.bjc.6605486. - DOI - PMC - PubMed
    1. Nagelkerke A, et al. Hypoxia stimulates migration of breast cancer cells via the PERK/ATF4/LAMP3-arm of the unfolded protein response. Breast Cancer Res. 2013;15:R2. doi: 10.1186/bcr3373. - DOI - PMC - PubMed
    1. Michiels C. Physiological and pathological responses to hypoxia. Am. J. Pathol. 2004;164:1875–1882. doi: 10.1016/S0002-9440(10)63747-9. - DOI - PMC - PubMed

Publication types

Substances