. 2019 Oct 24;10(1):4843.
doi: 10.1038/s41467-019-12811-4.

NSD2 overexpression drives clustered chromatin and transcriptional changes in a subset of insulated domains

Affiliations

NSD2 overexpression drives clustered chromatin and transcriptional changes in a subset of insulated domains

Priscillia Lhoumaud et al. Nat Commun. .

Abstract

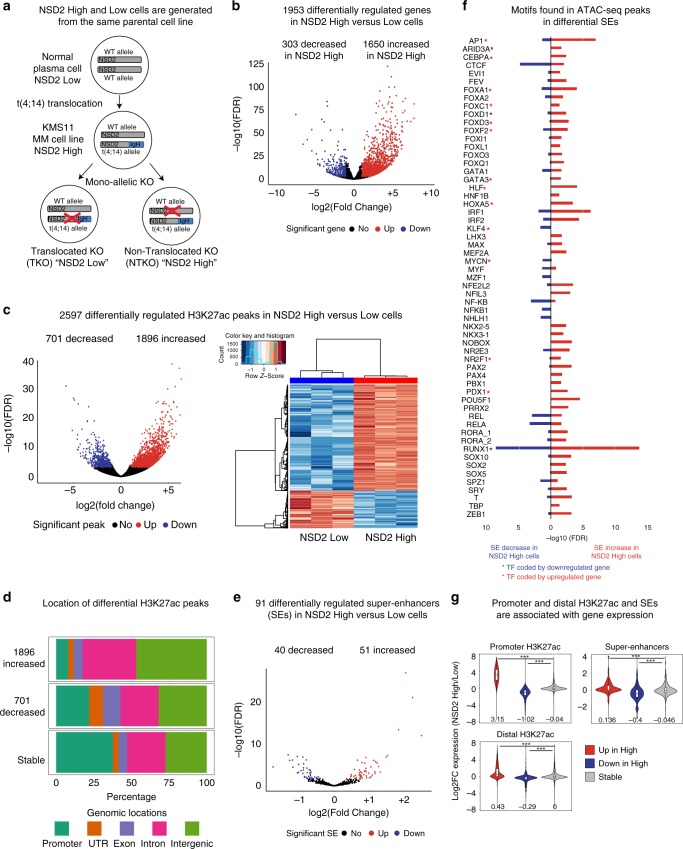
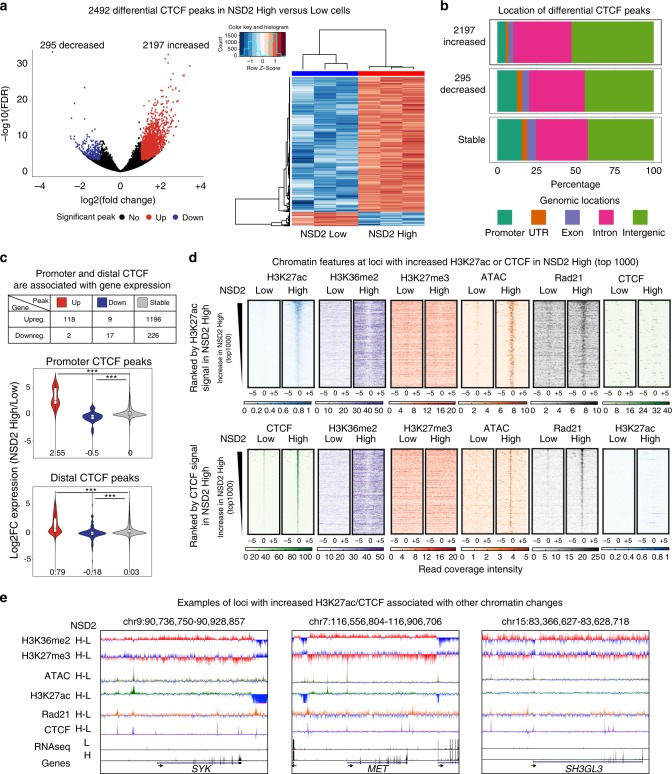
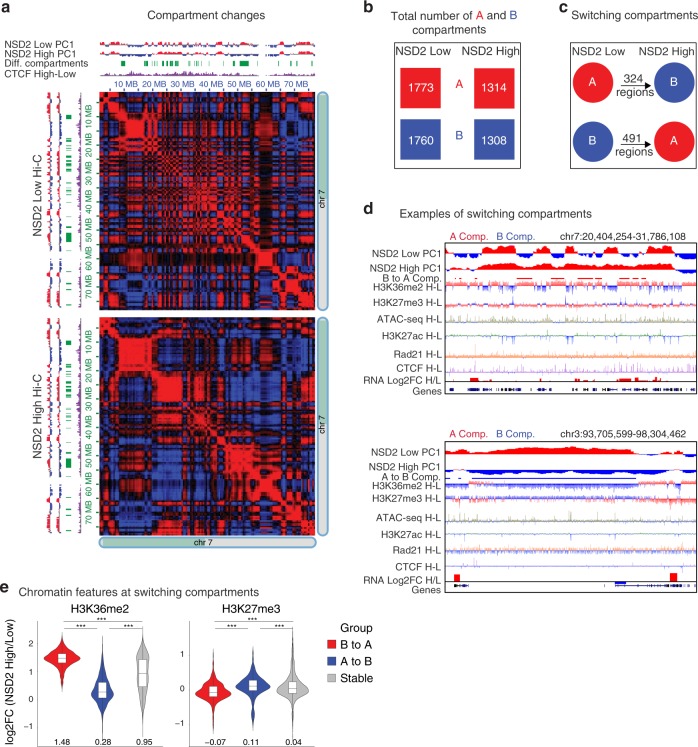
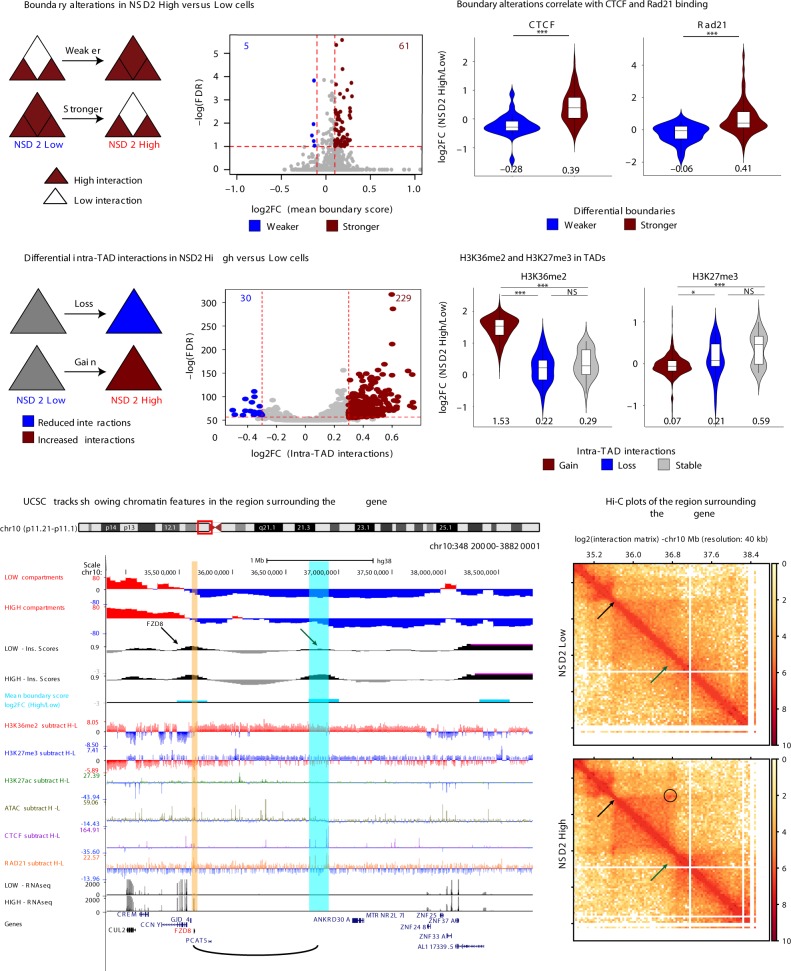
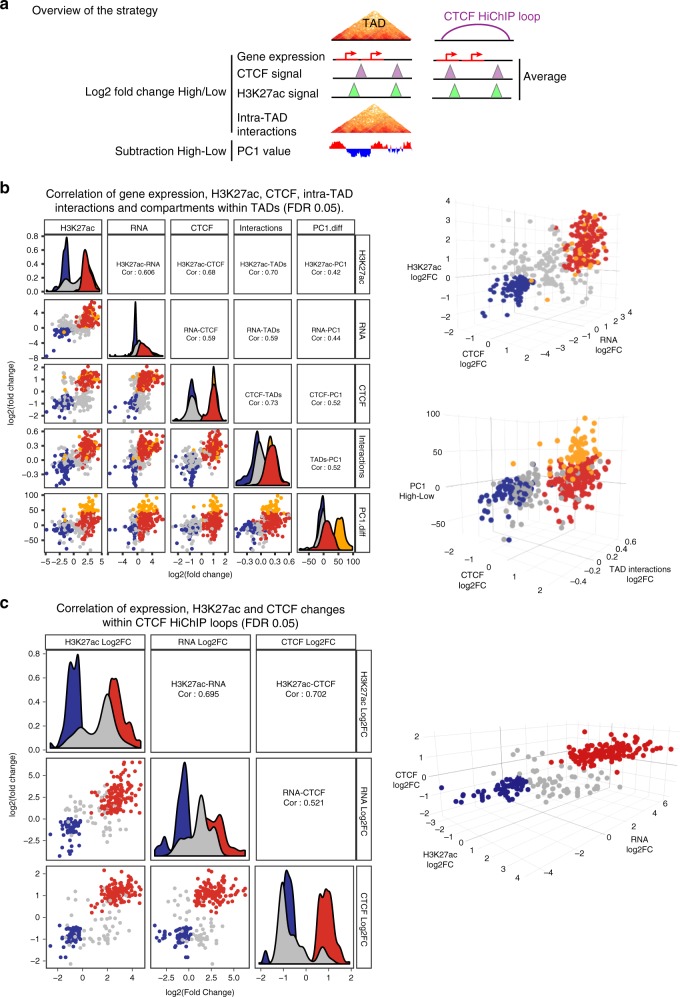
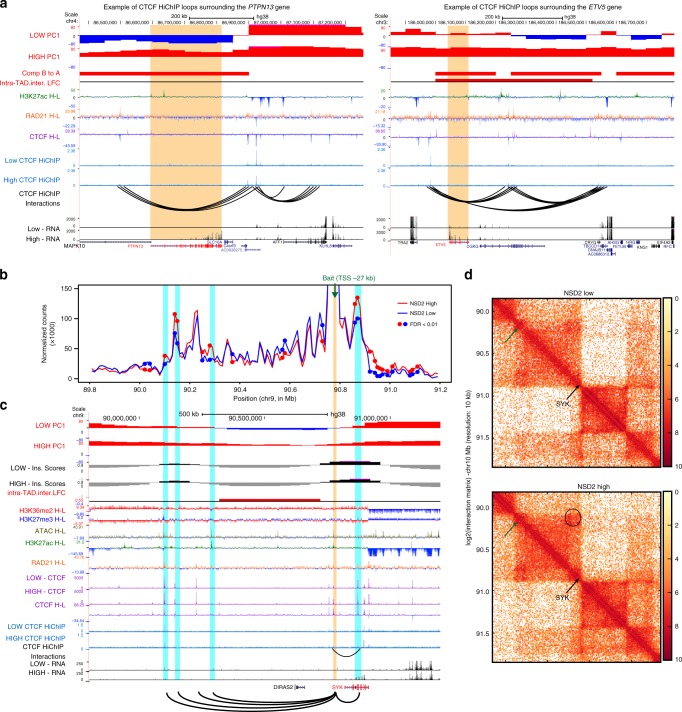
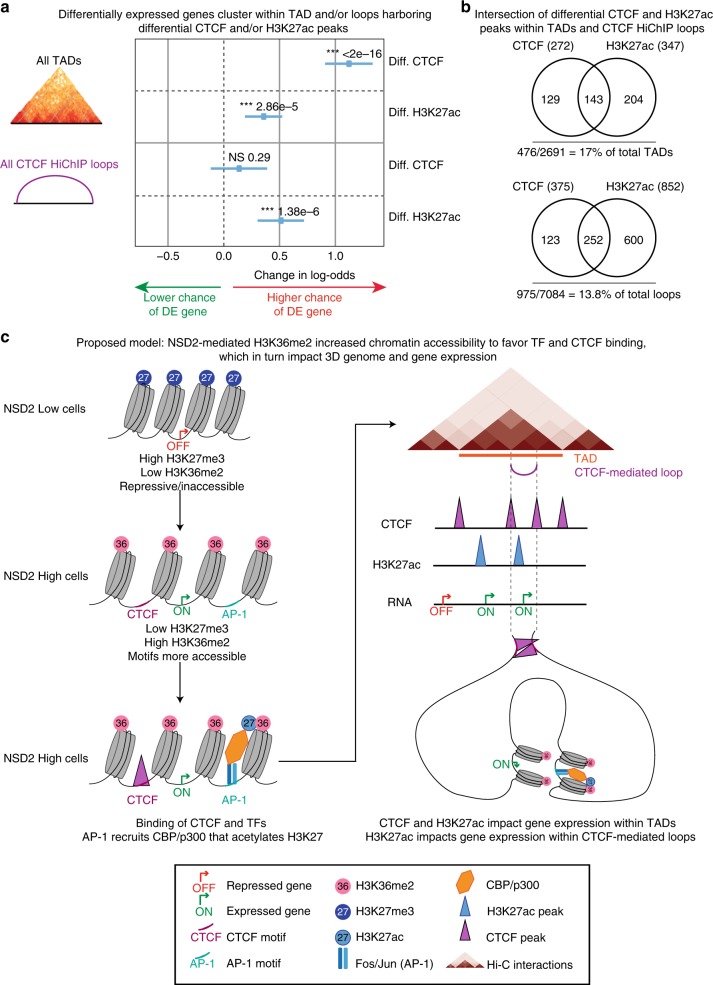
CTCF and cohesin play a key role in organizing chromatin into topologically associating domain (TAD) structures. Disruption of a single CTCF binding site is sufficient to change chromosomal interactions leading to alterations in chromatin modifications and gene regulation. However, the extent to which alterations in chromatin modifications can disrupt 3D chromosome organization leading to transcriptional changes is unknown. In multiple myeloma, a 4;14 translocation induces overexpression of the histone methyltransferase, NSD2, resulting in expansion of H3K36me2 and shrinkage of antagonistic H3K27me3 domains. Using isogenic cell lines producing high and low levels of NSD2, here we find oncogene activation is linked to alterations in H3K27ac and CTCF within H3K36me2 enriched chromatin. A logistic regression model reveals that differentially expressed genes are significantly enriched within the same insulated domain as altered H3K27ac and CTCF peaks. These results identify a bidirectional relationship between 2D chromatin and 3D genome organization in gene regulation.


Conflict of interest statement

The authors declare no competing interests.

Figures

Fig. 1
Fig. 1
NSD2 overexpression leads to alterations in H3K27ac enrichment linked to changes in gene expression. a NSD2 Low and High isogenic cell lines generated from the patient-derived KMS11 t(4;14) Multiple Myeloma (MM) cell line: NTKO (non-translocated knockout) and TKO (translocated knockout) cells, which have the translocated allele or the endogenous NSD2 allele, respectively inactivated. MM multiple myeloma. b Volcano plot showing significant NSD2-mediated changes in gene expression (n = 5 independent experiments, FDR < 0.01, Wald test). Upregulated genes: 1650 (red, log2-fold change > 1); downregulated genes: 303 (blue, log2-fold change < −1). c Violin plot (left panel) and heatmap (right panel) showing significant NSD2-mediated changes in H3K27ac (n = 3 independent experiments, FDR < 0.01, Wald test). Decreased peaks: 701 (blue, log2-fold change < −1); increased peaks: 1896 (red, log2-fold change > 1). d Genomic locations of the differential H3K27ac peaks. e Volcano plot showing significant NSD2-mediated changes in super-enhancers (n = 3 independent experiments, FDR < 0.1, Wald test) called based on H3K27ac levels using ROSE. Increased super-enhancers: 51 (red) and decreased super-enhancers: 40 (blue). f Transcription factor motifs identified in 119 ATAC-seq peaks of increased (51, red) and decreased (40, blue) super-enhancers using TRAP(−log10 FDR). Red and blue stars indicate that the gene encoding the TF is respectively up-regulated or downregulated in NSD2 High cells. g Gene expression changes are associated with H3K27ac changes at promoters, distal H3K27ac and super-enhancers. H3K27ac up, down and stable red, blue, and gray in NSD2 High versus Low cells. Source data are provided as a Source Data file
Fig. 2
Fig. 2
New CTCF and H3K27ac peaks are located within expanded H3K36me2 domains. a Violin plot (left panel) and heatmap (right panel) showing significant NSD2-mediated changes in CTCF binding (n = 3 independent experiments, FDR < 0.01, Wald test). Increasing peaks: 1650 (red, log2-fold change > 1); decreasing peaks: (blue, log2-fold change < −1). b Genomic locations of differential CTCF peaks using ChIPseeker (promoter: −/+3kb around TSS). c Gene expression changes are associated with CTCF changes (upreg. and downreg.: upregulated and downregulated genes), at promoters (middle panel) and distal CTCF sites (bottom panel). CTCF up, down and stable are, respectively, shown as red, blue and gray in NSD2 High versus Low cells. Source data are provided as a Source Data file. d Heatmaps of H3K27ac, H3K36me2, H3K27me3, ATAC-seq, Rad21, and CTCF signal at the top 1000 increased H3K27ac and CTCF peaks in NSD2 High cells (top and bottom panels, respectively). Peaks were ranked by H3K27ac and CTCF signal in NSD2 High cells. e UCSC genome browser screenshots of chromatin features at regions surrounding three oncogenes (SYK, left panel; MET, middle panel; and SH3GL3, right panel). H-L refers to subtraction of the ChIP-seq signal (NSD2 High–Low)
Fig. 3
Fig. 3
NSD2 overexpression drives A/B compartment switching. a Compartment weakening for half of chromosome 7 is shown in NSD2 High versus Low cells. Top and left: Eigen vector (PC1) for compartments A and B in red and blue, respectively. Switching regions are shown in green and in purple the subtraction of CTCF signal (NSD2 High–Low). Heatmaps represent the Pearson correlation of interactions in NSD2 Low (top) and High (bottom) cells. Positive and negative Pearson correlations between two loci are represented in red and blue, respectively. b Total number of A (red) and B (blue) compartments in NSD2 High versus Low cells. c Number of regions that switch compartments from B to A in (491 regions) or A to B (324 regions) in NSD2 High versus Low cells. d IGV screenshots show examples of regions that switch from A to B (top panel) and B to A (bottom panel) in NSD2 High versus Low cells. Eigen vectors (PC1), differential compartment switching, subtraction tracks of H3K36me2 and H3K27ac and expression for NSD2 High and Low cells are shown. Regions that significantly switch from B to A and from A to B are indicated in red (top panel, B to A) or in blue (bottom panel, A to B), respectively. H–L refers to subtraction of the ChIP-seq signal (NSD2 High–Low). e Changes in H3K36me2 and H3K27me3 levels within regions that switch compartment from B to A (red), A to B (blue), or are stable (gray) in NSD2 High cells. Log2-fold changes (NSD2 High versus Low cells) for H3K36me2 and H3K27me3 are shown. The median is indicated under the violins. Source data are provided as a Source Data file
Fig. 4
Fig. 4
Changes in TAD boundaries and intra-TAD interactions. a Boundary alterations in NSD2 High versus Low cells. NSD2 overexpression is associated with increases (red, 61) and decreases (blue, 5) in TAD boundary strength (n = 2 independent experiments, cutoffs of absolute Log2-fold change > 0.1 and FDR < 0.05). b TAD boundary increases and decreases in NSD2 High versus Low cells are associated with increases and decreases in CTCF and Rad21 binding, respectively. The median is indicated under the violins. c Intra-TAD interaction changes in NSD2 High versus Low cells for overlapping TADs (1564). NSD2 overexpression is associated with gain (red, 229) and loss (blue, 30) of intra-TAD interactions (n = 2 independent experiments, cutoffs of absolute Log2-fold change > 0.3 and FDR < 0.05). d Changes in H3K36me2 and H3K27me3 within TADs that have increased (red), decreased (red), or stable (gray) interactions in NSD2 High cells. Log2-Fold changes (NSD2 High/Low cells) for H3K36me2 and H3K27me3 ChIP-seq are shown. The median is indicated under the violins. e UCSC tracks showing chromatin features in the region surrounding the FZD8 gene (FZD8 gene indicated in red and location highlighted by a yellow stripe) and the new contact that is formed by a strengthened boundary (blue stripe). The graphical representation of interaction between FZD8 and the super enhancer is shown as a loop below. H–L refers to subtraction of the ChIP-seq signal (NSD2 High–Low). f Hi-C plots of the region surrounding the FZD8 gene. Top panel: NSD2 Low, bottom panel: NSD2 High. Green arrow identifies the TAD boundary that is strengthened in NSD2 High versus Low cells. Black arrow indicates the FZD8 gene. Circle indicates a new loop between FZD8 and the boundary. Source data for violin plots in panels b and d are provided as a Source Data file
Fig. 5
Fig. 5
NSD2 overexpression drives concordant chromatin and transcriptional changes in insulated domains. a Scheme illustrating the strategy to identify chromatin and transcriptional changes within TADs or CTCF HiChIP loops that were filtered to have at least one differentially expressed gene, CTCF and H3K27ac peak. b Pairwise (2D scatter plots left panel) and three-way (3D scatter plots right panels) comparisons representing significant log2-fold-changes in gene expression, H3K27ac, CTCF, intra-TAD interactions, and PC1 values (representing subtraction of NSD2 High and Low levels) within TADs that have at least one significantly differentially expressed gene, CTCF and H3K27ac peak (FDR < 0.05). Concordant increased and decreased changing TADs are colored in red and blue, respectively. TADs that switch from B to A according to HOMER analysis (see the “Methods” section for details) are highlighted in orange. Pearson correlations are indicated. c Pairwise (2D scatter plots left panel) and three-way (3D scatter plots right panels) comparisons representing significant log2-fold changes of NSD2 High versus Low levels in gene expression, H3K27ac and CTCF within CTCF HiChIP loops that have at least one differentially expressed gene, CTCF and H3K27ac peak (FDR < 0.05). Concordant increased and decreased changing loops are colored in red and blue, respectively. Pearson correlations are indicated. Source data are provided as a Source Data file for b and c panels
Fig. 6
Fig. 6
Cells co-opt altered chromatin domains to drive oncogenic transcriptional programs. a UCSC tracks showing chromatin features and CTCF-mediated loop changes in the region surrounding the PTPN13 (left panel) and ETV5 (right panel) genes (PTPN13 and ETV5 genes are indicated in red and highlighted with a yellow stripe). H–L refers to subtraction of the ChIP-seq signal (NSD2 High−Low). b Interaction profile of a 4C bait located 27 kb downstream of the SYK promoter (green arrow, bait −27 kb) in a 2.4 Mb region surrounding the SYK gene in NSD2 High (red line represents the average between two replicates) and Low (blue line represents the average between two replicates) cells using 4C counts in 20 kb sliding windows. DESeq2 analysis identified significantly different 4C signal in duplicated 4C samples from NSD2 High versus Low cells. Regions with differential interactions are indicated by red and blue dots (n = 2 independent experiments, FDR < 0.01). c UCSC tracks showing chromatin features in the region surrounding SYK (SYK indicated in red). A graphical representation of interactions from the 4C viewpoint (highlighted by a yellow strip) located 27 kb downstream of the SYK promoter is drawn with arcs at the bottom and highlighted by blue stripes. H–L refers to subtraction of the ChIP-seq signal (NSD2 High−Low). d Hi-C plots of the region surrounding SYK in NSD2 Low and High cells (left and right panels, respectively)
Fig. 7
Fig. 7
Changes in gene expression occur as a function of changes in chromatin in TADs and CTCF loops. a Logistic regression model of gene expression changes as a function of CTCF and/or H3K27ac changes in TADs and CTCF loops (see the “Methods“ section for details). Diff. CTCF and H3K27ac: differential CTCF and H3K27ac peaks. DE gene: differentially expressed gene. P-values were calculated using Wald-test (***P < 2e−16 for differential CTCF in TADs; ***P = 2.6e−5 for Diff. H3K27ac in TADs; NSP = 0.29 for Diff. CTCF in loops; ***P = 1.38e−6 for Diff. H3K27ac in loops). b Intersection of differential CTCF and H3K27ac peaks within TADs and CTCF loops. c Proposed model: NSD2-mediated H3K36me2 increases chromatin accessibility to favor TF and CTCF binding, which in turn impacts 3D genome reorganization and gene expression changes

References

    1. Lieberman-Aiden E, et al. Comprehensive mapping of long-range interactions reveals folding principles of the human genome. Science. 2009;326:289–293. doi: 10.1126/science.1181369. - DOI - PMC - PubMed
    1. Nora EP, et al. Spatial partitioning of the regulatory landscape of the X-inactivation centre. Nature. 2012;485:381–385. doi: 10.1038/nature11049. - DOI - PMC - PubMed
    1. Dixon JR, et al. Topological domains in mammalian genomes identified by analysis of chromatin interactions. Nature. 2012;485:376–380. doi: 10.1038/nature11082. - DOI - PMC - PubMed
    1. Sexton T, et al. Three-dimensional folding and functional organization principles of the Drosophila genome. Cell. 2012;148:458–472. doi: 10.1016/j.cell.2012.01.010. - DOI - PubMed
    1. Dowen JM, et al. Control of cell identity genes occurs in insulated neighborhoods in mammalian chromosomes. Cell. 2014;159:374–387. doi: 10.1016/j.cell.2014.09.030. - DOI - PMC - PubMed

Publication types

MeSH terms