. 2019 Oct 24;10(1):4839.
doi: 10.1038/s41467-019-12764-8.

Genetic mapping and evolutionary analysis of human-expanded cognitive networks

Affiliations

Genetic mapping and evolutionary analysis of human-expanded cognitive networks

Yongbin Wei et al. Nat Commun. .

Abstract

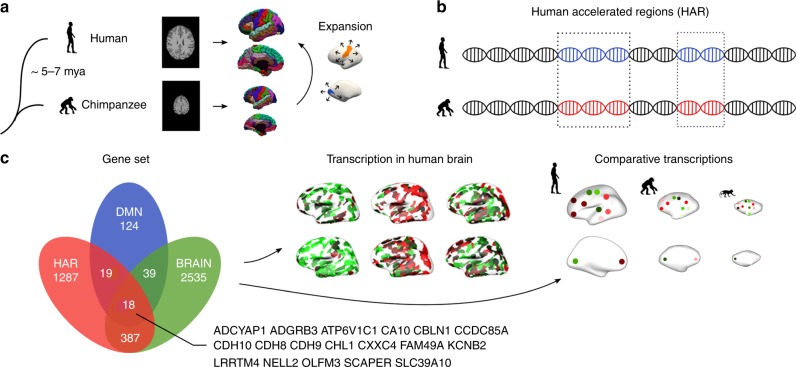
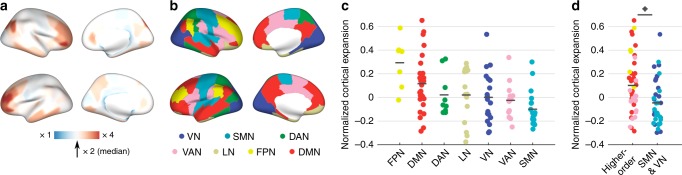
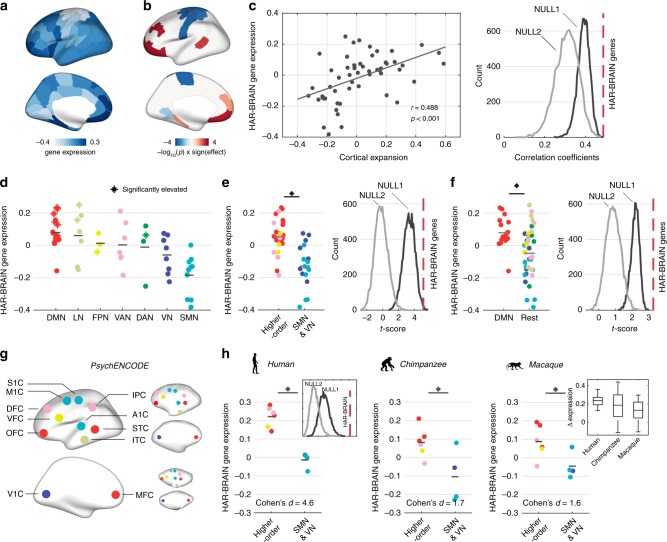
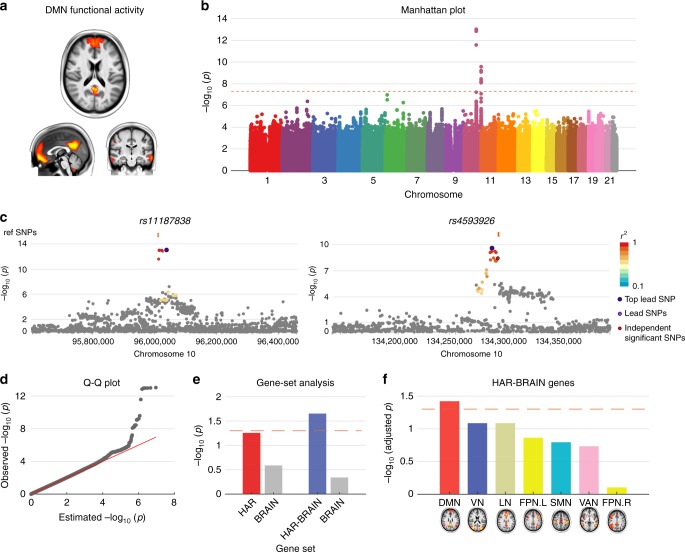
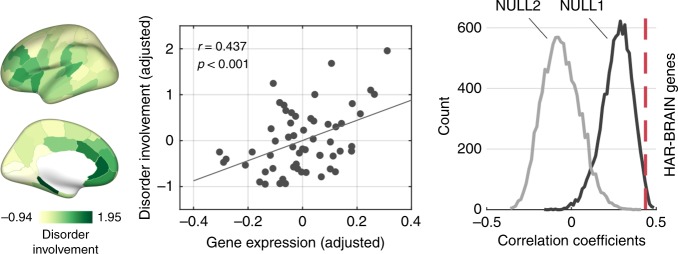
Cognitive brain networks such as the default-mode network (DMN), frontoparietal network, and salience network, are key functional networks of the human brain. Here we show that the rapid evolutionary cortical expansion of cognitive networks in the human brain, and most pronounced the DMN, runs parallel with high expression of human-accelerated genes (HAR genes). Using comparative transcriptomics analysis, we present that HAR genes are differentially more expressed in higher-order cognitive networks in humans compared to chimpanzees and macaques and that genes with high expression in the DMN are involved in synapse and dendrite formation. Moreover, HAR and DMN genes show significant associations with individual variations in DMN functional activity, intelligence, sociability, and mental conditions such as schizophrenia and autism. Our results suggest that the expansion of higher-order functional networks subserving increasing cognitive properties has been an important locus of genetic changes in recent human brain evolution.


Conflict of interest statement

The authors declare no competing interests.

Figures

Fig. 1
Fig. 1
Methods overview. a The human and chimpanzee cortex were constructed using MRI data, with chimpanzee-to-human cortical expansion computed based on the reconstructed cortical maps. b Genes associated with human accelerated regions (HAR), which represent genomic loci with accelerated divergence in humans, were examined. c Cortical gene expression of HAR genes and HAR-BRAIN genes were examined using human transcription data from the Allen Human Brain Atlas (AHBA) and comparative transcription data of the human, chimpanzee, and macaque from the PsychENCODE database
Fig. 2
Fig. 2
Cortical expansion. a Cortical expansion from chimpanzees to humans. Blue: below-median human expansion (i.e., < × 2 expansion compared to chimpanzee); red: above-median expansion (i.e., > × 2). b Brain maps of the seven resting-state functional networks according to the DK-114 atlas, describing the visual (VN), somatomotor (SMN), dorsal-attention (DAN), limbic (LN), ventral-attention (VAN), frontal-parietal (FPN), and default-mode network (DMN). c Levels of normalized cortical expansion per functional network in descending order of mean expansion. d Levels of normalized cortical expansion in higher-order cognitive networks (DMN, FPN, VAN) versus the SMN and VN. Dots depict cortical regions. Colors represent functional networks, as in panel b. Central marks are mean expansions. * indicates a two-sided p-value < 0.05, FDR corrected, two-sample t-test. Source data provided as Source Data file
Fig. 3
Fig. 3
HAR-BRAIN gene expression. a Cortical gene expression of HAR-BRAIN genes. b Cortical maps of the significance level obtained by permutation tests, comparing expressions of HAR-BRAIN genes to equally sized random gene-sets taken from BRAIN (NULL1) and ECE genes (NULL2). c Association between the gene expression profile of HAR-BRAIN genes and normalized cortical expansion between human and chimpanzee (left). The correlation coefficient is significantly higher than NULL1 and NULL2 (both p < 0.001, two-sided, permutation test; right). d HAR-BRAIN gene expression within each of the seven functional networks ranked in descending order of the mean expression. Asterisks (*) indicates significantly upregulated regions as in panel b. e HAR-BRAIN gene expression in cognitive networks (DMN, FPN, and VAN) versus the SMN and VN (left), with permutation results demonstrated in the right panel (two-sided p = 0.003 and p < 0.001 for NULL1 and NULL2, respectively). f HAR-BRAIN gene expression in the DMN versus the rest of the cortex (left), with permutation results demonstrated in the right panel (two-sided p < 0.001 for both NULL1 and NULL2). g Species-homologous brain areas as presented in the PsychENCODE dataset for the human (left), chimpanzee (upper right), and macaque (lower right). h Normalized expression levels of HAR-BRAIN genes in regions of higher-order networks compared to areas of the SMN/VN in humans (p < 0.001, two-sample t test). Largest differences in gene expression are found in humans, with chimpanzees in second place, followed by macaques (p = 0.002, Jonckheere-Terpstra test). Asterisks (*) indicates two-sided p < 0.05, FDR corrected. Central marks denote the mean gene expression. Boxplot center, median; box = 1st−3rd quartiles (Q); lower whisker, Q1–1.5 × interquartile range (IQR); upper whisker, Q3 + 1.5 × IQR. Colors indicate the assignment of functional networks, as in Fig. 2b. M1C primary motor cortex, S1C primary sensory cortex, IPC inferior parietal cortex, STC superior temporal cortex, ITC inferior temporal cortex, A1C primary auditory cortex, OFC orbital frontal cortex, VFC ventral frontal cortex, DFC dorsal frontal cortex, V1C primary visual cortex, MFC medial frontal cortex. Source data provided as Source Data file
Fig. 4
Fig. 4
GWAS on DMN activity. a DMN component. b GWAS Manhattan plot showing –log10-transformed two-tailed p-value for all SNP (y-axis) and base-pair positions along the chromosomes (x-axis). Dotted red line indicates Bonferroni-corrected genome-wide significance (p-value < 5 × 10−8). c Regional plots of the two genomic loci (left, lead SNP: rs11187838 and right, lead SNP: rs4593926). d Q–Q plot of SNP-based p-value in panel b. Observed −log10 transformed two-tailed p-values of associations with DMN functional activity are plotted against expected null p-values for all SNPs in the GWAS. e MAGMA conditional gene-set analysis. −log10-transformed p-values of the associations between HAR/HAR-BRAIN genes and DMN functional activity conditional upon BRAIN genes. Dashed line indicates p = 0.05. f MAGMA gene-set analysis on HAR-BRAIN genes and other “NETMAT amplitude 25” phenotypes representing functional activity in the other functional networks (−log10-transformed adjusted p-values, FDR corrected). Colors indicate the assignment of functional networks, as in Fig. 2b. Dashed line indicates adjusted p = 0.05
Fig. 5
Fig. 5
Cortical disorder involvement and HAR-BRAIN gene expression. Left panel shows brain maps of cortical involvement across five major psychiatric disorders (e.g., schizophrenia, bipolar disorder, autism spectrum disorder, major depression, and obsessive-compulsive disorder). Middle panel shows correlation between HAR-BRAIN gene expression and disorder involvement (Pearson’s r = 0.437, p < 0.001; corrected for cortical volume), and right panel shows the comparison of the correlation coefficient to null distributions generated by random BRAIN (NULL1; p = 0.022) and ECE genes (NULL2; p < 0.001, permutation test, 10,000 permutations). Source data provided as Source Data file

References

    1. Britten RJ. Divergence between samples of chimpanzee and human DNA sequences is 5%, counting indels. Proc. Natl Acad. Sci. USA. 2002;99:13633–13635. doi: 10.1073/pnas.172510699. - DOI - PMC - PubMed
    1. Buckner RL, Krienen FM. The evolution of distributed association networks in the human brain. Trends Cogn. Sci. 2013;17:648–665. doi: 10.1016/j.tics.2013.09.017. - DOI - PubMed
    1. Preuss, T. M. Chapter 8: The human brain: evolution and distinctive features. In: On Human Nature.(Academic Press, 2017).
    1. Ardesch, D. J., et al. Evolutionary expansion of connectivity between multimodal association areas in the human brain compared with chimpanzees. Proc. Natl Acad. Sci. USA (2019). - PMC - PubMed
    1. Buckner RL, Andrews-Hanna JR, Schacter DL. The brain’s default network: anatomy, function, and relevance to disease. Ann. NY Acad. Sci. 2008;1124:1–38. doi: 10.1196/annals.1440.011. - DOI - PubMed

Publication types