. 2019 Oct 24;9(1):15250.
doi: 10.1038/s41598-019-51962-8.

Cryo-Gel embedding compound for renal biopsy biobanking

Affiliations

Cryo-Gel embedding compound for renal biopsy biobanking

Malou L H Snijders et al. Sci Rep. .

Abstract

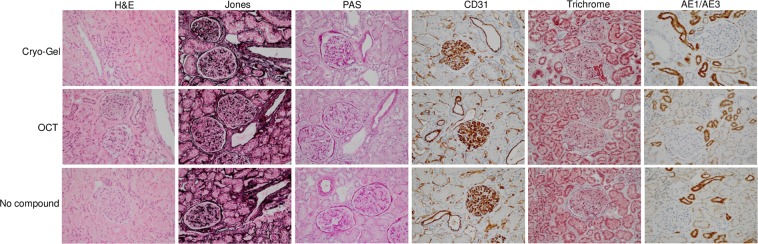
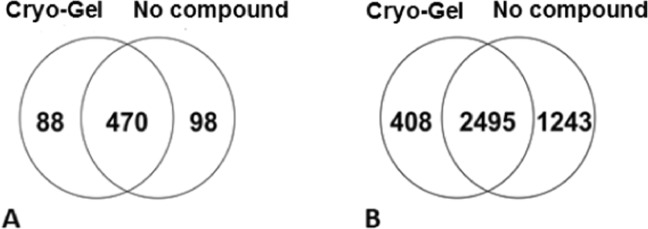
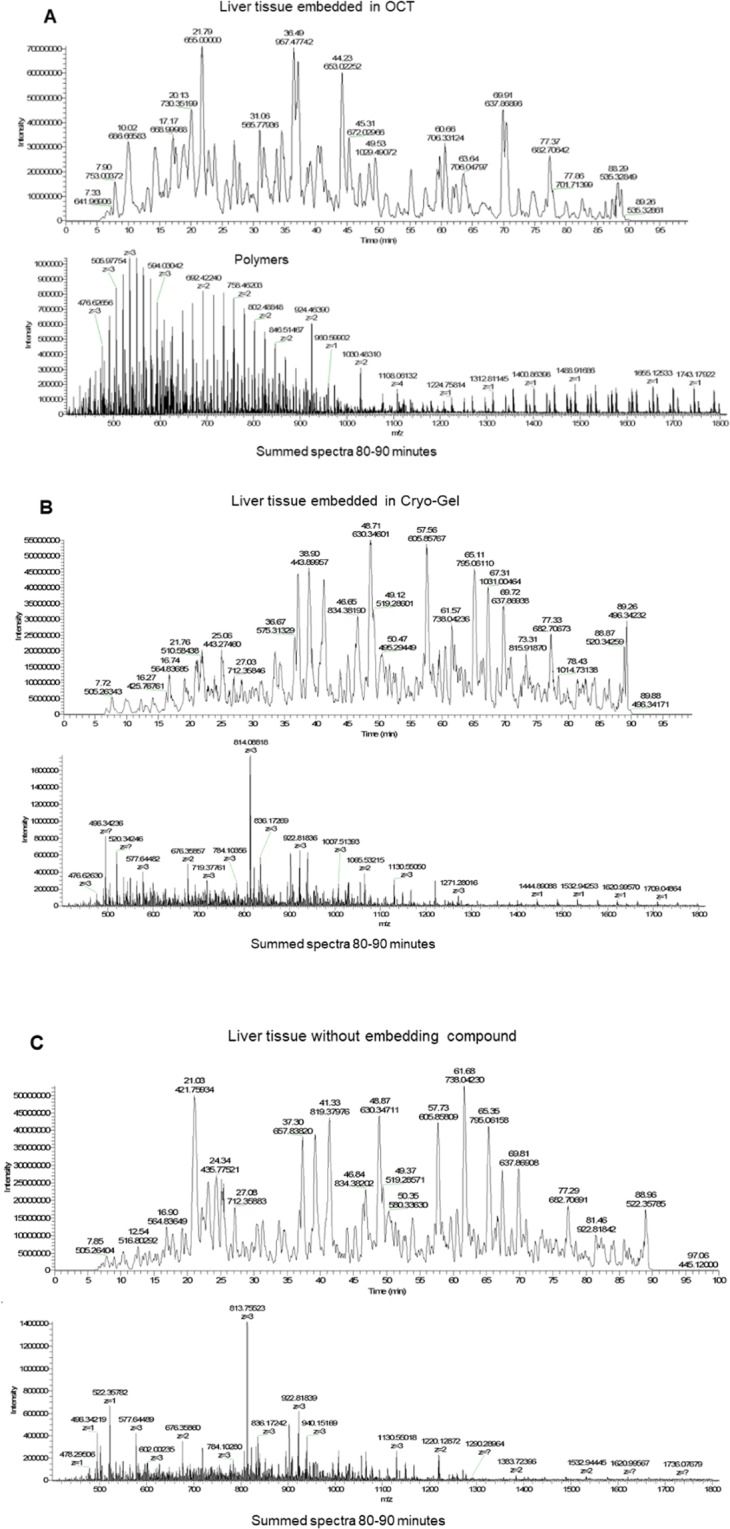
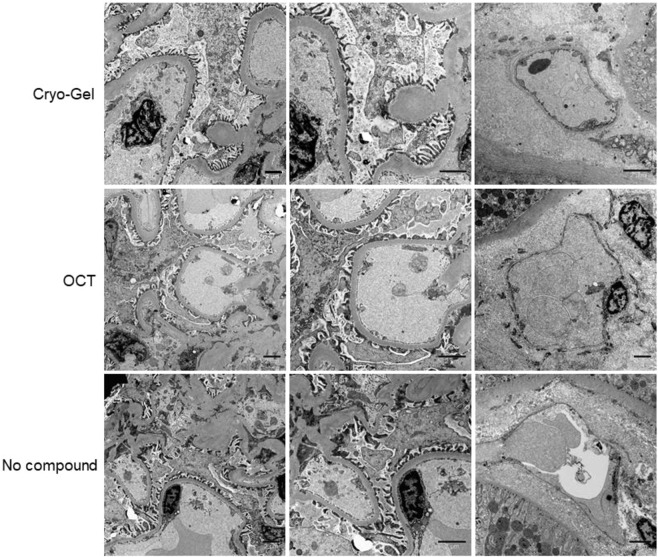
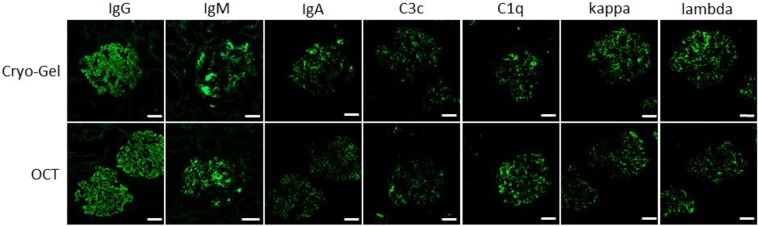
Optimal preservation and biobanking of renal tissue is vital for good diagnostics and subsequent research. Optimal cutting temperature (OCT) compound is a commonly used embedding medium for freezing tissue samples. However, due to interfering polymers in OCT, analysis as mass spectrometry (MS) is difficult. We investigated if the replacement of OCT with Cryo-Gel as embedding compound for renal biopsies would enable proteomics and not disturb other common techniques used in tissue diagnostics and research. For the present study, fresh renal samples were snap-frozen using Cryo-Gel, OCT and without embedding compound and evaluated using different techniques. In addition, tissue samples from normal spleen, skin, liver and colon were analyzed. Cryo-Gel embedded tissues showed good morphological preservation and no interference in immunohistochemical or immunofluorescent investigations. The quality of extracted RNA and DNA was good. The number of proteins identified using MS was similar between Cryo-Gel embedded samples, samples without embedding compound and OCT embedded samples. However, polymers in the OCT disturbed the signal in the MS, while this was not observed in the Cryo-Gel embedded samples. We conclude that embedding of renal biopsies in Cryo-Gel is an excellent and preferable alternative for OCT compound for both diagnostic and research purposes, especially in those cases where proteomic analysis might be necessary.


Conflict of interest statement

The authors declare no competing interests.

Figures

Figure 1
Figure 1
Flowchart showing the work-up protocol performed on normal tissue samples from kidney, spleen, skin, colon and liver. Samples were embedded in either Cryo-Gel, OCT or without compound. *Two samples were embedded from the different tissues for each embedding medium. For the renal tissues, the additional performed techniques were all performed in duplicate. **H&E was performed on all tissue samples. PAS, Jones, Trichrome and immunohistochemistry for AE1/AE3 and CD31 were performed in the renal samples. PAS, trichrome, Sirius Red and Iron stain were performed in the liver samples. ***EM was only performed on the renal samples.
Figure 2
Figure 2
H&E, Jones, PAS, CD31, Trichrome and AE1/AE3 staining on frozen renal tissue samples embedded in Cryo-Gel, OCT and without compound converted to FFPE material (magnification 20x).
Figure 3
Figure 3
Mean RIN values for samples embedded in Cryo-Gel, OCT and without compound.
Figure 4
Figure 4
PCR results of Cryo-Gel samples (lane 1–4), OCT samples (lane 5–8) and samples without compound (lane 9–12) showing a product at 400, 300, 200 and 100 bp. All experiments included a positive control (P) and a negative water control (W).
Figure 5
Figure 5
Venn diagram showing the number of different proteins (A) and peptides (B) identified by mass spectrometry and overlap between the samples embedded with Cryo-Gel and without compound.
Figure 6
Figure 6
Mass spectra from liver samples embedded in OCT, Cryo-Gel and without compound. The summed spectra at 80–90 minutes show repeating polymer peaks in the OCT embedded samples disturbing the signal, but not in the samples embedded in Cryo-Gel and without compound.
Figure 7
Figure 7
Electron microscopy for samples embedded with Cryo-Gel, OCT and without compound. Left: glomerular filtration membrane (magnification 4400x); middle: higher magnification of glomerular filtration membrane (magnification 7100x); right: peritubular capillary (magnification 7100x, 4400x and 5600x, respectively). Scale bar = 2 µm.
Figure 8
Figure 8
Immunofluorescence staining for IgG, IgM, IgA, C3c, C1q, kappa and lambda from renal cortex form a patient with lupus nephritis embedded in Cryo-Gel and OCT compound (magnification 20x; scale bar = 50 µm).

References

    1. Riegman PH, van Veen EB. Biobanking residual tissues. Hum Genet. 2011;130:357–68. doi: 10.1007/s00439-011-1074-x. - DOI - PubMed
    1. Zatloukal K, Hainaut P. Human tissue biobanks as instruments for drug discovery and development: impact on personalized medicine. Biomark Med. 2010;4:895–903. doi: 10.2217/bmm.10.104. - DOI - PubMed
    1. Charonis A, Luider T, Baumann M, Schanstra JP. Is the time ripe for kidney tissue proteomics? Proteomics Clin Appl. 2011;5:215–21. doi: 10.1002/prca.201000111. - DOI - PubMed
    1. Schwartz SA, Reyzer ML, Caprioli RM. Direct tissue analysis using matrix-assisted laser desorption/ionization mass spectrometry: practical aspects of sample preparation. J. Mass Spectrom. 2003;38:699–708. doi: 10.1002/jms.505. - DOI - PubMed
    1. Sethi S. Mass spectrometry-based proteomic diagnosis of renal immunoglobulin heavy chain amyloidosis. Clin J Am Soc Nephrol. 2010;5:2180–7. doi: 10.2215/CJN.02890310. - DOI - PMC - PubMed