. 2020 Jan;30(1):70-87.
doi: 10.1038/s41422-019-0241-9. Epub 2019 Oct 24.

Initiation of Parkinson's disease from gut to brain by δ-secretase

Affiliations

Initiation of Parkinson's disease from gut to brain by δ-secretase

Eun Hee Ahn et al. Cell Res. 2020 Jan.

Abstract

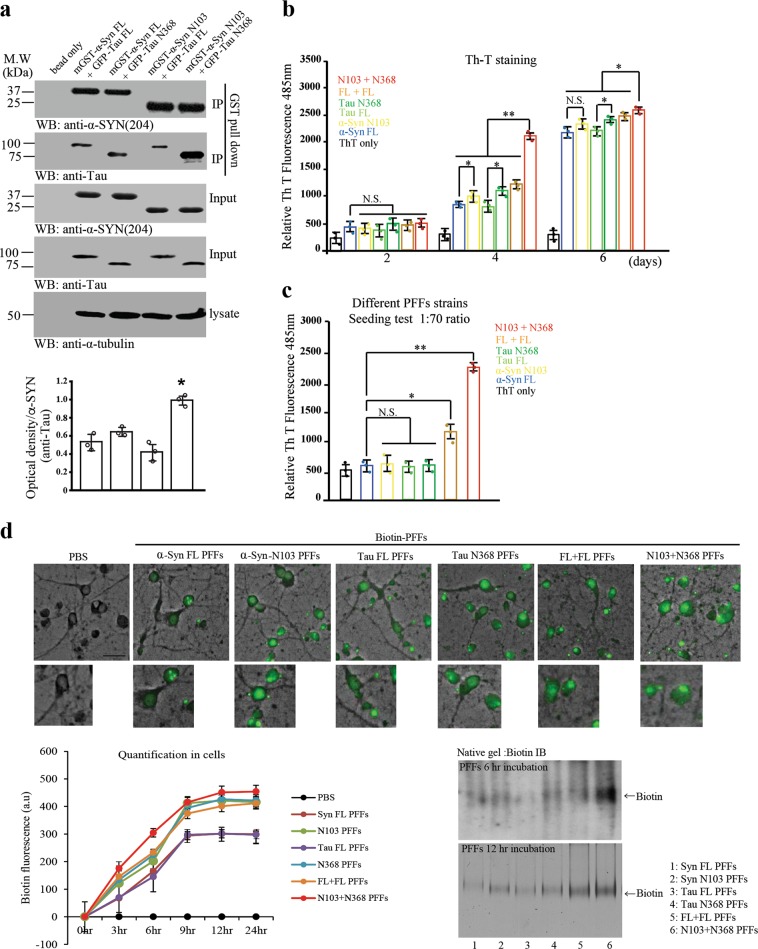
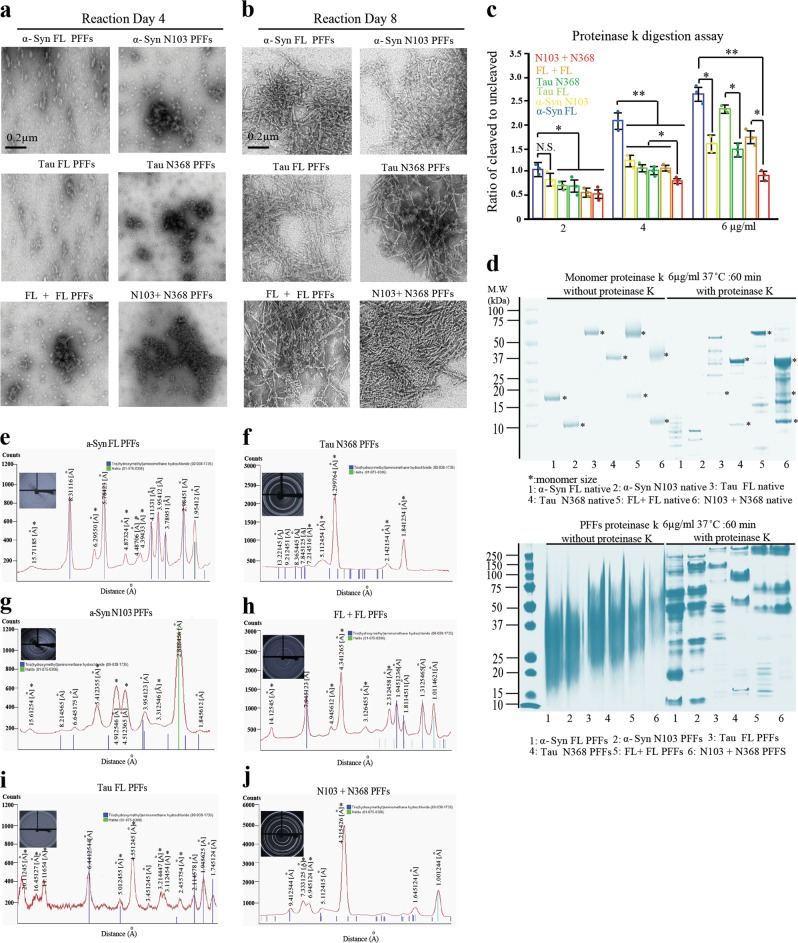
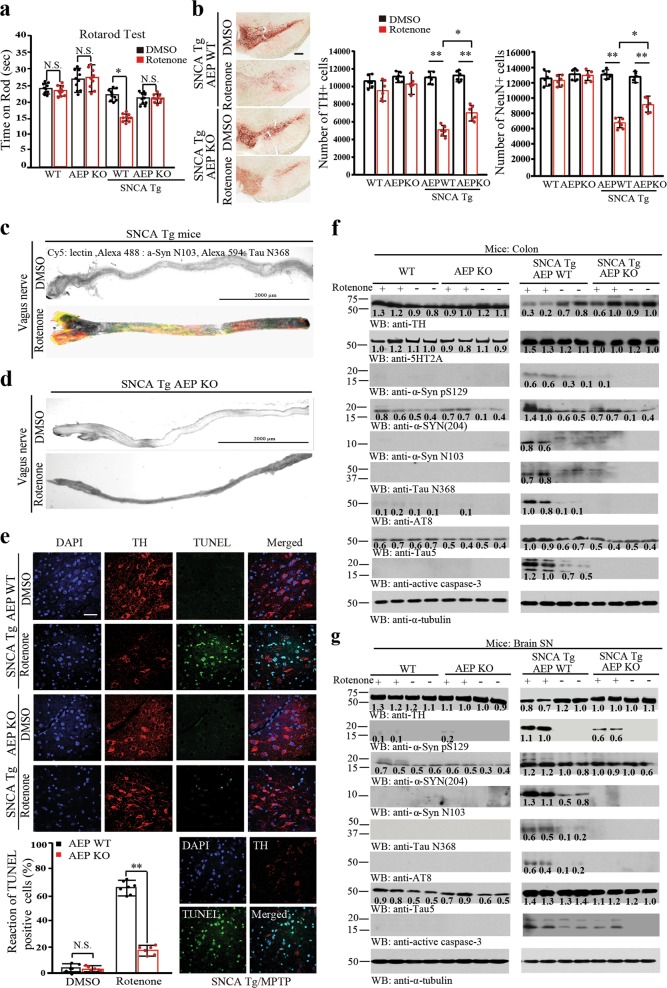
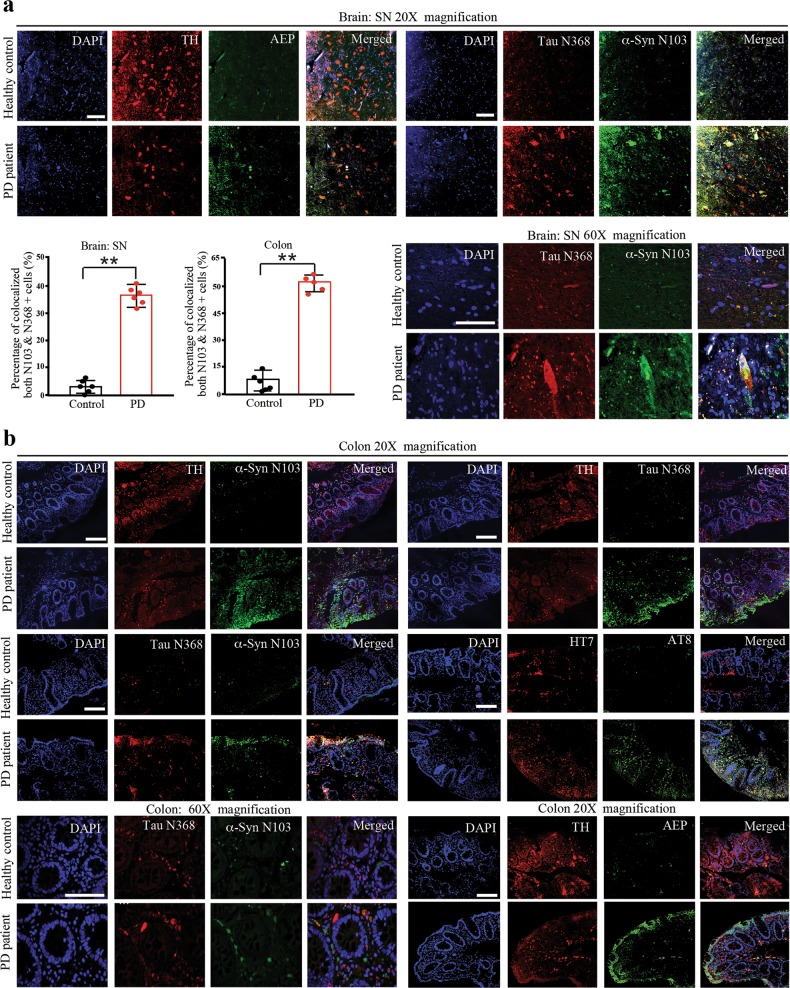
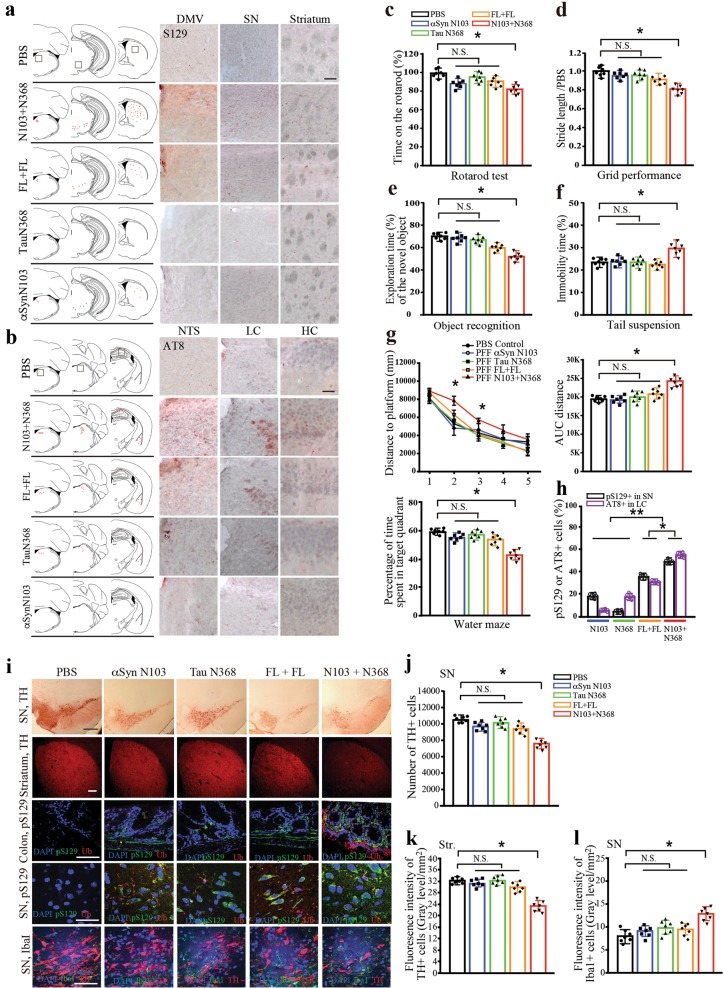
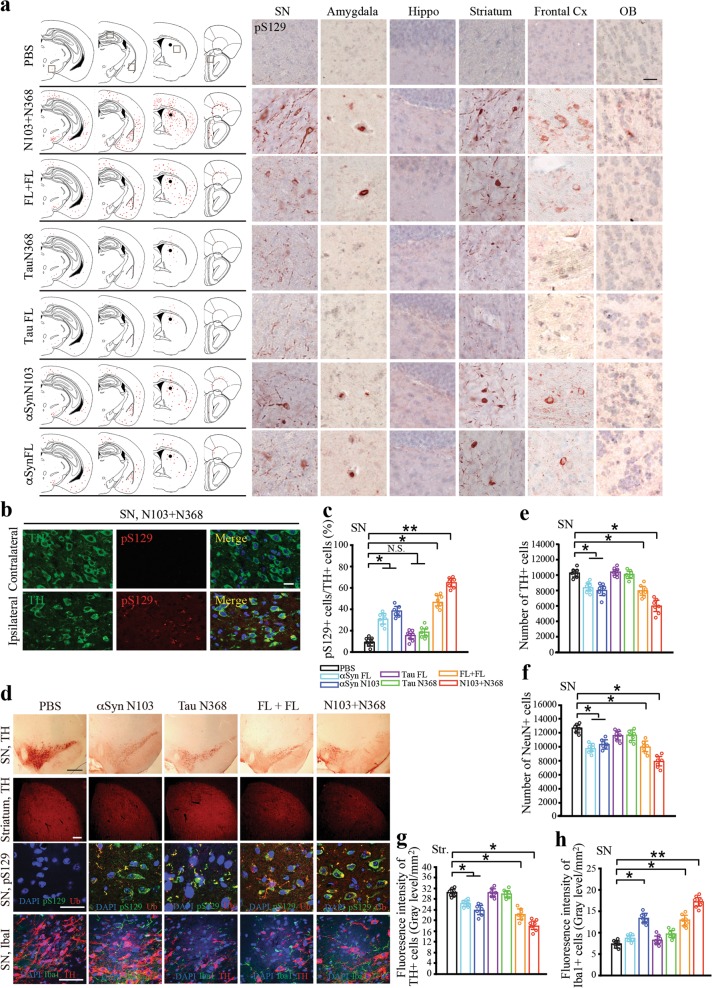
Lewy pathology, composed of α-Synuclein (α-Syn) inclusions, a hallmark of Parkinson's disease (PD), progressively spreads from the enteric nervous system (ENS) to the central nervous system (CNS). However, it remains unclear how this process is regulated at a molecular level. Here we show that δ-secretase (asparagine endopeptidase, AEP) cleaves both α-Syn at N103 and Tau at N368, and mediates their fibrillization and retrograde propagation from the gut to the brain, triggering nigra dopaminergic neuronal loss associated with Lewy bodies and motor dysfunction. α-Syn N103 and Tau N368 robustly interact with each other and are highly elevated in PD patients' gut and brain. Chronic oral administration of the neurotoxin rotenone induces AEP activation and α-Syn N103/Tau N368 complex formation in the gut, eliciting constipation and dopaminergic neuronal death in an AEP-dependent manner. Preformed fibrils (PFFs) of α-Syn N103/Tau N368 are more neurotoxic and compact, and aggregate more quickly along the vagus nerve than their FL/FL counterparts or the individual fragments' fibrils. Colonic injection of PFFs induces PD pathologies, motor dysfunctions, and cognitive impairments. Thus, δ-secretase plays a crucial role in initiating PD pathology progression from the ENS to the CNS.


Conflict of interest statement

The authors declare no competing interests.

Figures

Fig. 1
Fig. 1
α-Syn N103/Tau N368 strongly interact with each other and trigger endogenous mouse α-Syn phosphorylation in primary neurons. a AEP-cleaved α-Syn N103 strongly interacts with AEP-cleaved Tau N368. GST pull-down assay was performed in transfected HEK293 cells. The expression of pull-down GST-α-Syn FL and GST-α-Syn N103 and 10% input in cell lysates were shown and the expression level was quantified by densitometric analysis (bottom panel). Results are shown as means ± SEM; n = 3 independent experiments; *P < 0.05 by two-tailed Student’s t-test. b α-Syn N103 and Tau N368 complex aggregate and form fibrils the fastest among all of the strains. Thioflavin T assay showed that different aggregation rates of purified human α-Syn FL, α-Syn N103, Tau FL, Tau N368, α-Syn with Tau FL combination and AEP-cleaved fragment combination. Results are shown as means ± SEM; n = 3 independent experiments; *P < 0.05, **P < 0.01 by two-tailed Student’s t-test. c Seeding capacity assay. Seeding of (α-Syn N103 + Tau N368) PFFs promotes the aggregation of native proteins at 1:70 ratios. α-Syn N103 + Tau N368 aggregation (0.7 µM) was assessed with Th-T assays in the presence of 1 (α-Syn N103 + Tau N368 fibrils, 10 nM):70 (monomers, 690 nM) (*P < 0.05, **P < 0.01). d Representative images of mouse middle brain neuron cells following 12-h incubation with PBS or biotinylated PFFs. The line graph is PFF uptake quantified by total cellular biotin fluorescence related time dependency (lower left panel). Uptake of 6 different PFFs (100 nM) by mouse middle brain neurons was measured by 4% native gel biotin immunoblot analysis (lower right panel). We performed three independent studies in all of experiments. Scale bar, 50 µm
Fig. 2
Fig. 2
Biophysical and biochemical characterization of PFFs of α-Syn N103/Tau N368 complex. a, b Negative stained TEM images of α-Syn FL, α-Syn N103, Tau FL, Tau N368, α-Syn FL/Tau FL, and α-Syn N103/Tau N368 on day 4 (a) and day 8 (b). Scale bar, 200 nm. c Quantification of proteinase K digestion rates of PFFs. The bar graph showed quantification of the relative intensity of the cleaved bands versus uncleaved band by different concentrations of proteinase K. Results are shown as means ± SEM; n = 3 independent experiments; *P < 0.05, **P < 0.01 by two-tailed Student’s t-test. d PFFs (α-Syn N103/Tau N368) are resistant to proteinase K digestion. Proteinase K digestion patterns of α-Syn FL, α-Syn N103, Tau FL, Tau N368, α-Syn FL/Tau FL and α-Syn N103/Tau N368 (100 µM monomer concentration), were monitored on Coomassie blue stained SDS-PAGE (18%). ej X-ray diffraction pattern of partially aligned α-Syn FL (e), α-Syn N103 (g), Tau FL (i), Tau N368 (f), α-Syn FL + Tau FL (h) and α-Syn N103 + Tau N368 (j) fibrils
Fig. 3
Fig. 3
PFFs of α-Syn N103/Tau N368 trigger phosphorylation of endogenous counterparts in dopaminergic neuron. ad Representative images of immunofluorescent staining using TH, α-Syn p-S129, Tau phosphorylation (AT8) and mouse α-Syn (Syn505) antibodies. Primary neurons (DIV 10) were treated with 100 nM of α-Syn FL, α-Syn N103, Tau FL, Tau N368, α-Syn FL + Tau FL, α-Syn N103 + Tau N368 PFFs, and PBS for 8 days. Immunostaining showed the endogenous mouse TH, α-Syn p-S129, Tau AT8 (Ser202, Thr205) and human α-Syn expression levels with or without 6 different PFFs. Scale bar, 50 µm. e Quantification bar graph of TH-, MAP2-, α-Syn p-S129- and Tau AT8-positive cells. Results are shown as means ± SEM; n = 3 independent experiments; *P < 0.05, **P < 0.01 by two-tailed Student’s t-test
Fig. 4
Fig. 4
Rotenone initiates α-Syn N103/Tau N368 complex formation in the gut and brain, inducing PD pathologies and motor dysfunctions in an AEP-dependent manner. a Motor function behavioral test. Four different mouse strains (3 months old) including WT, AEP KO, SNCA/AEP KO and SNCA/AEP WT mice were orally administered with 2.5 mg/kg of rotenone daily for 3 months (n = 10 mice per group; *P < 0.05, two-way ANOVA). b Chronic low-dose rotenone treatment triggers dopaminergic neuronal loss in the brain. Left panel, TH immunostaining of the brain SN region tissues of SNCA/AEP WT and SNCA/AEP−/− mice. Scale bar, 200 μm. Right panels, bar graph of stereologically counted TH- and NeuN-positive cells. Results are shown as means ± SEM; n = 6 independent experiments; *P < 0.05, **P < 0.01 by two-way ANOVA. c, d Rotenone induces α-Syn and Tau cleavage and the complex travels along the vagus nerve. α-Syn N103 and Tau N368 were co-immunostained in the vagus nerve of SNCA transgenic mice but not SNCA/AEP−/− mice (Cy5-gray, lectin; Alexa 488-green, α-Syn N103; Alexa 594-red, Tau N368). Scale bar, 2 mm. e TUNEL staining of TH-positive cells in SN of SNCA/AEP mice. Rotenone induced more TUNEL-positive TH cell death in SNCA/AEP WT mice than SNCA/AEP−/− mice. The bottom right panel is positive control for TUNEL staining of MPTP-treated SNCA transgenic mice. Scale bar, 50 μm. Bar graph in bottom left panel shows the quantification of TUNEL-positive cells. n = 6 each group; **P < 0.01, Student’s t-test. f Rotenone induces TH apoptotic loss and AEP activation in the gut of SNCA but not SNCA/AEP−/− mice. Representative immunoblotting images showed the expression of TH, 5HT2A, α-Syn p-S129, truncated α-Syn, Tau and p-Tau AT8 and active caspase-3 in the colon. α-tubulin is loading control. g Rotenone induces TH apoptotic loss and AEP activation in the SN of SNCA but not SNCA/AEP−/− mice. Immunoblotting showed the expression of TH, α-Syn p-S129, truncated α-Syn and Tau, Tau AT8 and active caspase-3 in the SN. α-tubulin is loading control. All of experiments were performed three times independently
Fig. 5
Fig. 5
AEP-cleaved α-Syn N103 and Tau N368 are augmented in PD patients’ gut and brain. a Immunostaining showed AEP (green) and TH (red) expression levels in the brains (SN) of the age-matched healthy control and PD patient. Immunofluorescent staining showed α-Syn N103 (green) and Tau N368 (red) co-localization in the PD patient’s SN. Scale bar, 200 µm. Quantification showed the increase of α-Syn N103 and Tau N368 co-localized cells in PD patient’s SN in the lower bar graph. n = 6 sections each from 4 patients and 4 healthy controls; **P < 0.01. b AEP and TH immunofluorescent staining of colons of age-matched healthy control and PD patient. Immunofluorescent staining showed that α-Syn N103 (green) and Tau N368 (green) were co-localized with TH (red) in the PD patient’s colon. Scale bar, 200 µm. Quantification of dopaminergic neurons with α-Syn N103 and Tau N368 co-localization in PD patient’s colon in the lower bar graph of a. n = 6 sections each from 4 patients and 4 healthy controls; **P < 0.01
Fig. 6
Fig. 6
Colonic injection of PFFs of α-Syn N103/Tau N368 complex elicits PD pathologies and behavioral disorders. a α-Syn pathology spread in the interconnected brain regions of dopaminergic neurons of SNCA mice 3 months after the colonic injection of the sonicated PFFs. Brain sections of DMV-SN-Striatum were immunostained by anti-α-Syn p-S129 antibody. Scale bar, 200 μm. In the left brain atlas, the marked red dots in every spot containing positive cells show the spreading, which is the frame of 50 × 50 μm in size under microscope. b Tau pathology was detected in the synaptically connected brain regions of noradrenergic neuron of SNCA transgenic mice 3 months after the colonic injection of PFFs. Brain sections of NTS-LC-HC were examined by anti-AT8 immunohistochemistry. Scale bar, 200 μm. cg The complex PFFs (α-Syn N103/Tau N368) induced motor defects and memory deficits 3 months after the colonic injection. Motor behavioral assays, rotarod (c), grid performance (d), object recognition (e), tail suspension (f), and water maze tests (g) were conducted. Data are shown as means ± SEM. n = 7 each group; *P < 0.05. h p-S129-positive cells in SN of a and AT8-positive cells in LC of b were quantified by counting. Data are shown as means ± SEM. n = 7 each group; *P < 0.05, **P < 0.01. i TH cell loss in SN and striatum of the above animals was analyzed by immunohistochemistry and immunofluorescence staining. Scale bar, 200 μm. α-Syn aggregates in SN were confirmed by anti-α-Syn p-S129 and anti-ubiquitin immunofluorescent staining. Scale bar, 50 μm. Neuroinflammation was verified by anti-IbaI immunofluorescent staining. Scale bar, 50 μm. j, k Quantification of TH-positive cells in the SN by stereological analysis (j) and fluorescence intensity of TH-positive cells in striatum (k). Data are shown as means ± SEM. n = 7 each group; *P < 0.05. l Fluorescence intensity of IbaI-positive cells in the SN was quantified by ImageJ. Data are shown as means ± SEM. n = 7 each group; *P < 0.05
Fig. 7
Fig. 7
Intrastriatal inoculation of α-Syn N103/Tau N368 PFFs initiates α-synucleinopathy in mice. a The PFFs injected into the striatum spread to other interconnected brain regions. Various strains of PFFs were injected into the striatum of WT mice. After 3 months, the mice were sacrificed and the brain sections were immunostained with anti-α-Syn p-S129 antibody. The spreading was confirmed by anti-α-Syn p-S129 immunohistochemistry and shown by the schematics with red dots. PFFs except Tau and Tau N368 were spreaded to the synaptically connected brain regions including striatum, SN, amygdala, and cortex. However, the expression of α-Syn p-S129 was not shown in hippocampus of any group. The α-Syn pathology was spreaded to olfactory bulb in the α-Syn N103 + Tau N368 group. Scale bar, 50 μm. b α-Syn pathology was detected in the SN 3 months after α-Syn N103/Tau N368 complex PFF injection into the striatum. α-Syn p-S129 expression in the SN was examined by immunofluorescent staining. Scale bar, 20 μm. c α-Syn p-S129-positive cells in SN of each group were quantified by counting. Data are shown as means ± SEM. n = 7 each group; *P < 0.05, **P < 0.01. d TH cell loss in SN and striatum of the above animals was analyzed by immunohistochemistry and immunofluorescence staining (Scale bar, 200 μm), and α-Syn aggregates of SN were confirmed by anti-α-Syn p-S129 and anti-ubiquitin immunofluorescent staining (Scale bar, 50 μm). Neuroinflammation was verified by anti-IbaI immunofluorescent staining (Scale bar, 50 μm). e, f Quantification of TH- and NeuN-positive cells in SN by stereological analysis. g Fluorescence intensity of TH-positive cells in the striatum was quantified by ImageJ. Data are shown as means ± SEM. n = 7 each group; *P < 0.05. h Fluorescence intensity of IbaI-positive cells in the SN was quantified by ImageJ. Data are shown as means ± SEM. n = 7 each group; *P < 0.05, **P < 0.01

References

    1. Savitt JM, Dawson VL, Dawson TM. Diagnosis and treatment of Parkinson disease: molecules to medicine. J. Clin. Invest. 2006;116:1744–1754. - PMC - PubMed
    1. Olanow CW, Brundin P. Parkinson’s disease and alpha synuclein: is Parkinson’s disease a prion-like disorder? Mov. Disord. 2013;28:31–40. - PubMed
    1. Hirai Y, Fujita SC, Iwatsubo T, Hasegawa M. Phosphorylated alpha-synuclein in normal mouse brain. FEBS Lett. 2004;572:227–232. - PubMed
    1. Kruger R, et al. Ala30Pro mutation in the gene encoding alpha-synuclein in Parkinson’s disease. Nat. Genet. 1998;18:106–108. - PubMed
    1. Polymeropoulos MH, et al. Mutation in the alpha-synuclein gene identified in families with Parkinson’s disease. Science. 1997;276:2045–2047. - PubMed

Publication types

MeSH terms