. 2019 Oct 9:13:1048.
doi: 10.3389/fnins.2019.01048. eCollection 2019.

Region-Specific Response of Astrocytes to Prion Infection

Affiliations

Region-Specific Response of Astrocytes to Prion Infection

Natallia Makarava et al. Front Neurosci. .

Abstract

Chronic neuroinflammation involves reactive microgliosis and astrogliosis, and is regarded as a common pathological hallmark of neurodegenerative diseases including Alzheimer's, Parkinson's, ALS and prion diseases. Reactive astrogliosis, routinely observed immunohistochemically as an increase in glial fibrillary acidic protein (GFAP) signal, is a well-documented feature of chronic neuroinflammation associated with neurodegenerative diseases. Recent studies on single-cell transcriptional profiling of a mouse brain revealed that, under normal conditions, several distinct subtypes of astrocytes with regionally specialized distribution exist. However, it remains unclear whether astrocytic response to pro-inflammatory pathological conditions is uniform across whole brain or is region-specific. The current study compares the response of microglia and astrocytes to prions in mice infected with 22L mouse-adapted prion strain. While the intensity of reactive microgliosis correlated well with the extent of PrPSc deposition, reactive astrogliosis displayed a different, region-specific pattern. In particular, the thalamus and stratum oriens of hippocampus, which are both affected by 22L prions, displayed strikingly different response of astrocytes to PrPSc. Astrocytes in stratum oriens of hippocampus responded to accumulation of PrPSc with visible hypertrophy and increased GFAP, while in the thalamus, despite stronger PrPSc signal, the increase of GFAP was milder than in hippocampus, and the change in astrocyte morphology was less pronounced. The current study suggests that astrocyte response to prion infection is heterogeneous and, in part, defined by brain region. Moreover, the current work emphasizes the needs for elucidating region-specific changes in functional states of astrocytes and exploring the impact of these changes to chronic neurodegeneration.

Keywords: astrocytes; chronic neuroinflammation; hippocampus; microglia; prion; prion diseases; reactive astrogliosis; thalamus.


Figures

FIGURE 1
FIGURE 1
Histopathological analysis of 22L-infected mouse brains. (A) Deposition of PrPSc stained with SAF-84 antibody, vacuolation stained with hematoxylin-eosin, and activated microglia and astrocytes stained for Iba1 and GFAP, respectively, in hippocampus and thalamus of C57Bl/6J mice inoculated with 22L prions (s-or, stratum oriens). (B) Staining of normal age-matched control mice is shown as reference. Scale bar = 200 μm.
FIGURE 2
FIGURE 2
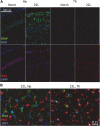
Co-immunostaining of microglia and astrocytes. (A) Representative images of fluorescent co-immunostaining of microglia (Iba1, red) and astrocytes (GFAP, green) in thalamus (Th) and hippocampus (Hp) of C57Bl/6J mice inoculated with 22L prions and normal age-matched controls (Norm). DAPI (blue) was used for staining of nuclei. (B) Magnified merged images of 22L-infected stratum oriens of the hippocampus (left) and thalamus (right).
FIGURE 3
FIGURE 3
Microglia and astrocyte reaction in the thalamus and hippocampus of SSLOW-Mo-infected mice. Activated microglia and astrocytes stained for Iba1 and GFAP, respectively, in hippocampus and thalamus of C57Bl/6J mice inoculated with SSLOW-Mo. Three panels represent three individual animals. Scale bar = 200 μm.
FIGURE 4
FIGURE 4
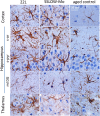
Analysis of region-specific astrocyte morphology. Imaging of astrocytes stained for GFAP in cortex, hippocampus (s-or, stratum oriens; s-pyr, stratum pyramidale; ml DG, molecular layer of dentate gyrus) and thalamus of C57Bl/6J mice inoculated with 22L prions, SSLOW-Mo and normal aged controls. Scale bar = 20 μm.
FIGURE 5
FIGURE 5
Comparison of region-specific microglial and astrocytic response to 22L prion infection. Quantification of Iba1 (A, red) and GFAP (B, green) immunofluorescence in thalamus (Th) and stratum oriens of the hippocampus (Hp) of C57Bl/6J mice inoculated with 22L prions and normal age-matched controls (Norm). The data (n = 4 animals per group) were collected and plotted as mean integrated density ± Standard Error of measurement. Statistical significance (p) was calculated by Student’s t-test and indicated as ∗∗ for p < 0.01 and **** for p < 0.0001.
FIGURE 6
FIGURE 6
Analysis of region-specific astrocyte morphology. Imaging of astrocytes stained for S100ß, GFAP or Aldh1l1 in stratum oriens of hippocampus (s-or) and thalamus of C57Bl/6J mice inoculated with 22L prions and normal age-matched controls. Scale bar = 20 μm.
FIGURE 7
FIGURE 7
Co-immunostaining for GFAP and S100ß. Representative images of fluorescent co-immunostaining for GFAP (green) and S100ß (red) in thalamus (Th) and stratum oriens of the hippocampus (Hp s-or) of C57Bl/6J mice inoculated with 22L prions and normal age-matched controls (Norm). Scale bar = 10 μm.
FIGURE 8
FIGURE 8
Co-immunostaining for GFAP and Aldh1l1. Representative images of fluorescent co-immunostaining for GFAP (green) and Aldh1l1 (red) in thalamus (Th) and stratum oriens of the hippocampus (Hp s-or) of C57Bl/6J mice inoculated with 22L prions and normal age-matched controls (Norm). Scale bar = 10 μm.
FIGURE 9
FIGURE 9
Quantification of astrocyte-specific markers S100ß and Aldh1l1. Quantification of immunofluorescence for astrocyte-specific markers S100ß (A) and Aldh1l1 (B) in thalamus (Th) and stratum oriens of the hippocampus (Hp s-or) of C57Bl/6J mice inoculated with 22L prions and normal age-matched controls (Norm). Quantification of GFAP is provided as a reference. The data (n = 4 animals per group) were collected and plotted as mean integrated density ± Standard Error of measurement. Statistical significance (p) was calculated by Student’s t-test and indicated as **** for p < 0.0001.
FIGURE 10
FIGURE 10
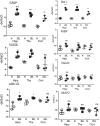
Analysis of gene expression by qRT-PCR. The ΔCt of astrocytic markers GFAP, S100ß and Aldh1l1, microglial marker Iba1, oligodendrocytic marker MBP and neuronal markers NeuN and MAP2 in thalamus (Tha), hippocampus (Hipp) and cortex (Cort) of C57Bl/6J mice inoculated with 22L prions and normal age-matched controls (N). The mean and standard deviation are shown (n = 3 individual animals). Each symbol represents an individual mouse. GAPDH was used as a housekeeping gene. Statistical significance (p) was calculated by Student’s unpaired t-test and indicated as for p < 0.05; ∗∗ for p < 0.01; ∗∗∗ for p < 0.001; ns for non-significant.
FIGURE 11
FIGURE 11
3D analysis of astrocytic phenotype. ΔCt data of the three astrocytic markers GFAP, S100ß and Aldh1l1 in thalamus (Th) and hippocampus (Hp) of C57Bl/6J mice infected with 22L prions and normal age-matched controls are plotted in a 3D format. Each symbol represents an individual mouse. In normal mice, the pattern of gene expression shows two clusters, thalamus- and hippocampus-specific (Th – blue and Hp – green, respectively), which merge into one cluster (Th – black and Hp – red) in prion-infected mice.

References

    1. Aguzzi A., Liu Y. (2017). A role for astroglia in prion diseases. J. Exp. Med. 214:3477. 10.1084/jem.20172045 - DOI - PMC - PubMed
    1. Asuni A. A., Gray B., Bailey J., Skipp P., Perry V. H., O’Connor V. (2014). Analysis of the hippocampal proteome in ME7 prion disease reveals a predominant astrocytic signature and highlights the brain-restricted production of clusterin in chronic neurodegeneration. J. Biol. Chem. 289 4532–4545. 10.1074/jbc.M113.502690 - DOI - PMC - PubMed
    1. Baker C. A., Manuelidis L. (2003). Unique inflammatory RNA profiles of microglia in creutzfeldt-jakob disease. Proc. Natl. Acad. Sci. U.S.A. 100 675–679. 10.1073/pnas.0237313100 - DOI - PMC - PubMed
    1. Bate C., Boshuizen R. S., Langeveld J. P. M., Williams A. (2002). Temporal and spatial relationship between the death of PrP-damaged neurons and microglial activation. Neuroreport 13 1695–1700. 10.1097/00001756-200209160-00025 - DOI - PubMed
    1. Bianchi R., Adami C., Giambanco I., Donato R. (2007). S100B binding to RAGE in microglia stimulates COX-2 expression. J. Leukoc Biol. 81 108–118. 10.1189/jlb.0306198 - DOI - PubMed