. 2020 Feb;11(1):208-225.
doi: 10.1002/jcsm.12496. Epub 2019 Oct 25.

Skeletal muscle mTORC1 regulates neuromuscular junction stability

Affiliations

Skeletal muscle mTORC1 regulates neuromuscular junction stability

Martina Baraldo et al. J Cachexia Sarcopenia Muscle. 2020 Feb.

Abstract

Background: Skeletal muscle is a plastic tissue that can adapt to different stimuli. It is well established that Mammalian Target of Rapamycin Complex 1 (mTORC1) signalling is a key modulator in mediating increases in skeletal muscle mass and function. However, the role of mTORC1 signalling in adult skeletal muscle homeostasis is still not well defined.

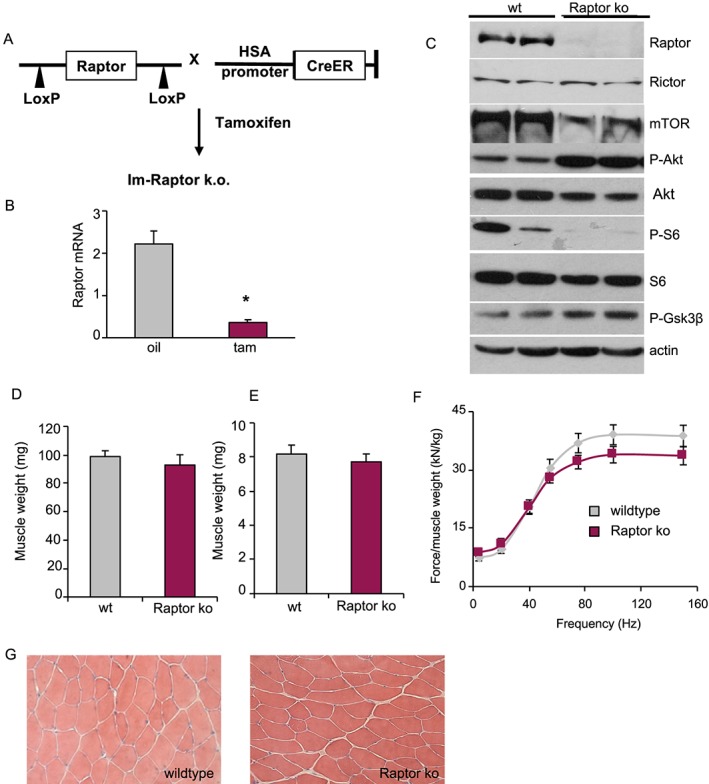
Methods: Inducible, muscle-specific Raptor and mTOR k.o. mice were generated. Muscles at 1 and 7 months after deletion were analysed to assess muscle histology and muscle force.

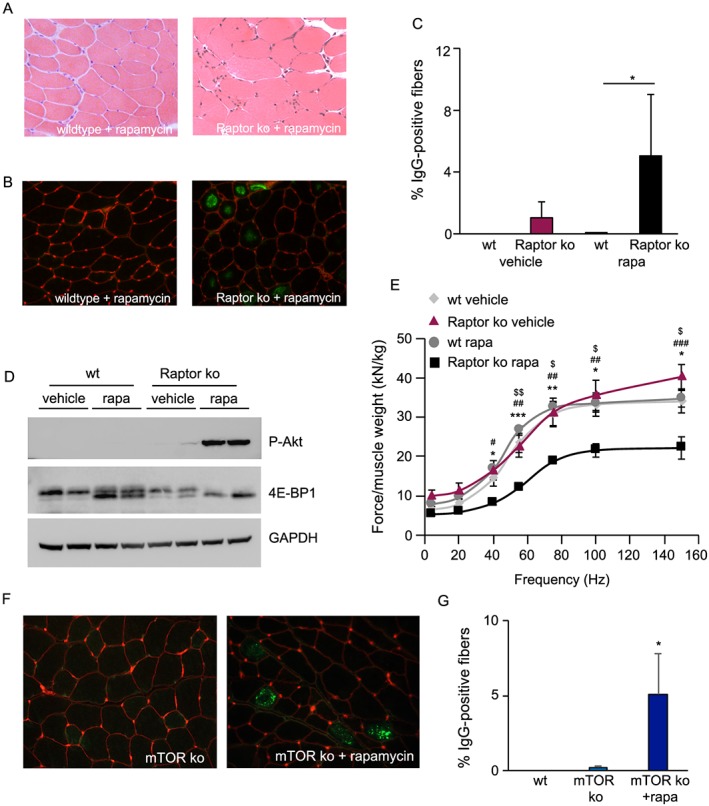
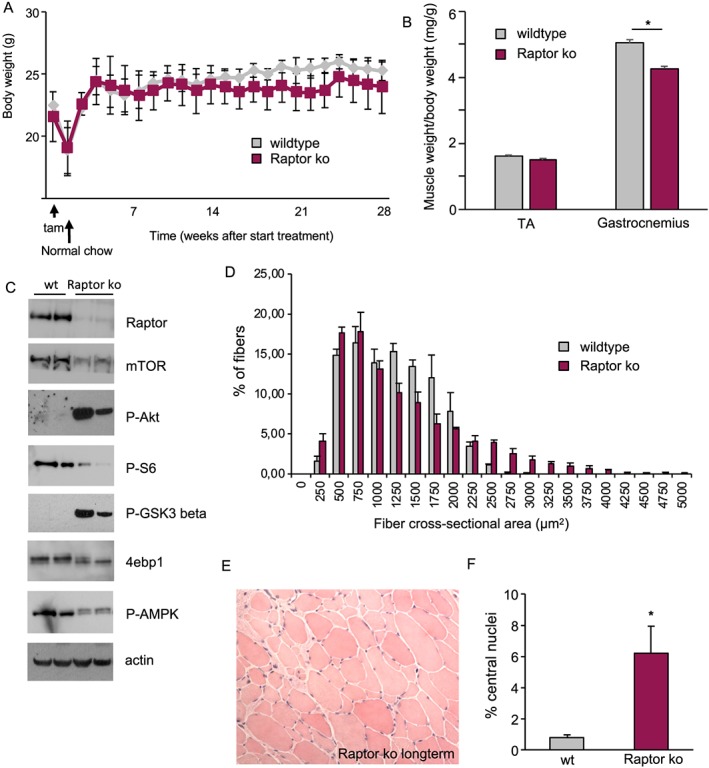
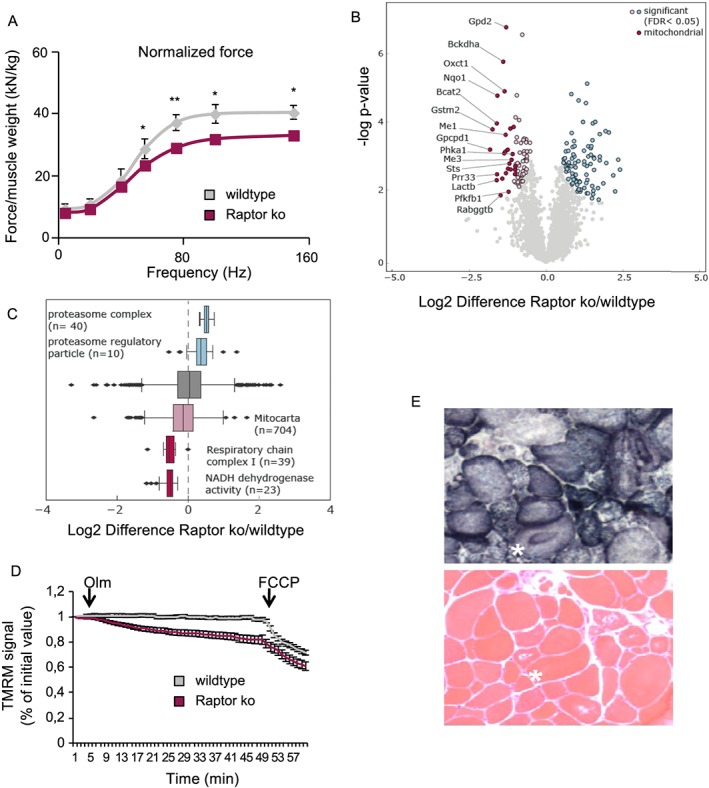
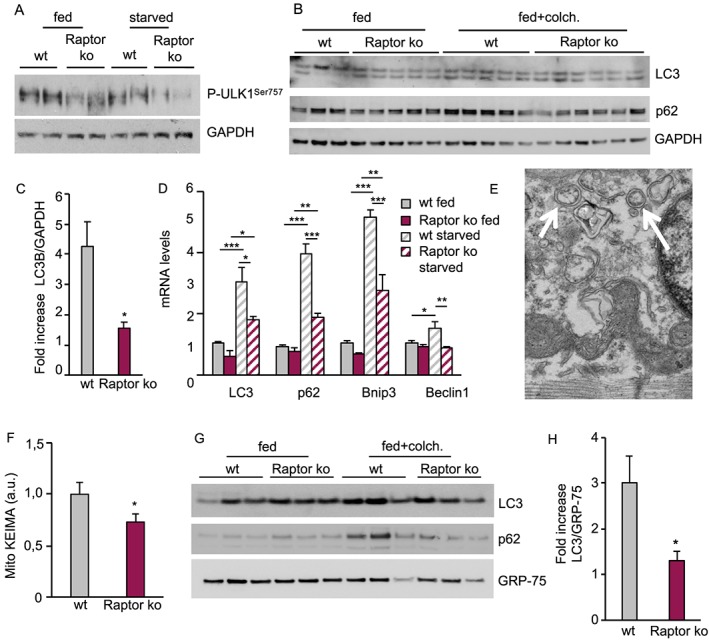
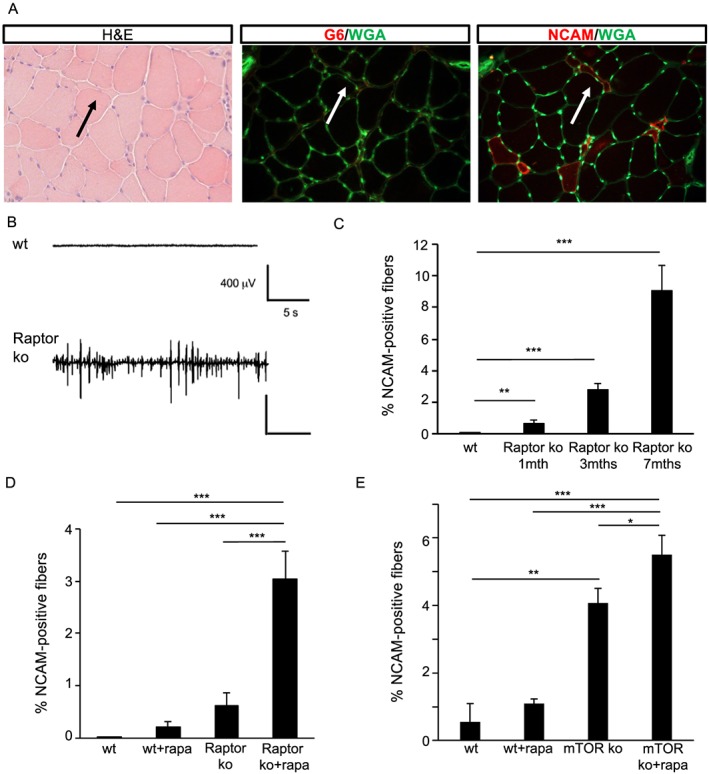
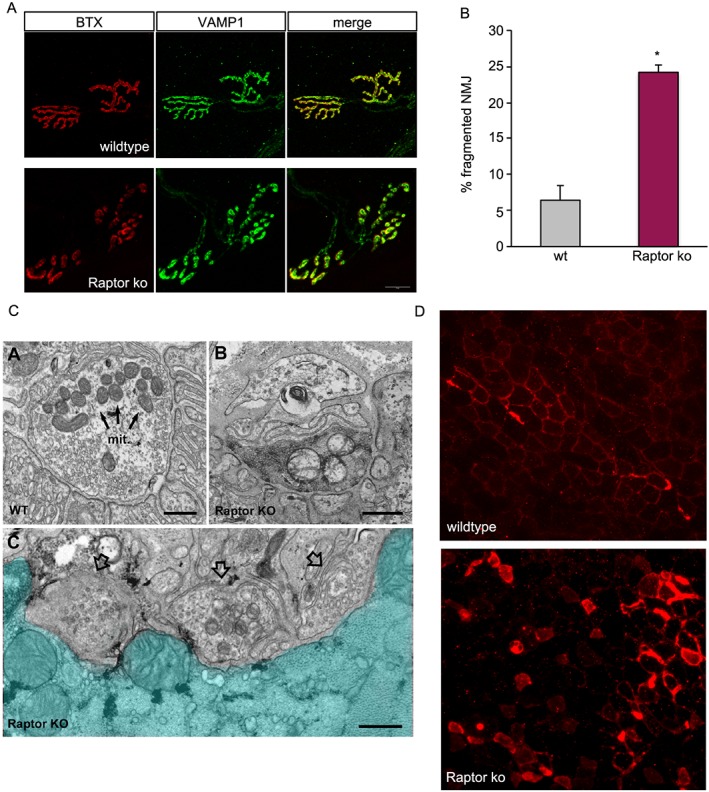
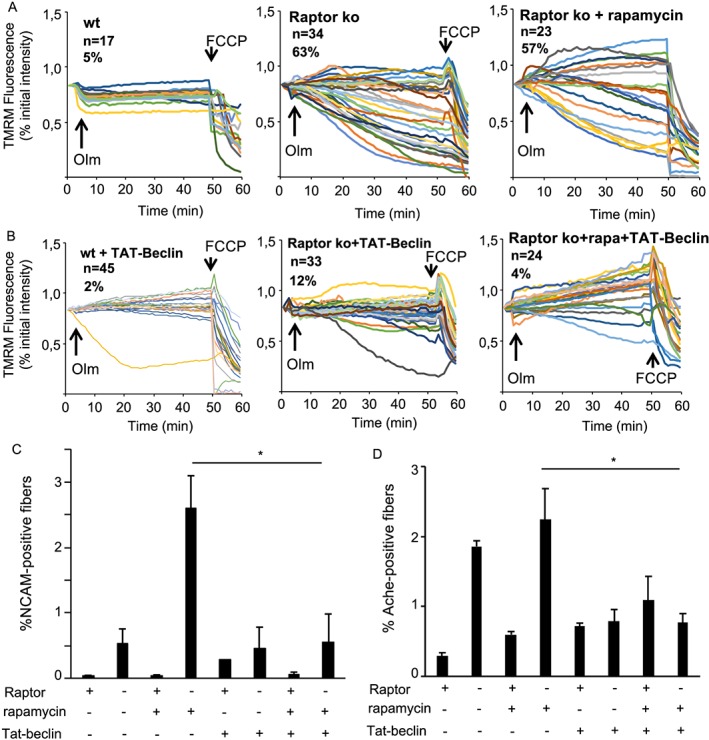
Results: We found no change in muscle size or contractile properties 1 month after deletion. Prolonging deletion of Raptor to 7 months, however, leads to a very marked phenotype characterized by weakness, muscle regeneration, mitochondrial dysfunction, and autophagy impairment. Unexpectedly, reduced mTOR signalling in muscle fibres is accompanied by the appearance of markers of fibre denervation, like the increased expression of the neural cell adhesion molecule (NCAM). Both muscle-specific deletion of mTOR or Raptor, or the use of rapamycin, was sufficient to induce 3-8% of NCAM-positive fibres (P < 0.01), muscle fibrillation, and neuromuscular junction (NMJ) fragmentation in 24% of examined fibres (P < 0.001). Mechanistically, reactivation of autophagy with the small peptide Tat-beclin1 is sufficient to prevent mitochondrial dysfunction and the appearance of NCAM-positive fibres in Raptor k.o. muscles.

Conclusions: Our study shows that mTOR signalling in skeletal muscle fibres is critical for maintaining proper fibre innervation, preserving the NMJ structure in both the muscle fibre and the motor neuron. In addition, considering the beneficial effects of exercise in most pathologies affecting the NMJ, our findings suggest that part of these beneficial effects of exercise are through the well-established activation of mTORC1 in skeletal muscle during and after exercise.

Keywords: Autophagy; Mitochondrial dysfunction; NMJ; mTOR.


Conflict of interest statement

The authors declare that they have no conflict of interest.

Figures

Figure 1
Figure 1
Generation of inducible muscle‐specific Raptor knockout mice (Raptor k.o.). (A) Raptor k.o. mice are generated by crossing two transgenic lines, one expressing two LoxP sites flanking exon 6 of the Raptor gene and one expressing a tamoxifen‐inducible form of Cre (CreER) driven by a human skeletal actin (HSA)‐promoter. Mice were treated with tamoxifen food for 3 weeks to delete the Raptor gene. (B) RT‐PCR for Raptor 4 weeks after the start of tamoxifen treatment shows a strong downregulation of Raptor (n = 4 mice per group). (C) Western blot of muscles taken out 4 weeks after the start of tamoxifen treatment. (D, E) Wet weight of gastrocnemius (D) and soleus muscles (E) is not different between groups (n = 6 mice per group). (F) Force production of the gastrocnemius muscle does not show any difference between wt and Raptor k.o. muscles (n = 4 per group). (G) H&E staining shows no pathological signs 1 month after Raptor deletion. Data are shown as mean ± SEM. Statistical analysis was performed using two‐tailed Student's t‐test. Statistical significance: *P < 0.05.
Figure 2
Figure 2
Rapamycin treatment in Raptor k.o. mice induces a very significant myopathy. (A) H&E staining of wild‐type and Raptor k.o. muscles treated for 2 weeks with rapamycin. In Raptor k.o. mice, rapamycin leads to appearance of myopathic features (right panel). (B) Necrotic fibres are identified by a mouse IgG staining, which is a sign of membrane permeability. (C) Quantification of IgG positive myofibers, indicative of fibre necrosis (n = 4 muscles/group). (D) Rapamycin treatment leads to a hyperphosphorylation of Akt, with a reduced 4E‐BP1 phosphorylation, underlining the complete mTORC1 inhibition. (E) Normalized force of the gastrocnemius muscle of Raptor k.o. mice is severely reduced after rapamycin treatment, while this does not affect the force in wild‐type mice (n = 6–8 per group). (F) Inducible, muscle‐specific knockout of mTOR does not lead to muscle wasting or the appearance of IgG positive fibres. Only after 2 weeks of rapamycin treatment do we observe numerous positive fibres. (G) Quantification of IgG positive myofibers in mTOR k.o. muscles treated with vehicle or rapamycin (n = 4 per group). Data are shown as mean ± SEM. Statistical analysis was performed using two‐tailed Student's t‐test and two‐way ANOVA when required. Statistical significance: *P < 0.05, **P < 0.01, and ***P < 0.001. With regard to Figure 2E, Raptor k.o. rapamycin was compared with *, wild‐type rapamycin; #, Raptor k.o. vehicle; and $, wild‐type vehicle.
Figure 3
Figure 3
Long‐term deletion of Raptor does not reduce body weight or longevity. (A) Three‐month‐old mice were placed on tamoxifen food for 3 weeks after which they were placed on regular chow. Mice were injected every month with an injection of tamoxifen for three consecutive days to avoid re‐introduction of Raptor via satellite cell proliferation (n = 6 per group). (B) Average muscle ratio of weight/body weight of TA and gastrocnemius muscles 6 months after Raptor deletion (n = 6 per group). (C) Analysis of Akt‐mTOR signalling pathway shows increased phosphorylation of Akt and GSK‐3β in long‐term Raptor k.o. muscles. (D, E, F) Histological analysis 6 months after Raptor deletion shows fibre size heterogeneity and central nuclei (n = 6 per group). Data are shown as mean ± SEM. Statistical analysis was performed using two‐tailed Student's t‐test. Statistical significance: *P < 0.05.
Figure 4
Figure 4
Long‐term deletion of Raptor leads to mitochondrial dysfunction with reduced force production. (A) Normalized force measured in vivo is significantly reduced in Raptor k.o. mice (n = 6 per group). (B) Volcano plot of differentially regulated proteins in Raptor k.o. muscles 7 months after the deletion of Raptor (n = 3). Significantly regulated proteins are marked in blue and light red (FDR < 0.05, s0 = 0.1, number of permutations: 500). Mitochondrial proteins are highlighted in dark red. (C) Box plot of log2 Raptor k.o./wild‐type ratios of proteins associated with the proteasome, the respiratory chain complexes or the mitochondrion. (D) Mitochondrial dysfunction revealed by TMRM. Oligomycin (Olm) and the protonophore FCCP were added at the indicated timepoints (n = 30/group). (E) Mitochondrial morphology is drastically altered in Raptor k.o. muscles. Data are shown as mean ± SEM. Statistical analysis was performed using two‐tailed Student's t‐test. Statistical significance: *P < 0.05 and **P < 0.01.
Figure 5
Figure 5
Long‐term deletion of Raptor leads to a block in autophagic flux. (A) Reduction in ULK1 phosphorylation on its inhibitory mTOR site. (B) Western blotting for LC3, p62, and GAPDH after treatment with the autophagy inhibitor colchicine shows a reduction in autophagic flux as evidenced by the lack of increased LC3 lipidation after 24 h of colchicine treatment. (C) Relative increase in LC3 lipidation after colchicine treatment (n = 4–5 muscles/group). (D) Strong reduction in the transcription of autophagy‐related genes under basal and starvation conditions at 1 month after deletion (n = 6–7 per group). (E) Electron microscopy images showing the accumulation of numerous intracellular vesicles (white arrows). (F) MitoKEIMA measurement shows a reduced mitophagy after long‐term Raptor deletion (n = 4–5 muscles/group). (G) Western blot for LC3 and p62 on the isolated mitochondrial fraction shows an impaired mitophagic flux in Raptor k.o. muscles. GRP‐75 was used for normalization of mitochondrial content (n = 4 muscles/group). (H) Quantification of LC3 in isolated mitochondria from wt and Raptor k.o. mice (n = 4 muscles/group). Data are shown as mean ± SEM. Statistical analysis was performed using two‐tailed Student's t‐test and two‐way ANOVA when required. Statistical significance: *P < 0.05, **P < 0.01, and ***P < 0.001.
Figure 6
Figure 6
Loss of mTORC1 signalling leads to the appearance of denervated muscle fibres. (A) H&E staining shows numerous small, angulated fibres, which are positive for a marker of denervated fibres (NCAM) and negative for embryonic myosin heavy chain (G6), a marker of regenerating fibres. (B) Long‐term Raptor k.o. muscles show spontaneous fibrillations, which are completely absent in wt mice. Calibration bars in Raptor k.o. mice is the same as in wild‐type mice (n = 4 muscles/group). (C) The percentage of NCAM‐positive fibres increases over time in the Raptor k.o. mice. (D) Number of NCAM‐positive fibres increases in Raptor k.o. mice after 2 weeks of rapamycin treatment (n = 5–7 muscles/group). (E) Also, mTOR k.o. mice show a significant increase in NCAM‐positive fibres, which is further increased by rapamycin treatment. Data are shown as mean ± SEM. Statistical analysis was performed using two‐tailed Student's t‐test and two‐way ANOVA when required. Statistical significance: *P < 0.05, **P < 0.01, and ***P < 0.001.
Figure 7
Figure 7
Reduced mTORC1 signalling leads to neuromuscular junction fragmentation. (A) NMJs in wt muscles show their normal pretzel‐like shape. Raptor k.o. mice show numerous NMJs in which both presynaptic (VAMP1) and postsynaptic [acetylcholine receptor (BTX)] structures accumulate in individual, non‐connected aggregates. (B) Quantification of the percentage of fragmented NMJs in wt and long‐term Raptor k.o. mice (n = 4 mice/group). (C) Electron microscope images of NMJs in wild‐type and Raptor k.o. muscles. Note the altered presynaptic structures in Raptor k.o. muscles. (D) Staining for acetylcholinesterase in wild‐type and Raptor k.o. muscles. Data are shown as mean ± SEM. Statistical analysis was performed using two‐tailed Student's t‐test. Statistical significance: *P < 0.05.
Figure 8
Figure 8
Reactivation of autophagy by Tat‐beclin1 prevents the appearance of NCAM‐positive fibres in Raptor k.o. muscles. (A) TMRM measurement of mitochondrial membrane potential in isolated fibres from the FDB muscle. Raptor k.o. fibres, both with and without rapamycin treatment, show a significant mitochondrial depolarization after oligomycin addition. (B) Mice treated for 2 weeks daily with Tat‐beclin1 completely prevented the mitochondrial dysfunction in Raptor k.o. fibres. (C, D) Gastrocnemius muscles taken from mice treated for 2 weeks with rapamycin and Tat‐beclin1 and stained for NCAM or AchE. No increase in NCAM or AchE staining in Raptor k.o. mice after co‐treatment with rapamycin and Tat‐beclin1 (n = 4–6 muscles/group). Data are shown as mean ± SEM. Statistical analysis was performed using two‐tailed Student's t‐test and two‐way ANOVA when required. Statistical significance: *P < 0.05.

References

    1. Laplante M, Sabatini DM. mTOR signaling in growth control and disease. Cell 2012;149:274–293. - PMC - PubMed
    1. Pereira MG, Dyar KA, Nogara L, Solagna F, Marabita M, Baraldo M, et al. Comparative analysis of muscle hypertrophy models reveals divergent gene transcription profiles and points to translational regulation of muscle growth through increased mTOR signaling. Front Physiol 2017;8:968. - PMC - PubMed
    1. Marabita M, Baraldo M, Solagna F, Ceelen JJ, Sartori R, Nolte H, et al. S6K1 Is required for increasing skeletal muscle force during hypertrophy. Cell Rep 2016;17:501–513. - PubMed
    1. Mammucari C, Milan G, Romanello V, Masiero E, Rudolf R, Del Piccolo P, et al. FoxO3 controls autophagy in skeletal muscle in vivo. Cell Metab 2007;6:458–471. - PubMed
    1. Milan G, Romanello V, Pescatore F, Armani A, Paik JH, Frasson L, et al. Regulation of autophagy and the ubiquitin‐proteasome system by the FoxO transcriptional network during muscle atrophy. Nat Commun 2015;6:6670. - PMC - PubMed

Publication types

Substances