

Implementing integrated services in routine behavioral health care: primary outcomes from a cluster randomized controlled trial
- PMID: 31651302
- PMCID: PMC6814122
- DOI: 10.1186/s12913-019-4624-x
Implementing integrated services in routine behavioral health care: primary outcomes from a cluster randomized controlled trial
Abstract
Background: An estimated 8.2 million adults in the United States live with co-occurring mental health and substance use disorders. Although the benefits of integrated treatment services for persons with co-occurring disorders has been well-established, gaps in access to integrated care persist. Implementation research can address this gap. We evaluated if the Network for the Improvement of Addiction Treatment (NIATx) implementation strategy was effective in increasing integrated services capacity among organizations treating persons with co-occurring disorders.
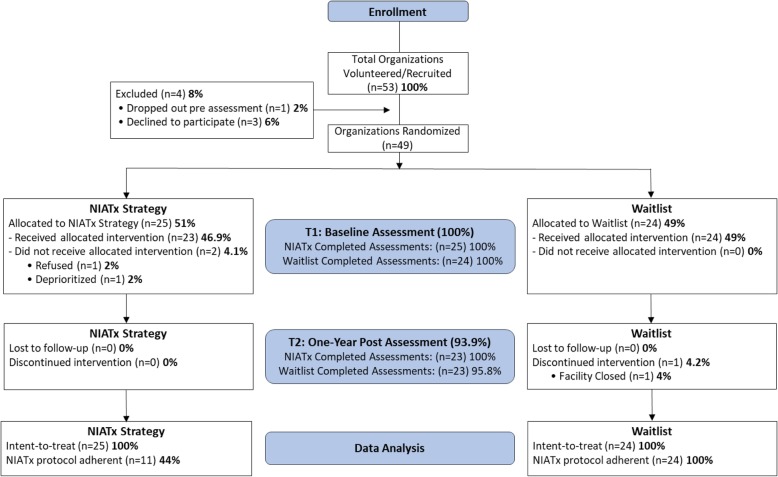
Methods: This study employed a cluster randomized waitlist control group design. Forty-nine addiction treatment organizations from the State of Washington were randomized into one of two study arms: (1) NIATx strategy (active implementation strategy), or (2) waitlist (control). The primary outcome was a standardized organizational measure of integrated service capability: the Dual Diagnosis in Addiction Treatment (DDCAT) Index. Intent-to-treat analyses and per-protocol analyses were conducted to address the following questions: (1) Is NIATx effective in increasing integrated service capacity? and (2) Are there differences in organizations that actually use NIATx per-protocol versus those that do not?
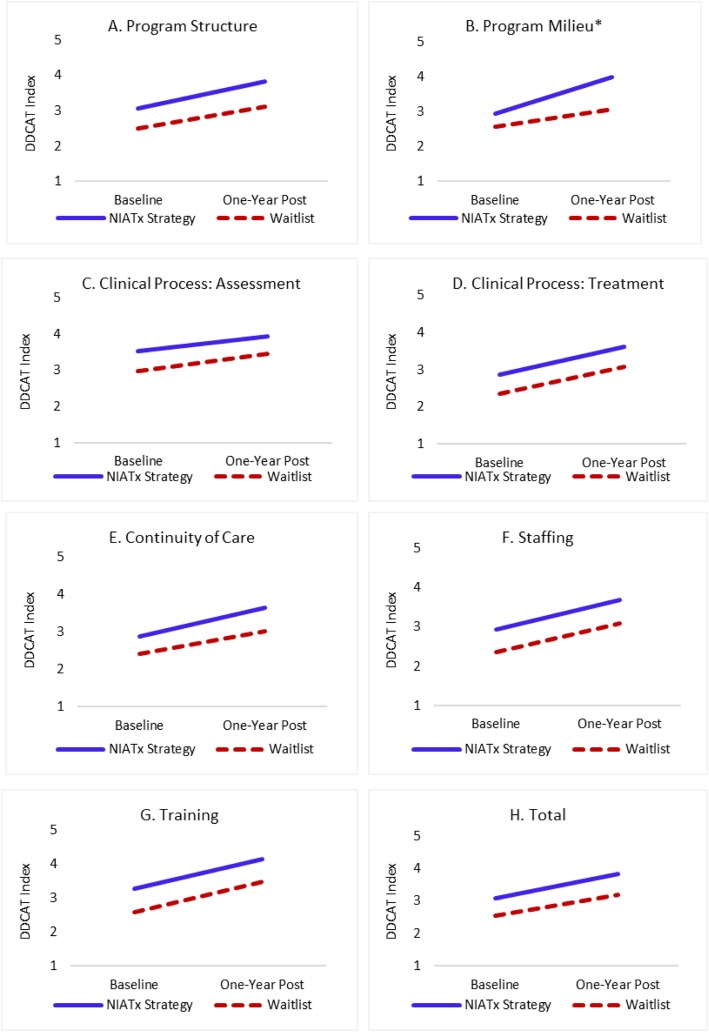
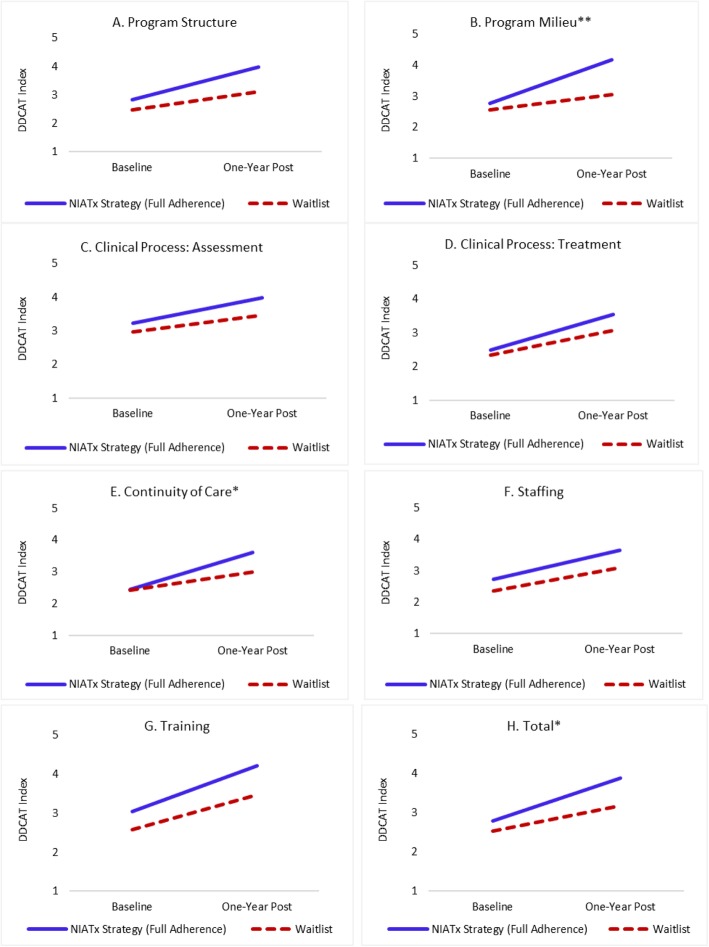
Results: From baseline to one-year post active implementation, both the NIATx strategy and waitlist arms demonstrated improvements over time in DDCAT Index total and DDCAT dimension scores. In intent-to-treat analyses, a moderate but statistically significant difference in improvement between study arms was seen only in the Program Milieu dimension (p = 0.020, Cohen's d = 0.54). In per-protocol analyses, moderate-to-large effects in Program Milieu (p = 0.002, Cohen's d = 0.91) and Continuity of Care (p = 0.026, Cohen's d = 0.63) dimensions, and in total DDCAT Index (p = 0.046, Cohen's d = 0.51) were found.
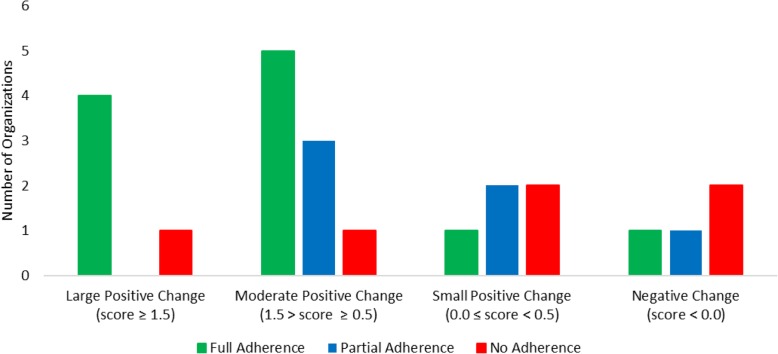
Conclusions: Overall, organizations in both study arms improved DDCAT Index scores over time. Organizations in the NIATx strategy arm with full adherence to the NIATx protocol had significantly greater improvements in the primary outcome measure of integrated service capacity for persons with co-occurring disorders.
Trail registration: ClinicalTrials.gov, NCT03007940 . Retrospectively registered January 2017.
Keywords: Co-occurring disorders; Implementation research; Integrated treatment.
Conflict of interest statement
The authors declare that they have no competing interests.
Figures
References
-
- SAMHSA . Results from the 2016 National Survey on Drug Use and Health. Rockville, MD: Center for Behavioral Health Statistics and Quality, Substance Abuse and Mental Health Services Administration: HHS Publication No. SMA 17–5044, NSDUH Series H-52; 2017. Key substance use and mental health indicators in the United States.
-
- Grant BF, Stinson FS, Dawson DA, Chou SP, Dufour MC, Compton WM, et al. Prevalence and co-occurrence of substance use disorders and independent mood and anxiety disorders: results from the National Epidemiologic Survey on alcohol and related conditions. Arch Gen Psychiatry. 2004;61(8):807–816. doi: 10.1001/archpsyc.61.8.807. - DOI - PubMed
Publication types
MeSH terms
Associated data
Grants and funding
LinkOut - more resources
Full Text Sources
Medical
Miscellaneous
