. 2020 May;45(6):947-955.
doi: 10.1038/s41386-019-0556-8. Epub 2019 Oct 25.

Exploring lithium's transcriptional mechanisms of action in bipolar disorder: a multi-step study

Affiliations

Exploring lithium's transcriptional mechanisms of action in bipolar disorder: a multi-step study

Ibrahim A Akkouh et al. Neuropsychopharmacology. 2020 May.

Abstract

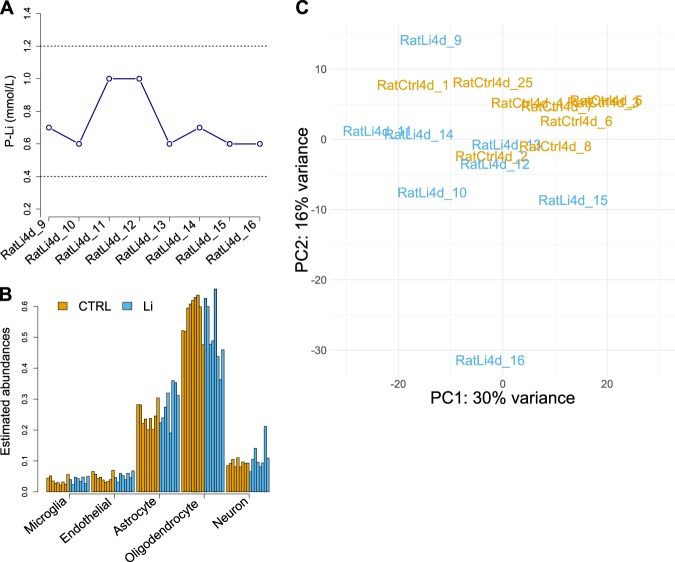
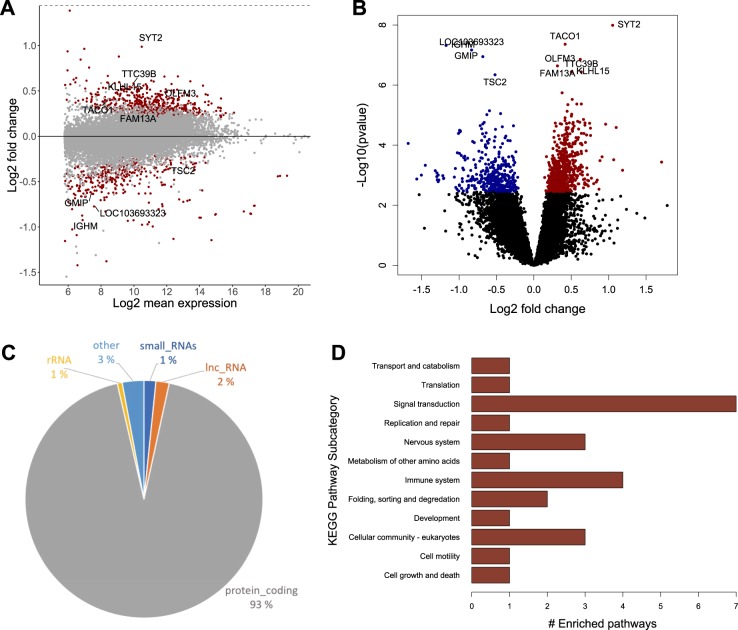
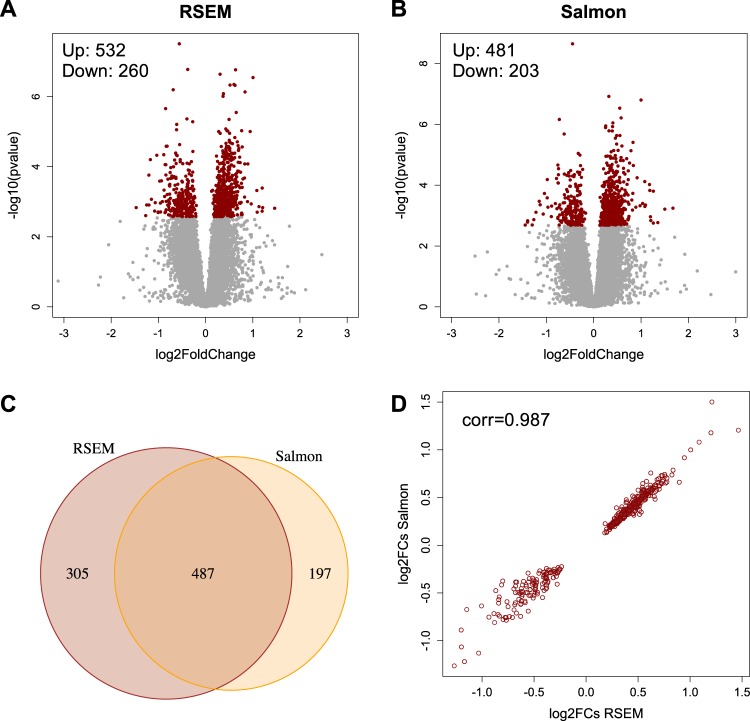
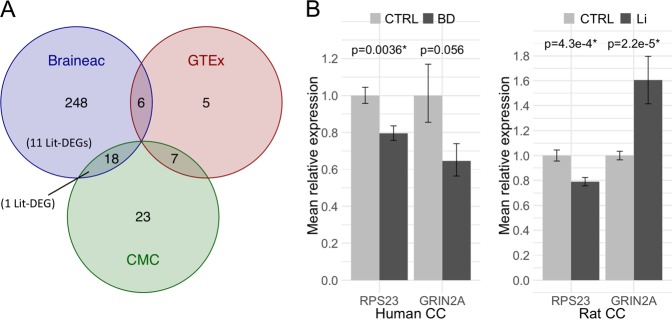
Lithium has been the first-line treatment for bipolar disorder (BD) for more than six decades. Although the molecular effects of lithium have been studied extensively and gene expression changes are generally believed to be involved, the specific mechanisms of action that mediate mood regulation are still not known. In this study, a multi-step approach was used to explore the transcriptional changes that may underlie lithium's therapeutic efficacy. First, we identified genes that are associated both with lithium exposure and with BD, and second, we performed differential expression analysis of these genes in brain tissue samples from BD patients (n = 42) and healthy controls (n = 42). To identify genes that are regulated by lithium exposure, we used high-sensitivity RNA-sequencing of corpus callosum (CC) tissue samples from lithium-treated (n = 8) and non-treated (n = 9) rats. We found that lithium exposure significantly affected 1108 genes (FDR < 0.05), 702 up-regulated and 406 down-regulated. These genes were mostly enriched for molecular functions related to signal transduction, including well-established lithium-related pathways such as mTOR and Wnt signaling. To identify genes with differential expression in BD, we performed expression quantitative trait loci (eQTL) analysis on BD-associated genetic variants from the most recent genome-wide association study (GWAS) using three different gene expression databases. We found 307 unique eQTL genes regulated by BD-associated variants, of which 12 were also significantly modulated by lithium treatment in rats. Two of these showed differential expression in the CC of BD cases: RPS23 was significantly down-regulated (p = 0.0036, fc = 0.80), while GRIN2A showed suggestive evidence of down-regulation in BD (p = 0.056, fc = 0.65). Crucially, GRIN2A was also significantly up-regulated by lithium in the rat brains (p = 2.2e-5, fc = 1.6), which suggests that modulation of GRIN2A expression may be a part of the therapeutic effect of the drug. These results indicate that the recent upsurge in research on this central component of the glutamatergic system, as a target of novel therapeutic agents for affective disorders, is warranted and should be intensified.


Figures

Fig. 1
Fig. 1
Initial assessments of lithium treatment and sequencing results. a All lithium-treated rats had plasma concentrations of lithium chloride between 0.6–1.0 mmol/L, which is well within therapeutically relevant concentrations in humans as indicated by the two dotted lines. b Bar graphs showing the estimated cell type abundances (in percentage) for five relevant cell types as determined by cell type deconvolution analysis. Each bar represents a single rat sample. c PCA plot showing good separation on condition over the first two principal components, explaining 46% of the variation in total. The plot also revealed an outlier sample, which was excluded from the analysis. The PCA analysis was based on expression data from all the ~15000 genes that survived the pre-filtering steps
Fig. 2
Fig. 2
Differential gene expression (DGE) analysis of CC samples from lithium-treated and untreated rats. a MA-plot showing the relationship between mean expression values and fold changes for all analyzed genes. Each dot represents a gene. Significantly associated genes (FDR < 0.05) are colored in red, and the 10 most significant genes (lowest FDR value) are labeled. As the plot shows, the effect size variance is dependent on the mean expression value. Genes with lower average expression tend to have bigger fold changes between conditions, indicating the increased uncertainty in effect size estimates of low-abundance genes and the need for pre-filtering. b Volcano plot showing the fold change and p-value for each gene. Genes with significant up-regulation (FDR < 0.05) in lithium-treated rats are colored in red, and genes with significant down-regulation are colored in blue. The 10 genes with the lowest p-values are labeled. c Biotypes of lithium-associated DGE genes. The majority of genes were protein coding. Small RNAs include miRNAs and snoRNAs. “Other” include pseudogenes and processed pseudogenes. lncRNA: Long non-coding RNA. d Grouping of significantly enriched DGE pathways according to the KEGG subcategory arrangement. Most of the enriched pathways were involved in signal transduction processes (n = 7) and immune system functions (n = 4). KEGG: The Kyoto Encyclopedia of Genes and Genomes
Fig. 3
Fig. 3
Differential transcript expression (DTE) analysis of CC samples from lithium-treated and untreated rats. The volcano plots depict the fold changes and p-values for all analyzed transcripts based on expression quantification with a RSEM and b Salmon. Significant differentially expressed transcripts (FDR < 0.05) are colored in red. c Venn diagram of significant DE transcripts as determined with RSEM and Salmon quantification, respectively. The intersection represents the number of transcripts (n = 487) that were identified as DE with both tools. d The 487 DE transcripts commonly identified with RSEM and Salmon quantification had highly correlated fold changes (r = 0.987) in terms of both the magnitude and direction of effect. RSEM: RNA-seq by expectation maximization
Fig. 4
Fig. 4
Expression of lithium-associated eQTL genes in human brain samples. a Venn diagram showing the number of BD-associated eQTL genes identified using each of the three gene expression databases Braineac, GTEx, and CMC. Intersections show the number of eQTL genes shared between databases. No single eQTL gene was identified by all three databases. 11 of the 12 genes that were both lithium-associated DE genes (Lit-DEG) and BD-associated eQTL genes were identified only by Braineac, while one gene was identified by both Braineac and CMC. b Bar plots depicting the expression levels of RPS23 and GRIN2A in human CC samples (left) and rat CC samples (right). The error bars show the standard errors for the mean relative expressions. eQTL: expression quantitative trait locus, Braineac: the brain eQTL Almanac, GTEx: genotype-tissue expression, CMC: The CommonMind Consortium, Lit: lithium, DEG: differentially expressed gene, CTRL: healthy human control subjects, BD: bipolar disorder, CC: Corpus callosum

References

    1. Won E, Kim YK. An Oldie but Goodie: Lithium in the Treatment of Bipolar Disorder through Neuroprotective and Neurotrophic Mechanisms. Int J Mol Sci. 2017;18. - PMC - PubMed
    1. Rybakowski JK. Lithium in neuropsychiatry: a 2010 update. World J Biol Psychiatry. 2011;12:340–8. - PubMed
    1. Cruceanu C, Alda M, Turecki G. Lithium: a key to the genetics of bipolar disorder. Genome Med. 2009;1:79. - PMC - PubMed
    1. Malhi GS, Tanious M, Das P, Coulston CM, Berk M. Potential mechanisms of action of lithium in bipolar disorder. Current understanding. CNS Drugs. 2013;27:135–53. - PubMed
    1. Manji HK, Moore GJ, Chen G. Bipolar disorder: leads from the molecular and cellular mechanisms of action of mood stabilisers. Br J Psychiatry. 2001;178(Suppl 41):S107–19. doi: 10.1038/s41386-019-0556-8. - DOI - PubMed

Publication types