. 2019 Oct 22;11(10):1612.
doi: 10.3390/cancers11101612.

Identification of a Synergistic Multi-Drug Combination Active in Cancer Cells via the Prevention of Spindle Pole Clustering

Affiliations

Identification of a Synergistic Multi-Drug Combination Active in Cancer Cells via the Prevention of Spindle Pole Clustering

Andrea Weiss et al. Cancers (Basel). .

Abstract

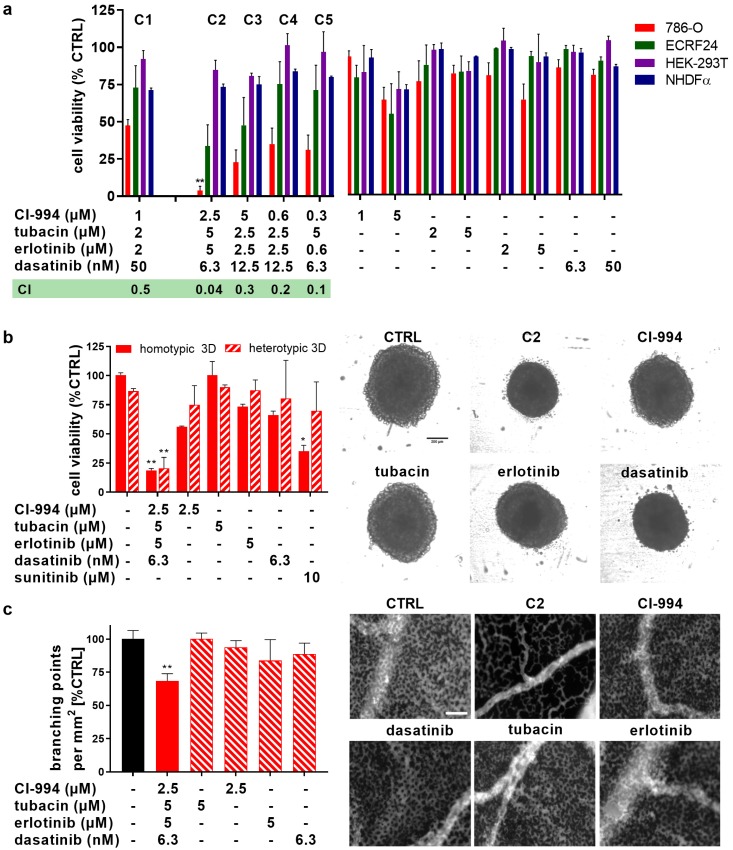
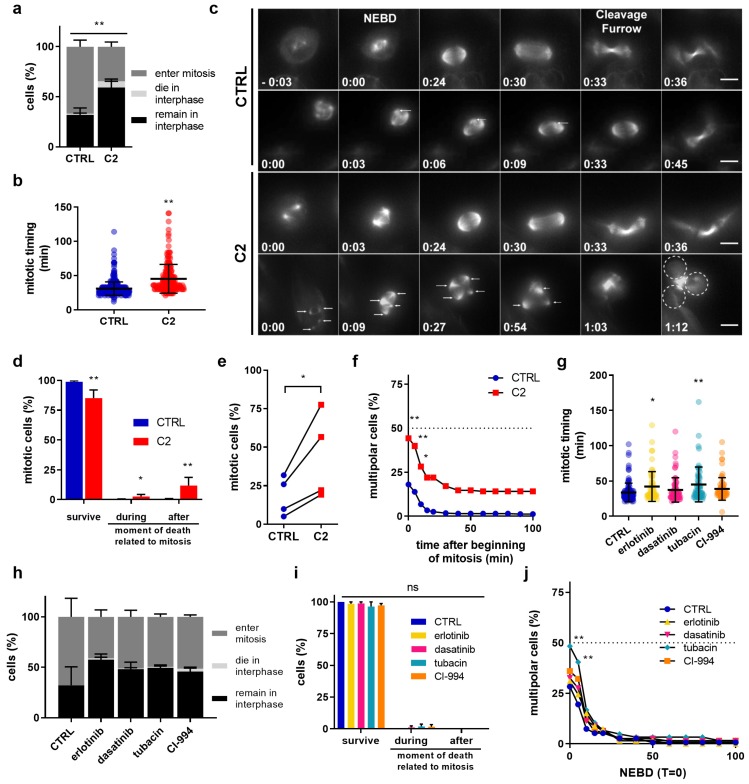
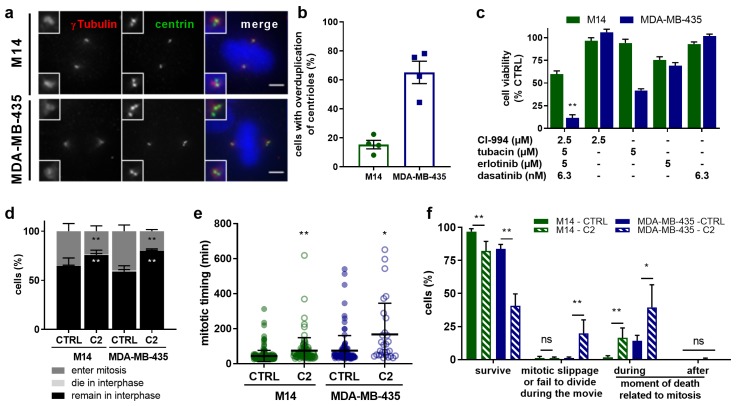
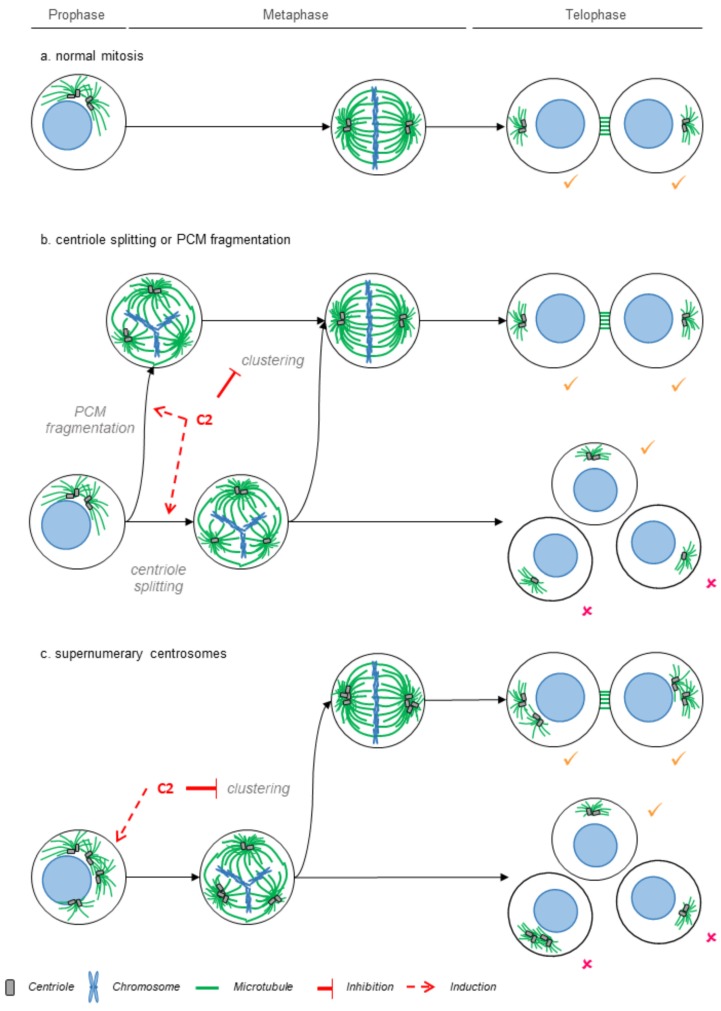
A major limitation of clinically used cancer drugs is the lack of specificity resulting in toxicity. To address this, we performed a phenotypically-driven screen to identify optimal multidrug combinations acting with high efficacy and selectivity in clear cell renal cell carcinoma (ccRCC). The search was performed using the Therapeutically Guided Multidrug Optimization (TGMO) method in ccRCC cells (786-O) and nonmalignant renal cells and identified a synergistic low-dose four-drug combination (C2) with high efficacy and negligible toxicity. We discovered that C2 inhibits multipolar spindle pole clustering, a survival mechanism employed by cancer cells with spindle abnormalities. This phenotype was also observed in 786-O cells resistant to sunitinib, the first line ccRCC treatment, as well as in melanoma cells with distinct percentages of supernumerary centrosomes. We conclude that C2-treatment shows a high efficacy in cells prone to form multipolar spindles. Our data suggest a highly effective and selective C2 treatment strategy for malignant and drug-resistant cancers.

Keywords: centrosome; drug combinations; drug synergy; multipolar spindle pole clustering.


Conflict of interest statement

The authors are the inventors on pending (PNS, PM, AW, MLRB, EP19199136) and issued (PNS, AW, WO2015136061A3) patents on methods of drug combination therapy.

Figures

Figure 1
Figure 1
Therapeutically Guided Multidrug Optimization (TGMO)-based optimization of the drug combination. (a) Schematic overview of the TGMO-based optimization platform. (I) An initial set of ten drugs was selected. (II) Dose-response curves for each of ten drugs were generated for each cell type using inhibition of cell metabolic activity (ATP levels) as a measure for cell viability. The drug combination matrix to be tested was selected via an orthogonal array composite design (OACD). (III) The TGMO-based screen was initiated by experimentally testing a matrix of 91 drug combinations according to the drug combination matrix. (IV) The difference in drug efficacy between nonmalignant HEK-293T cells and malignant 786-O cells (in red) are defined as the therapeutic window (in blue). Regression coefficients of both the efficacy in 786-O cells and the therapeutic window were modeled using a step-wise second-order linear regression model. Orange frames indicate compounds showing not optimal drug interactions (either high efficacy with low toxicity or low efficacy with no toxicity), while compounds exhibiting an optimal activity profile (both effective and nontoxic) are framed in green. The red frame indicates compounds with poor activity profiles (lack of efficacy and considerable toxicity). (V) Data analysis allowed for drug selection, refinement of the searches and final the selection of the ODC. Estimated regression coefficients resulting from Search 1 (b), Search 2 (seven-drug and four-drug, c and d), and Search 3 (e). Regression coefficients corresponding to models of efficacy in 786-O cells are represented in red and the therapeutic window models are presented in blue. Green boxes highlight the most relevant synergistic activity consistent throughout the sequential searches and resulted in the selection of the optimal combination. Significance is represented with * p < 0.05 and ** p < 0.01.
Figure 2
Figure 2
Dose optimization and validation of the OCD efficacy in 3D cell cultures with sunitinib-resistant cells and anti-angiogenic ODC potential in the chorioallantoic membrane model (CAM). (a) The efficacy of the five most promising drug combinations (C1–C5) derived from the dose optimization with C1, identifying C2 as the most effective drug combination. Corresponding single drug treatments are presented for the 786-O cell line, non-malignant renal HEK-293T control cells, as well as in nonmalignant NHDFα fibroblasts and activated ECRF24 endothelial cells. Green box: the “combination index” (CI) values for each drug combination with CI < 1 indicating synergy (highlighted in green), 0 and CI > 1 indicating antagonism. * p < 0.05 and ** p < 0.01 represent significant increased activity of C1 compared to C2–C5 and corresponding single drug treatments as determined by a one-way ANOVA with post hoc Sidak’s multiple comparison test from N = 2–4 independent experiments. (b) Efficacy and representative images of the dose-optimized drug combination C2 in 3D homotypic (786-O) spheroids or in 3D coculture heterotypic spheroids containing human fibroblasts, 786-O (1:1) and 10% ECRF24 endothelial cells. Sunitinib at 10 μM was used as a positive control. Scale bar represents 200 μm for all images. (c) In vivo inhibition developmental angiogenesis evaluated in the chorioallantoic membrane (CAM) model of the chicken embryo following two consecutive days of topical drugs administration. Fluorescence angiograms show the inhibition of capillary growth in CAM treated with C2 as presented by the quantification of the number of branching points/mm3 based on the automated image-analysis. ** p < 0.01 represents significance versus CTRL as determined by a one-way ANOVA with post hoc Sidak’s multiple comparison test from N = 2 independent experiments (n = 4–15). Error bars represent ± SEM. Scale bar represents 800 µm.
Figure 3
Figure 3
C2 prevents centrosome clustering in 786-O cells during metaphase. (a) Outcomes of 786-O cells treated with CTRL (0.1% DMSO) or C2 during 24 h movies. ** p < 0.0001 vs. CTRL in a Fisher’s exact test, N = 4 experiments with n = 606 (CTRL) and n = 603 (C2) cells (b) Mitotic timing is defined as the time between nuclear envelope breakdown (NEBD) and cleavage furrow formation. ** p < 0.001 vs. CTRL in a Mann–Whitney Test from N = 4 independent experiments with a total of n = 206–406 cells. (c) Time-lapse images of CTRL (0.1% DMSO) or C2-treated 786-O cells undergoing mitosis, stained with SiR-Tubulin. Mitotic timing in h:mins using nuclear envelope breakdown (NEBD) as T = 0. The arrows in the C2-treated multipolar cells indicate spindle poles, dashed circles the daughter cells after mitotic completion. Scale bar = 10 µm. (d) Mitotic outcomes of 786-O cells treated with CTRL (0.1% DMSO) or C2. ** p < 0.0001 and * p < 0.05 vs. CTRL in a Fisher’s exact test, N = 4 independent experiments with n = 406 (CTRL) and n = 206 (C2) cells. (e) Percentage of multipolar cells in individual experiments. * p < 0.05 vs. CTRL in paired two-tailed T-test from N = 4 independent experiments; n = 406 (CTRL) and 206 (C2) cells. (f) Percentage of multipolar cells over time. ** p < 0.005 and * p < 0.05 for the first three points compared to CTRL in a two-way ANOVA with Sidak’s multiple comparisons test from N = 4 independent experiments with n = 406 (CTRL) and n = 206 (C2) cells. (g) Mitotic timing of 786-O cells treated with the single drugs used for C2. Significances of ** p = 0.0008 and * p = 0.0236 vs. CTRL group in a two-way ANOVA with Tukey’s multiple comparisons test from N = 4 experiments with n = 62–123 cells. (h) Outcomes of 786-O cells treated with CTRL or monotherapies during 24 h movies. N = 4 experiments with n = 123–160 cells. (i) Mitotic outcome of 786-O cells treated with CTRL (0.1% DMSO) or monotherapies. None of the monotherapies was significantly different compared to CTRL group in a two-way ANOVA with Tukey’s multiple comparisons test from N = 4 experiments with n = 62–123 cells. (j) Percentage of multipolar cells over time. ** p < 0.01 for the first two points of tubacin treated cells vs. CTRL in a two-way ANOVA with Sidak’s multiple comparisons test from N = 4 experiments with n = 62–123 cells. Error bars represent SEM for all graphs.
Figure 4
Figure 4
C2 activity also prevents spindle pole clustering in sunitinib-resistant 786-O cells. (a) Efficacy of C2 and corresponding single drug treatments in 786-O cells chronically exposed to sunitinib treatment (786-OsunR). ** p < 0.0001 and * p < 0.05 represent significances versus all corresponding single drug treatments from N = 5 independent experiments as determined by a one-way ANOVA with post-hoc Tukey’s multiple comparison test. (b) Mitotic timing of 786-OsunR treated with CTRL (0.1% DMSO) or C2. p = 0.2262 compared to CTRL as determined by a Mann–Whitney Test from N = 3 experiments with n = 65–106 cells. (c) Percentage of multipolar cells over time. * p < 0.05 and ** p < 0.005 vs. CTRL group in a two-way ANOVA with Sidak’s multiple comparisons test from N = 3 experiments with n = 65-106 cells for CTRL and C2-treated cells. (d) Time-lapse images of CTRL and C2-treated 786-OsunR cells stained with SiR-Tubulin. Mitotic timing in h:mins using NEBD as T = 0. Arrows in the CTRL multipolar 786O-sunR cells indicate spindle poles. Scale bar = 10 µm (e) Mitotic outcome of 786-O-sunR cells. ** p < 0.0001 vs. CTRL in a Fisher’s exact test, N = 3 experiments with n = 106–65 cells for CTRL and C2-treated cells. (f) Outcomes of 786-OsunR cells treated with CTRL or C2 during the 24 h movie. ** p < 0.0001 vs. CTRL in Fisher’s exact test, N = 3 experiments with n = 221 and n = 259 cells (g) Percentage of fixed multipolar cells with extra centrosomes, disengaged centrioles or fragmented pericentriolar material (PCM) after 12 h of CTRL or C2 treatment. Within each cell line, C2-treated cells were compared to CTRL cells in Fisher’s exact test from N = 3 experiments with n = 112–164 cells. (h) Representative immunofluorescence images of 786-O and 786-OsunR cells, treated for 12 h with CTRL or C2, stained for α-tubulin (magenta), γ-tubulin (red), centrin (green), and DAPI (blue). Scale bar = 5 µm. White arrows indicate poles formed by PCM fragmentation. Error bars represent SEM in all graphs.
Figure 5
Figure 5
Effects of C2 treatment on melanoma cells with normal or elevated number of centrosomes. (a) Representative images of M14 and MDA-MB-435 cells stained for centrin (green), γ-tubulin (red), and DAPI (blue). Scale bar = 5 µm. (b) Image-based quantification of the number of centrioles per cells. Results from N = 4 experiments with n = 165 cells for M14 and 164 cells for MDA-MB-435 cells. (c) Efficacy of C2 and corresponding single drug treatments in M14 and MDA-MB-435 cells, ** p < 0.01 versus all corresponding single drug treatments in a one-way ANOVA with posthoc Tukey’s multiple comparison test. (d) Outcomes of M14 and MDA-MB-435 cells treated with CTRL (0.1% DMSO) or C2 during 24 h movies. ** p < 0.0001 vs. CTRL in a Fisher’s exact test, N = 3 experiments, n = 610–515 cells for M14, and n=355-297 cells for MDA-MB-435 cells. (e) Mitotic timing from NEBD until formation of a cleavage furrow in min. ** p < 0.0001 for M14 cells and * p = 0.0002 for MDA-MB-435 cells, (CTRL vs. C2) in a Mann–Whitney Test from N = 3 experiments with n = 227–122 cells for M14 and n = 140–60 cells for MDA-MB-435. (f) Mitotic outcome of M14 and MDA-MB-435 cells. ** p < 0.0001 and * p < 0.001 vs. CTRL in a Fisher’s exact test, N = 3 experiments with n = 227–122 cells for M14 and n = 140–60 cells for MDA-MB-435. (g) Time-lapse images of M14 and MDA-MB-435 cells undergoing mitosis, stained with SiR-Tubulin. Mitotic timing in h:mins using nuclear envelope breakdown (NEBD) as T = 0. Arrows indicate spindle poles in the C2-treated multipolar MDA-MB-435 cells. Scale bar = 10 µm. (h) Percentage of multipolar cells over time. * p < 0.05 and ** p < 0.01 vs. CTRL in a two-way ANOVA with Sidak’s multiple comparisons test from N = 3 experiments with n = 227–122 (CTRL) and n = 140–60 cells (C2) M14 and MDA-MB-435 cells. Error bars represent SEM in all graphs.
Figure 5
Figure 5
Effects of C2 treatment on melanoma cells with normal or elevated number of centrosomes. (a) Representative images of M14 and MDA-MB-435 cells stained for centrin (green), γ-tubulin (red), and DAPI (blue). Scale bar = 5 µm. (b) Image-based quantification of the number of centrioles per cells. Results from N = 4 experiments with n = 165 cells for M14 and 164 cells for MDA-MB-435 cells. (c) Efficacy of C2 and corresponding single drug treatments in M14 and MDA-MB-435 cells, ** p < 0.01 versus all corresponding single drug treatments in a one-way ANOVA with posthoc Tukey’s multiple comparison test. (d) Outcomes of M14 and MDA-MB-435 cells treated with CTRL (0.1% DMSO) or C2 during 24 h movies. ** p < 0.0001 vs. CTRL in a Fisher’s exact test, N = 3 experiments, n = 610–515 cells for M14, and n=355-297 cells for MDA-MB-435 cells. (e) Mitotic timing from NEBD until formation of a cleavage furrow in min. ** p < 0.0001 for M14 cells and * p = 0.0002 for MDA-MB-435 cells, (CTRL vs. C2) in a Mann–Whitney Test from N = 3 experiments with n = 227–122 cells for M14 and n = 140–60 cells for MDA-MB-435. (f) Mitotic outcome of M14 and MDA-MB-435 cells. ** p < 0.0001 and * p < 0.001 vs. CTRL in a Fisher’s exact test, N = 3 experiments with n = 227–122 cells for M14 and n = 140–60 cells for MDA-MB-435. (g) Time-lapse images of M14 and MDA-MB-435 cells undergoing mitosis, stained with SiR-Tubulin. Mitotic timing in h:mins using nuclear envelope breakdown (NEBD) as T = 0. Arrows indicate spindle poles in the C2-treated multipolar MDA-MB-435 cells. Scale bar = 10 µm. (h) Percentage of multipolar cells over time. * p < 0.05 and ** p < 0.01 vs. CTRL in a two-way ANOVA with Sidak’s multiple comparisons test from N = 3 experiments with n = 227–122 (CTRL) and n = 140–60 cells (C2) M14 and MDA-MB-435 cells. Error bars represent SEM in all graphs.
Figure 6
Figure 6
Model for the effects of the C2 combination on cell division. (a) Faithful chromosome segregation requires the formation of a bipolar spindle (green) that segregates the genetic material into two daughter cells (normal mitosis). Cancer cells are prone to form multipolar spindles due to fragmentation of the pericentriolar material or premature centriole splitting (b) or due to the presence of elevated centrosome numbers (c). Since multipolar spindles are often lethal, cancer cells rely on a spindle pole clustering mechanism to form pseudo-bipolar division for survival. Our results are consistent with the hypothesis that the C2 treatment prevents spindle pole clustering and potentially induces multipolar spindle formation, thus increasing the incidence of lethal multipolar cell divisions.

References

    1. Bozic I., Reiter J.G., Allen B., Antal T., Chatterjee K., Shah P., Moon Y.S., Yaqubie A., Kelly N., Le D.T., et al. Evolutionary Dynamics of Cancer in Response to Targeted Combination Therapy. Elife. 2013;2:747. doi: 10.7554/eLife.00747. - DOI - PMC - PubMed
    1. Lehar J., Krueger A.S., Avery W., Heilbut A.M., Johansen L.M., Price E.R., Rickles R.J., Short G.F., 3rd, Staunton J.E., Jin X., et al. Synergistic Drug Combinations Tend to Improve Therapeutically Relevant Selectivity. Nat. Biotechnol. 2009;27:659–666. doi: 10.1038/nbt.1549. - DOI - PMC - PubMed
    1. Keith C.T., Borisy A.A., Stockwell B.R. Multicomponent Therapeutics for Networked Systems. Nat. Rev. Drug Discov. 2005;4:71–78. doi: 10.1038/nrd1609. - DOI - PubMed
    1. Kitano H. A Robustness-Based Approach to Systems-Oriented Drug Design. Nat. Rev. Drug Discov. 2007;6:202–210. doi: 10.1038/nrd2195. - DOI - PubMed
    1. Lehár J., Krueger A., Zimmermann G., Borisy A. High-Order Combination Effects and Biological Robustness. Mol. Syst. Biol. 2008;4:215. doi: 10.1038/msb.2008.51. - DOI - PMC - PubMed

LinkOut - more resources