. 2020 Feb 25;118(4):967-979.
doi: 10.1016/j.bpj.2019.10.006. Epub 2019 Oct 10.

Simultaneous Release of Multiple Vesicles from Rods Involves Synaptic Ribbons and Syntaxin 3B

Affiliations

Simultaneous Release of Multiple Vesicles from Rods Involves Synaptic Ribbons and Syntaxin 3B

Cassandra L Hays et al. Biophys J. .

Abstract

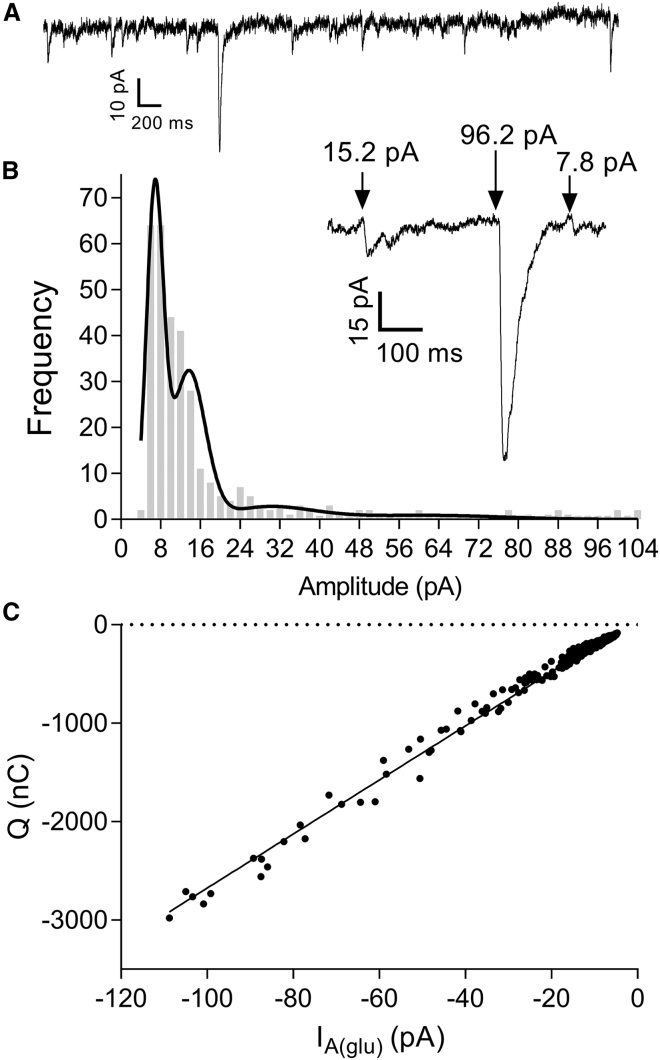
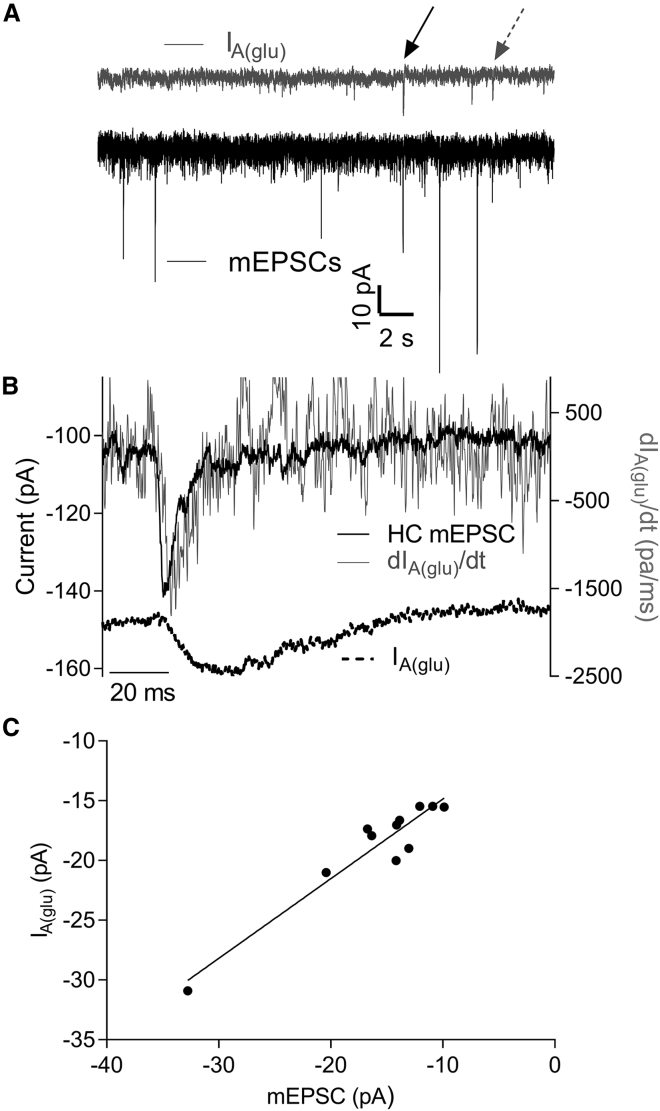
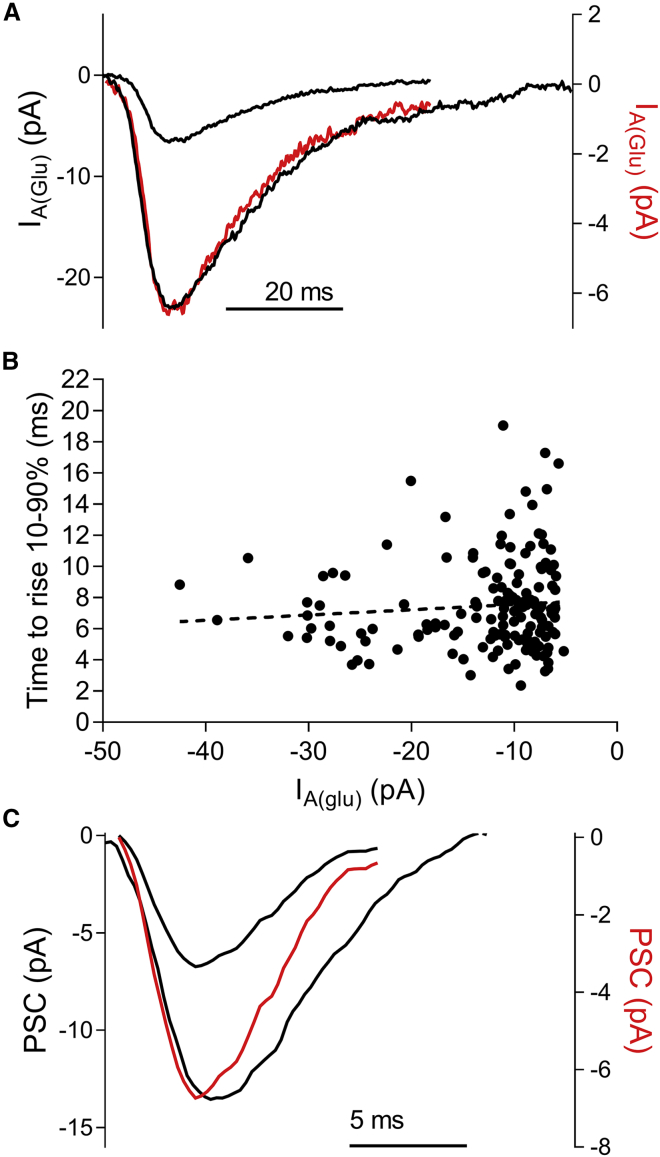
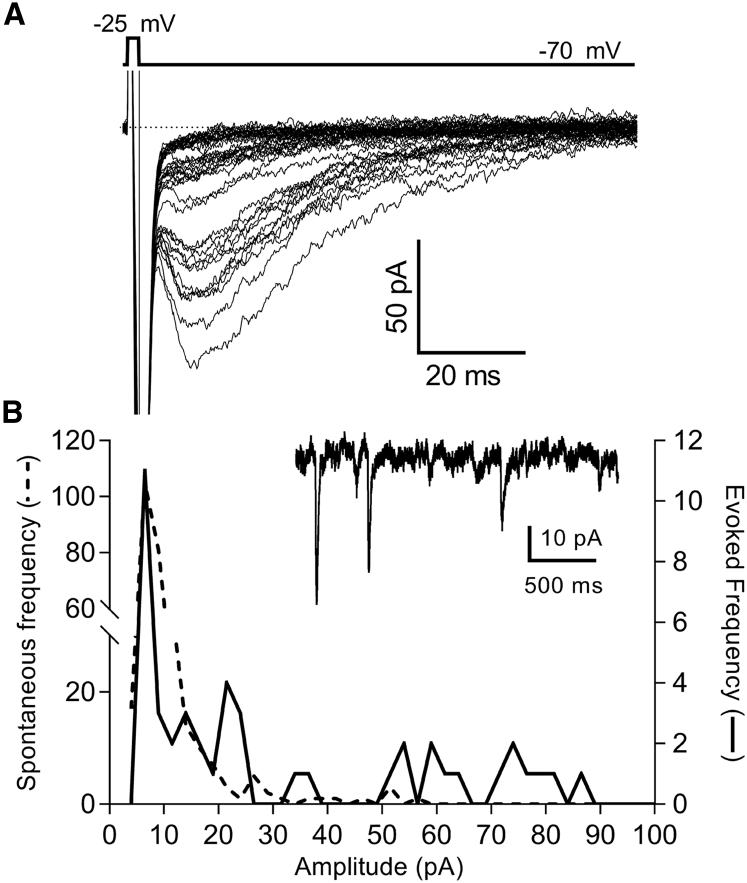
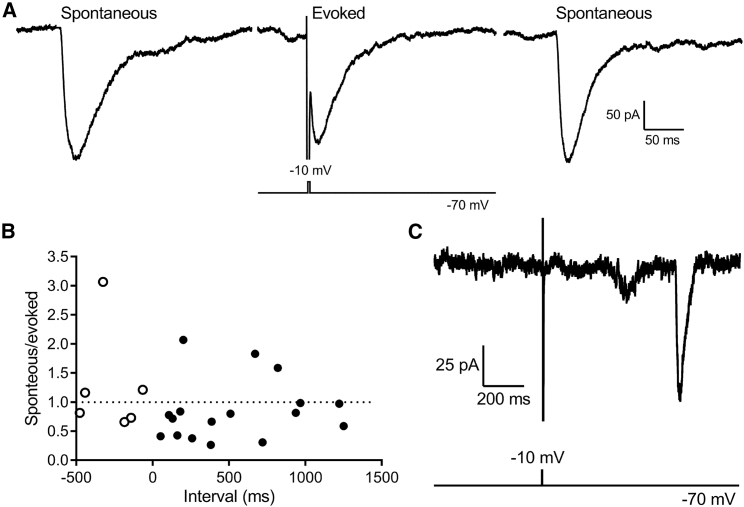
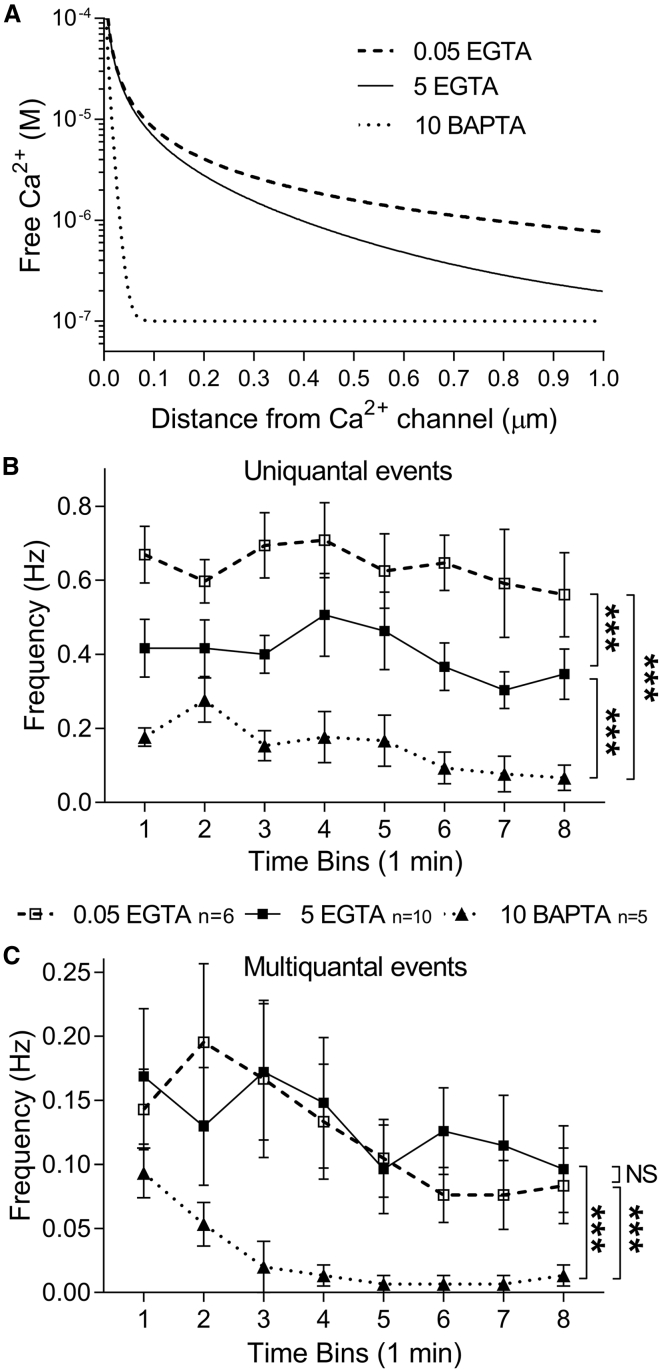
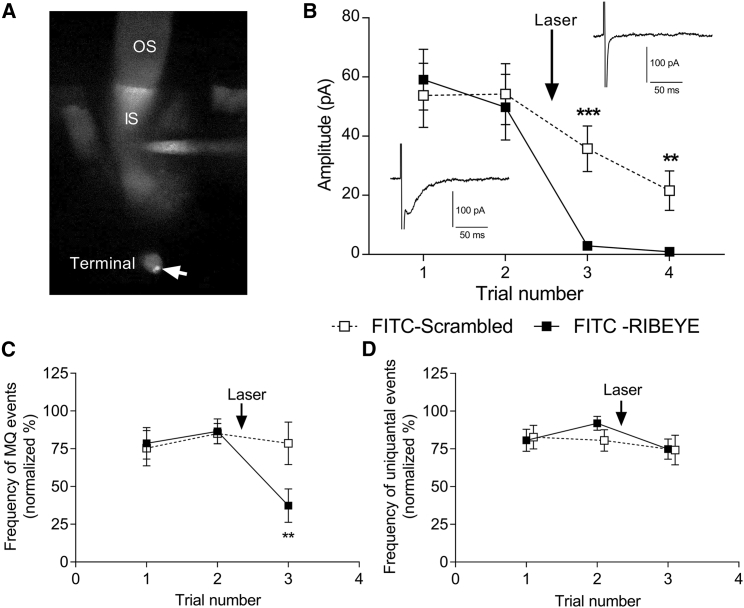
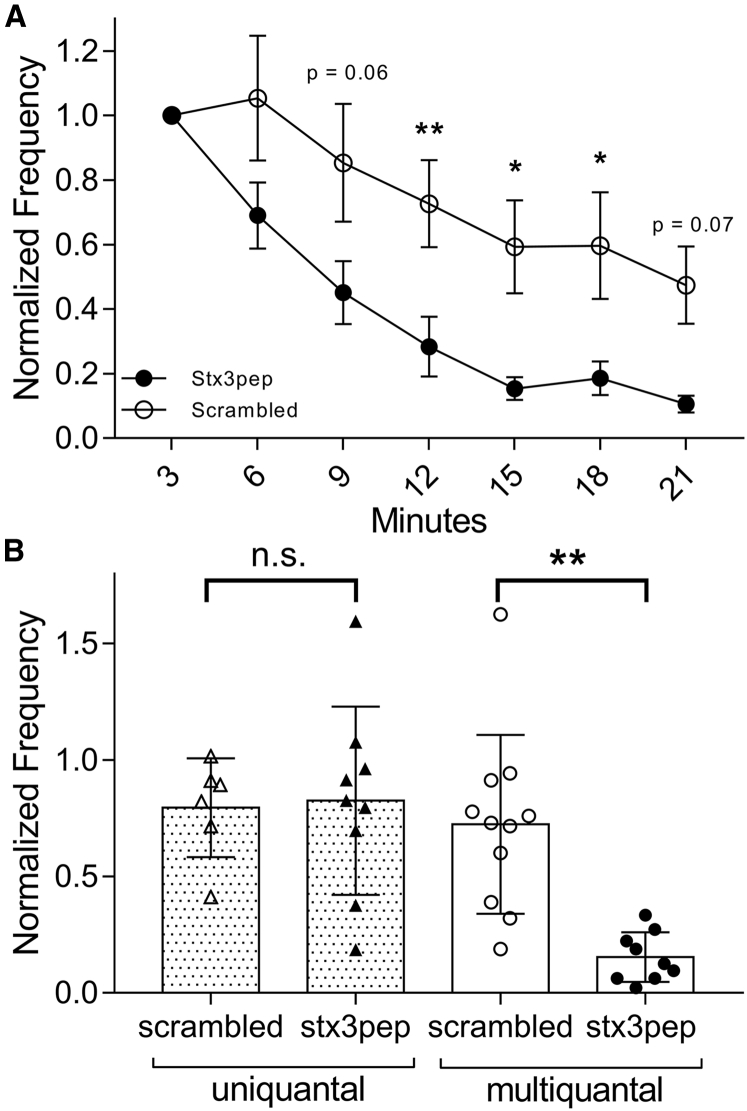
First proposed as a specialized mode of release at sensory neurons possessing ribbon synapses, multivesicular release has since been described throughout the central nervous system. Many aspects of multivesicular release remain poorly understood. We explored mechanisms underlying simultaneous multivesicular release at ribbon synapses in salamander retinal rod photoreceptors. We assessed spontaneous release presynaptically by recording glutamate transporter anion currents (IA(glu)) in rods. Spontaneous IA(glu) events were correlated in amplitude and kinetics with simultaneously measured miniature excitatory postsynaptic currents in horizontal cells. Both measures indicated that a significant fraction of events is multiquantal, with an analysis of IA(glu) revealing that multivesicular release constitutes ∼30% of spontaneous release events. IA(glu) charge transfer increased linearly with event amplitude showing that larger events involve greater glutamate release. The kinetics of large and small IA(glu) events were identical as were rise times of large and small miniature excitatory postsynaptic currents, indicating that the release of multiple vesicles during large events is highly synchronized. Effects of exogenous Ca2+ buffers suggested that multiquantal, but not uniquantal, release occurs preferentially near Ca2+ channels clustered beneath synaptic ribbons. Photoinactivation of ribbons reduced the frequency of spontaneous multiquantal events without affecting uniquantal release frequency, showing that spontaneous multiquantal release requires functional ribbons. Although both occur at ribbon-style active zones, the absence of cross-depletion indicates that evoked and spontaneous multiquantal release from ribbons involve different vesicle pools. Introducing an inhibitory peptide into rods to interfere with the SNARE protein, syntaxin 3B, selectively reduced multiquantal event frequency. These results support the hypothesis that simultaneous multiquantal release from rods arises from homotypic fusion among neighboring vesicles on ribbons and involves syntaxin 3B.


Figures

Figure 1
Figure 1
Amplitude characteristics of spontaneous IA(glu) events are consistent with multiquantal release. (A) Spontaneous multiquantal events were observed among many uniquantal events in rods voltage clamped at −70 mV. (B) Shown is a representative amplitude histogram of spontaneous rod IA(glu) events (n = 325) fit with a multiple Gaussian function. The inset shows a representative segment of the recording from which the histogram was derived. By assuming that the mean ± SD of the initial peak represents a single quantum, quantal content for this cell was calculated as a weighted average of the areas under the curve and found to be 1.69. (C) Amplitude of IA(glu) events (n = 339) was strongly correlated with event charge transfer (R = 0.99) with nonzero slope (F-test, p < 0.0001).
Figure 2
Figure 2
Simultaneous recordings of spontaneous IA(glu) events in a rod and miniature EPSCs (mEPSCs) in a horizontal cell. (A) During this record, two spontaneous presynaptic IA(glu) multiquantal events in rods (upper gray trace) occurred simultaneously (arrows) with postsynaptic mEPSCs (lower black trace). (B) Coincident mEPSC (upper black trace) and presynaptic IA(glu) (lower black trace) events (A, dashed gray arrow) are shown. The noise gray trace shows the first derivative of IA(glu). The close match between the derivative of IA(glu) and mEPSC time course indicates that the increase in IA(glu) integrates glutamate release from the rod. (C) The amplitudes of coincident pre- and postsynaptic events were linearly correlated (n = 11, R2 = 0.9) with a slope that was significantly nonzero (F-test, p < 0.001), demonstrating that IA(glu) provides a presynaptic measure of glutamate release.
Figure 3
Figure 3
Large and small spontaneous release events show similar kinetics. (A) Average uniquantal (small black trace; n = 97) and multiquantal IA(glu) events (large black trace; n = 20) from a single rod are shown. There were no kinetic differences between the two after scaling the average uniquantal event (red trace, right axis) to match the amplitude of the average multiquantal event. (B) Graph of individual IA(glu) event amplitudes plotted against 10–90% time to rise. The slope of the linear regression (dotted line) did not differ significantly from zero (F-test; p = 0.28). (C) Average uniquantal mEPSC (small black trace, n = 38) and multiquantal mEPSC (n = 16) from a single horizontal cell are shown. Scaling the uniquantal event (red trace, right axis) to match the amplitude of the larger event revealed that rise times of the two events were equivalent.
Figure 4
Figure 4
Comparisons of evoked and spontaneous IA(glu) events support the interpretation that the first peak in the amplitude histogram of spontaneous release events reflects the release of a single vesicle, and subsequent peaks reflect the release of multiple vesicles. (A) A series of 41 overlaid IA(glu) responses evoked by 2-ms steps to −25 mV in a rod are shown. Peak amplitudes of these evoked responses are plotted in the amplitude histogram in (B) (solid line). The amplitudes of spontaneous IA(glu) events from the same rod were also plotted in (B) (dashed line), revealing a similar fundamental uniquantal amplitude (n = 289 events). The inset in (B) shows an example of spontaneous events from this same cell.
Figure 5
Figure 5
Large spontaneous events involve a different vesicle pool than evoked release. (A) Shown are examples of spontaneous events that occurred before and after a smaller event evoked by a depolarizing step to −10 mV (2 ms). (B) Ratio of the amplitude of spontaneous multiquantal events relative to an evoked response in the same trial is shown. These ratios are plotted as a function of the timing of the spontaneous event before (open circles) or after (filled circles) the test stimulus (2 ms, −10 mV) applied at time 0. Spontaneous and multiquantal events were included in this analysis only if both exceeded 30 pA. Data were from 1-s (n = 5) and 2-s (n = 18) trials. (C) Shown is an example of a large spontaneous multiquantal event that occurred 650 ms after a depolarizing pulse (2 ms to 10 mV) failed to evoke release.
Figure 6
Figure 6
Effects of Ca2+ chelators on spontaneous release indicate that multiquantal release involves vesicles situated close to intracellular Ca2+ sources. (A) Shown is a graph of intracellular Ca2+ levels plotted as a function of distance from an open Ca2+ channel, predicted from the Excel-based macro “Pore” (64). (B) Shown are the frequencies of uniquantal events from rods plotted as a function of time after obtaining a whole cell recording from a rod with different Ca2+ buffers in the patch pipette solution. The frequency of uniquantal events was reduced significantly when buffering was raised from 0.05 (open squares, n = 7 rods) to 5 mM EGTA (filled squares, n = 10) and reduced further with 10 mM BAPTA (triangles, n = 5) as the chelator (p < 0.0001; one-way ANOVA/Tukey’s multiple comparisons). (C) Multiquantal event frequency did not differ between 0.05 and 5 mM EGTA but was reduced significantly by 10 mM BAPTA (p < 0.0001; one-way ANOVA/Tukey’s multiple comparisons). Data points show mean ± SEM.
Figure 7
Figure 7
Fluorophore-assisted laser inactivation (FALI) of ribbons with a FITC-conjugated RIBEYE-binding peptide indicates that multiquantal release occurs preferentially at ribbon release sites. (A) Confocal z-stack image of a rod after introducing the peptide through a patch pipette is shown. Weak fluorescence from cytoplasmic dye is visible in the outer segment (OS) and inner segment (IS). Two small bright spots in the terminal (arrow) show dye bound to ribbons before laser bleaching. (B) Damaging ribbons by FALI reduced evoked IA(glu) events evoked by a brief depolarizing stimulus (2 ms, −25 mV). The insets show examples of responses evoked in a rod before and after 60-s bleach with 488-nm laser light. (C) FALI with the RIBEYE-binding peptide significantly reduced the frequency of multiquantal events (n = 7 rods; p = 0.0127; two-way ANOVA/Tukey’s multiple comparisons), but FALI with a scrambled control peptide did not (n = 7, p = 0.91; two-way ANOVA/Tukey’s multiple comparisons). (D) FALI did not reduce the frequency of uniquantal events with either the RIBEYE-binding (p = 0.3; 2-way ANOVA/Tukey’s multiple comparisons) or scrambled control peptide (p = 0.84; 2-way ANOVA/Tukey’s multiple comparisons). Data points show mean ± SEM.
Figure 8
Figure 8
Inhibiting the SNARE protein syntaxin 3B by introducing an inhibitory peptide (stx3pep) into a rod through the patch pipette selectively reduced multiquantal but not uniquantal release. (A) Spontaneous multiquantal event frequency measured in 3-min bins after beginning the whole cell recording was reduced by stx3pep (n = 12) compared with a scrambled control peptide (n = 9, p = 0.002; two-way ANOVA). Data points show mean ± SEM. (B) Comparison of uniquantal and multiquantal event frequency measured 15 min after patch rupture is shown. The frequency of uniquantal events did not differ between stx3pep (filled triangles) and scrambled control peptide (open triangles), but the frequency of multiquantal events was reduced significantly by stx3pep (filled circles) relative to the scrambled control peptide (open circles, p < 0.003; one-way ANOVA, Tukey’s multiple comparisons). Bars show mean ± SD.

References

    1. Rudolph S., Tsai M.C., Wadiche J.I. The ubiquitous nature of multivesicular release. Trends Neurosci. 2015;38:428–438. - PMC - PubMed
    1. Li G.L., Keen E., von Gersdorff H. The unitary event underlying multiquantal EPSCs at a hair cell’s ribbon synapse. J. Neurosci. 2009;29:7558–7568. - PMC - PubMed
    1. Brandt A., Khimich D., Moser T. Few CaV1.3 channels regulate the exocytosis of a synaptic vesicle at the hair cell ribbon synapse. J. Neurosci. 2005;25:11577–11585. - PMC - PubMed
    1. Jarsky T., Tian M., Singer J.H. Nanodomain control of exocytosis is responsible for the signaling capability of a retinal ribbon synapse. J. Neurosci. 2010;30:11885–11895. - PMC - PubMed
    1. Bartoletti T.M., Jackman S.L., Thoreson W.B. Release from the cone ribbon synapse under bright light conditions can be controlled by the opening of only a few Ca(2+) channels. J. Neurophysiol. 2011;106:2922–2935. - PMC - PubMed

Publication types

Substances

LinkOut - more resources