. 2019 Dec;60(12):2057-2073.
doi: 10.1194/jlr.RA119000399. Epub 2019 Oct 25.

Insights into lipid accumulation in skeletal muscle in dysferlin-deficient mice

Affiliations

Insights into lipid accumulation in skeletal muscle in dysferlin-deficient mice

Anil K Agarwal et al. J Lipid Res. 2019 Dec.

Abstract

Loss of dysferlin (DYSF) protein in humans results in limb-girdle muscular dystrophy 2B, characterized by progressive loss of muscles in the distal limbs with impaired locomotion. The DYSF-null (Bla/J) mouse develops severe steatotic muscles upon aging. Here, we report a marked increase in adipocytes, especially in the psoas and gluteus muscles but not in the soleus and tibialis anterior muscles in aged Bla/J mice compared with WT mice. There was a robust upregulation in the mRNA expression of enzymes involved in lipogenesis and triacylglycerol (TAG) synthesis pathways in the steatotic skeletal muscles. Lipidomic analysis of the steatotic skeletal muscles revealed an increase in several molecular species of TAG, although it is unclear whether it was at the expense of phosphatidylcholine and phosphatidylserine. The adipocytes in steatotic muscles were extramyocellular, as determined by the increased expression of caveolin 1 (a cellular marker for adipocytes) and lipid-droplet protein, perilipin 1. This increase in adipocytes occured as a consequence of the loss of myocytes.

Keywords: Bla/J mice; adipose tissue; extra-myocellular adipocytes; limb-girdle muscular dystrophy; lipidomic.


Conflict of interest statement

The authors declare that they have no conflicts of interest with the contents of this article.

Figures

Fig. 1.
Fig. 1.
Increased lipid deposition in the skeletal muscles of aged Bla/J mice of both sexes compared to the wild-type (WT) mice. The detection of lipids in various skeletal muscles of ∼95-week-old Bla/J mice of both sexes. A, B: Images of perfused cryofixed muscle sections stained for ORO. Note that in the gluteus and psoas muscles of both sexes, excessive lipids coalesce into oil droplets due to the hydrophobic nature of neutral lipids. Note also that in female mice, skeletal muscles obtained from psoas, gastrocnemius/plantaris (Gastroc), quadriceps (Quad), and gluteus (Glut) have significant lipid accumulation (as ascertained by ORO staining), and in male gastrocnemius/plantaris, it is less prominent. Furthermore, soleus muscle from both sexes lacks any ORO staining, suggesting undetectable lipid. Shown also is the tibialis anterior (TA) muscle stained for lipid. While there is some indication of ORO staining in TA muscle from female mice, this is absent in TA muscle from male mice. Images were captured as described in the Methods using two different cameras. The § indicates images captured with a Jenoptik Gryphax NAOS camera and those unmarked were captured with an Optronics Microfire camera. Scale bar 40 μm. C, D: Biochemical measurement of triglycerides (TAG) expressed as micrograms per milligram of tissues. Individual values are shown in either open or filled circles and the bar represents the mean (n = 3–6). P values are shown above the bars.
Fig. 2.
Fig. 2.
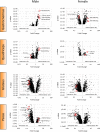
Volcano plots of total lipids detected by MS in the aged skeletal muscles of WT and Bla/J muscles. Total lipids of all lipid classes identified (known and unknown) are plotted as a volcano plot of the fold change between WT and Bla/J versus significance P < 0.05. Each dot represents an individual lipid species. In the plots, we have identified some of the lipid species that are unique to the specific muscle type (for other lipid species, see supplemental Tables S1, S2). Those species are circled in red and identified on the graph. The total number of lipid species plotted, along with the number of unknown species, is mentioned on each graph. There are n = 9–11 samples per muscle for males and n = 7 for females. Lipids are normalized to 0.2 mg tissue weight (wet). The raw lipidomics data sets will be made available upon request.
Fig. 3.
Fig. 3.
Increased molecular fingerprints of adipocytes in the affected skeletal muscles of Bla/J mice of both sexes. A: mRNA expression for the key adipocyte differentiation markers. Shown are the mean ± SD from two independent experiments measured in duplicate. Values shown in red are 2-fold or more up- or downregulated in the BLa/J mice compared with WT. *WT value was above 30 Ct, Bla/J value was not. B: Immunoblots for PLIN1 protein. Equal quantities (30 μg) of total tissue lysates of various skeletal muscles were probed with PLIN1 antibody. The expected PLIN1 protein is marked in the red box. Included also is tissue from brown adipose tissue (BAT) as a positive control. The same blot was stripped and probed with EEF2, a housekeeping gene, and the blots were then stained with Ponceau S for detection of total protein transfer. White dashed lines are drawn to orient the gel lanes. Wider white space indicates different gels. Immunoblots for CAV1 protein. Equal quantities (30 μg) of total tissue lysates of various skeletal muscles were probed with CAV1 antibody. Expected CAV1 protein is marked by a solid arrowhead. The same blot was stripped and probed with EEF2 and GAPDH housekeeping genes and the blots were then stained with Ponceau S for detection of total protein transfer. White dashed lines are drawn to orient the gel lanes. Wider white space indicates different gels. We performed two housekeeping genes, one (EEF2) more constantly expressed in muscle tissue and the other (GAPDH) a more general protein from the metabolic pathway. Because of extreme fatty tissue in the psoas and gluteus, the detection of proteins was not consistent. For this reason, we further stained the protein blots with Ponceau S to detect the total protein transfer. A significant increase of CAV1 is observed. However, because of inconsistent housekeeping protein detection, we are not showing protein quantitation. C: Immunoblots for PTRF protein. Equal quantities (30 μg) of total tissue lysates of various skeletal muscles were probed with PTRF antibody. Expected PTRF protein is marked by solid arrowhead. The same blot was stripped and probed with EEF2, a housekeeping gene, and the blots were then stained with Ponceau S for detection of total protein transfer. Because of extreme fatty tissue in psoas and gluteus, the detection of proteins was not consistent. For this reason, we further stained the protein blots with Ponceau S, detecting the total protein transfer. A significant increase of PTRF is observed. However, because of inconsistent housekeeping protein detection, we are not showing protein quantitation. White dashed lines are drawn to orient the gel lanes. Wider white space indicates different gels.
Fig. 4.
Fig. 4.
Decreased molecular fingerprints of muscle in the affected skeletal muscles of Bla/J mice of both sexes. A: mRNA expression for the key differentiation markers. Shown are the mean ± SD from two independent experiments measured in duplicate. Values shown in red are 2-fold or more up- or downregulated in the BLa/J mice compared with WT. Our cut-off value for meaningful gene expression is 30 Ct and above. The Ct values above 30 in both WT and Bla/J muscle samples were not used for calculating fold-change. B: Immunoblots for CAV3 protein. Equal quantities (30 μg) of total tissue lysates of various skeletal muscles were probed with Cav3 antibody. Expected CAV3 protein is marked by a solid arrowhead. The same blot was stripped and probed with EEF2 and GAPDH housekeeping genes, and the blots were then stained with Ponceau S for detection of total protein transfer. The detection of proteins was not consistent in the extremely fatty psoas and gluteus tissues. For this reason, we further stained the protein blots with Ponceau S to detect the total protein transfer. CAV3 is undetectable in psoas and gluteus muscles of both the sexes, marked with a red box. However, because of inconsistent housekeeping protein detection, we are not showing protein quantitation. White dashed lines are drawn to orient the gel lanes. Wider white space indicates different gels.
Fig. 5.
Fig. 5.
Images of select skeletal muscles of Bla/J mice showing extramyocellular presence of adipocytes in light microscopy. H&E-stained sections for various skeletal muscles determining the presence of adipocytes as extramyocellular in aged (95–99 weeks old) mice: Paraffin embedded sections were stained with H&E. Shown are representative images from each skeletal type from WT and Bla/J mice of both sexes. All images were captured using the same camera/software, except as noted. Shown are the 40× images, scale bars are shown. Histological evaluation of paraffin embedded skeletal muscle stained with H&E from aged (95–99 weeks old) Bla/J mice shows the presence of intermuscular adipocytes in muscles from both sexes. As presented in this figure, the psoas, gastrocnemius/plantaris, quadriceps, and gluteus muscles show an extensive presence of intermuscular adipocytes defined by their cellular membranes. Such a prominent presence of adipocytes is absent from the heart and soleus muscle. Male TA muscle shows a few adipocytes in this image, although most of the muscle tissue examined does not. Images were captured as described in the Methods using two different cameras. Images with a § sign were taken with a Jenoptik Gryphax NAOS camera. All other images were taken with an Optronics Microfire camera. Scale bar 40 μm.
Fig. 6.
Fig. 6.
Images of select skeletal muscles of Bla/J mice showing extramyocellular presence of adipocytes in TEM. Representative TEM images of psoas and gluteus muscles from aged (95–99 weeks old) Bla/J mice of both sexes showing the presence of intermuscular adipocytes in these muscles. Images in panels A, C, E, G, H, K, M, and O are thick sections (350 nm) stained with toluidine blue. Images in panels E, G, M, and O show the presence of adipocytes outside the myocytes in both psoas and gluteus muscles in Bla/J mice, marked with black arrows. Panels B, D, F, H, J, L, N, and P represent images obtained from thin (80 nm) sections. In these images, adipocytes are not observed. This clearly suggests that adipocytes are outside the myocytes/muscle fibers. Scale bars are shown within each thin section panel.
Fig. 7.
Fig. 7.
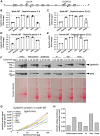
Expression and quantitation of DYSF transcripts and protein in various distal skeletal muscles in mice. A: Schematic for partial Dysf gene showing the exons (boxed) and the location of primer pairs. B, C: Fold change in the expression of Dysf mRNA normalized to Eef2 and expressed compared with quadriceps as 1, amplified with primer pairs 3-4 and 20-21, respectively, in male mice. Bars represent the mean of two independent amplifications of pooled muscle samples (n = 6). D, E: Fold change in the expression of Dysf mRNA normalized to Eef2 and expressed compared with quadriceps as 1, amplified with primer pairs 3-4 and 20-21, respectively, in female mice. Bars represent the mean of two independent amplification of pooled muscle samples (n = 6). F: Immunoblots for DYSF protein. Several concentrations of total tissue lysates were resolved on 4–20% gradient gels and probed with DYSF antibody. Note that an additional slightly smaller protein band is also recognized by this antibody that could be a variously spliced Dysf transcript (see supplemental Fig. S7 for explanation). The immunoblot was stripped and reprobed with a housekeeping protein, EEF2, followed by staining the blot with Ponceau S for total protein. The DYSF protein was normalized to EEF2 and quantified and expressed compared with quadriceps as 1. H: Similar quantification for DYSF was carried out at individual protein concentration normalized to EEF2. Gastroc, gastrocnemius; Glut, gluteus; Quad, quadriceps; TA, tibialis anterior.

References

    1. Taghizadeh E., Rezaee M., Barreto G. E., and Sahebkar A.. 2019. Prevalence, pathological mechanisms, and genetic basis of limb-girdle muscular dystrophies: a review. J. Cell. Physiol. 234: 7874–7884. - PubMed
    1. Liu J., Aoki M., Illa I., Wu C., Fardeau M., Angelini C., Serrano C., Urtizberea J. A., Hentati F., Hamida M. B., et al. 1998. Dysferlin, a novel skeletal muscle gene, is mutated in Miyoshi myopathy and limb girdle muscular dystrophy. Nat. Genet. 20: 31–36. - PubMed
    1. Amato A. A., and Brown R. H. Jr.. 2011. Dysferlinopathies. Handb. Clin. Neurol. 101: 111–118. - PubMed
    1. Moore U., Jacobs M., James M. K., Mayhew A. G., Fernandez-Torron R., Feng J., Cnaan A., Eagle M., Bettinson K., Rufibach L. E., et al. ; Jain COS Consortium. Assessment of disease progression in dysferlinopathy: a 1-year cohort study. Neurology. Epub ahead of print. January 9, 2019; doi:10.1212/WNL.0000000000006858. - PMC - PubMed
    1. Grounds M. D., Terrill J. R., Radley-Crabb H. G., Robertson T., Papadimitriou J., Spuler S., and Shavlakadze T.. 2014. Lipid accumulation in dysferlin-deficient muscles. Am. J. Pathol. 184: 1668–1676. - PubMed

Publication types

LinkOut - more resources