. 2019 Nov 20;132(22):jcs233783.
doi: 10.1242/jcs.233783.

Condensin II protein dysfunction impacts mitochondrial respiration and mitochondrial oxidative stress responses

Affiliations

Condensin II protein dysfunction impacts mitochondrial respiration and mitochondrial oxidative stress responses

Emily Deutschman et al. J Cell Sci. .

Abstract

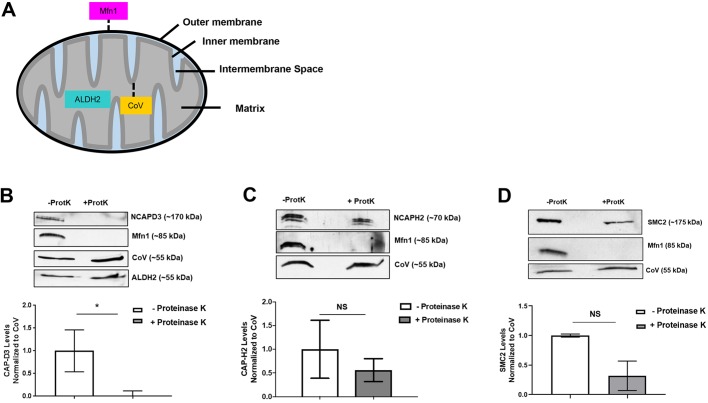
The maintenance of mitochondrial respiratory function and homeostasis is essential to human health. Here, we identify condensin II subunits as novel regulators of mitochondrial respiration and mitochondrial stress responses. Condensin II is present in the nucleus and cytoplasm. While the effects of condensin II depletion on nuclear genome organization are well studied, the effects on essential cytoplasmic and metabolic processes are not as well understood. Excitingly, we observe that condensin II chromosome-associated protein (CAP) subunits individually localize to different regions of mitochondria, suggesting possible mitochondrial-specific functions independent from those mediated by the canonical condensin II holocomplex. Changes in cellular ATP levels and mitochondrial respiration are observed in condensin II CAP subunit-deficient cells. Surprisingly, we find that loss of NCAPD3 also sensitizes cells to oxidative stress. Together, these studies identify new, and possibly independent, roles for condensin II CAP subunits in preventing mitochondrial damage and dysfunction. These findings reveal a new area of condensin protein research that could contribute to the identification of targets to treat diseases where aberrant function of condensin II proteins is implicated.

Keywords: Condensin; Mitochondria; Oxidative stress.


Conflict of interest statement

Competing interestsThe authors declare no competing or financial interests.

Figures

Fig. 1.
Fig. 1.
NCAPD3 localizes to mitochondria in human cells. (A) Immunofluorescence to detect NCAPD3 was performed in human HT-29 cells expressing NT shRNA (top row) or NCAPD3 shRNA (bottom row). DAPI is shown in blue; staining for complex V, labeling mitochondria, is shown in green, and that for NCAPD3 is shown in magenta. Yellow arrowheads point out a few examples of colocalization between NCAPD3 and complex V. (B) Equal amounts of mitochondrial and cytoplasmic lysates were isolated from equal numbers of NT and NCAPD3 shRNA-1-expressing HT-29 cells immunoblotted with antibodies targeting internal residues of NCAPD3 (Bioss, 670-715) and C-terminal residues (Bethyl, 1450-1498) of NCAPD3. Immunoblotting with antibodies against complex V and β-tubulin are shown to confirm the identity of mitochondrial and cytoplasmic fractions, respectively. NCAPD3 band intensities were normalized to the respective loading controls. NCAPD3 levels in isolated fractions from NCAPD3 shRNA-1-expressing cells were compared to levels in NT shRNA fractions, which were set to 100%. A representative of two independent experiments is shown. (C) Diagram of NCAPD3, showing protein regions detected by the respective antibodies. Blue boxes are representative of predicted HEAT repeats, the purple box represents a conserved condensin domain, and the asterisks denote experimentally identified phosphorylation sites (Abe et al., 2011; Beausoleil et al., 2004).
Fig. 2.
Fig. 2.
NCAPH2 and SMC2 localize to mitochondria in human cells, while NCAPG2 does not. (A) Equal amounts of mitochondrial and cytoplasmic lysates were isolated from equal numbers of NT and NCAPH2 shRNA-expressing cells. HT-29 cells were immunoblotted with antibodies targeting NCAPH2. Immunoblotting with antibodies against complex V and β-tubulin are shown to confirm the identity of mitochondrial and cytoplasmic fractions, respectively. NCAPH2 band intensities were normalized to the respective loading controls. NCAPH2 levels in isolated fractions from NCAPH2 shRNA-expressing cells were compared to levels in NT shRNA fractions, which were set to 100%. A representative of two independent experiments is shown. (B) Equal amounts of mitochondrial and cytoplasmic lysates were isolated from equal numbers of NT and NCAPG2 shRNA-expressing cells. HT-29 cells were immunoblotted with antibodies targeting NCAPG2. Immunoblotting with antibodies against complex V and β-tubulin are shown to confirm the identity of mitochondrial and cytoplasmic fractions, respectively. NCAPG2 band intensities were normalized to the respective loading controls. NCAPG2 levels in isolated fractions from NCAPG2 shRNA-expressing cells were compared to levels in NT shRNA fractions, which were set to 100%. A representative of two independent experiments is shown. (C) Equal amounts of mitochondrial and cytoplasmic lysates were isolated from equal numbers of NT and SMC2 shRNA-expressing HT-29 cells immunoblotted with antibodies targeting SMC2. Immunoblotting with antibodies against complex V and β-tubulin are shown to confirm the identity of mitochondrial and cytoplasmic fractions, respectively. SMC2 band intensities were normalized to the respective loading controls. SMC2 levels in isolated fractions from SMC2 shRNA-expressing cells were compared to levels in NT shRNA fractions, which were set to 100%. A representative of two independent experiments is shown.
Fig. 3.
Fig. 3.
NCAPD3 and NCAPH2 localize to different mitochondrial subcompartments. (A) Diagram of mitochondria and localization patterns of mitochondrial proteins. (B) Equal amounts of mitochondrial lysate with or without proteinase K treatment were immunoblotted for NCAPD3. Mfn1 served as an outer membrane control, CoV served as an inner membrane control, and ALDH2 served as a matrix control. NCAPD3 levels were quantified in the lysates and normalized to the level of CoV. n=3 independent experimental replicates. (C) Equal amounts of mitochondrial lysate with or without proteinase K treatment were immunoblotted for NCAPH2. Mfn1 served as an outer membrane control, CoV served as an inner membrane control. NCAPH2 levels were quantified in the lysates and normalized to the level of CoV. n=3 independent experimental replicates. (D) Equal amounts of mitochondrial lysate with or without proteinase K treatment were immunoblotted for SMC2. Mfn1 served as an outer membrane control and CoV served as an inner membrane control. SMC2 levels were quantified in the lysates and normalized to CoV. n=2 independent experimental replicates. *P≤0.05; NS, not significant (Student's t-test).
Fig. 4.
Fig. 4.
Loss of condensin II CAP protein expression results in aberrant mitochondrial respiratory function. Seahorse mitochondrial stress test assays were performed in (A) NT (n=21) and NCAPD3 (n=21, n=18) shRNA-expressing (three experimental replicates), (B) NT (n=20) and NCAPH2 (n=20) shRNA-expressing (two experimental replicates), and (C) control (n=30) and NCAPH2 (n=30) siRNA-transfected (three experimental replicates) cells. Cells were injected with drugs at the time points indicated: (A) 1 µM oligomycin; (B) 0.6 µM FCCP; (C) 1 µM antimycin A and rotenone. The first graph in each panel illustrates the full OCR profile, showing OCRs (y-axis) over time (x-axis). The second graph shows mitochondrial basal respiration rates. This value is calculated by subtracting non-mitochondrial respiration rates (OCR values post treatment with antimycin A and rotenone) from cellular respiration rates measured prior to addition of any mitochondrial inhibitory compounds. The final graph shows maximal (uncoupled) respiration rates. This value is measured after the addition of FCCP, a compound that uncouples oxygen consumption from ATP production. All values are normalized to DNA content by measuring the absorbance value at 485 nm relative to that at 535 nm using the Cyquant Cell Proliferation assay to account for possible differences in cell number. *P≤0.05. (Student's t-test). (D) Western blot analysis of NCAPH2 levels in control and NCAPH2 siRNA-transfected cells. β-tubulin served as a loading control.
Fig. 5.
Fig. 5.
NCAPD3-depleted cancer cells exhibit mitochondrial complex I-III dysfunction. High-resolution respirometry was performed to measure OCRs in intact non-permeabilized HT-29 cells in mitochondrial respiration buffer, using the Oroboros instrument. Cells were permeabilized with digitonin and ETC complex-specific substrates and inhibitors were added, sequentially, as described in the Materials and Methods (Kumar et al., 2019; Pesta and Gnaiger, 2012). Proton leak and oxidative phosphorylation (OXPHOS) in response to complex I–III substrates malate (M), pyruvate (P), ADP (D), glutamate (G) and complex II substrate, succinate (S) were measured. complex II activity was determined by subtracting the OCRs following addition of malate, pyruvate and glutamate from the OCRs following addition of malate, pyruvate and glutamate and succinate. Maximum respiration (Max R) as well as reserve respiratory (RR) capacity (response to the protonophore FCCP) were quantified. Rotenone-sensitive and -insensitive respiration, followed by complex IV function were also measured. Experiments were performed in HT-29 cells induced to express (A) NCAPD3 shRNA 1 (red bars) or (B) NCAPD3 shRNA 2 (gray bars) and results were compared to HT-29 cells expressing NT shRNA (blue bars). Four biological replicates were performed for each cell line. *P<0.05, **P<0.005; NS, not significant (paired t-tests).
Fig. 6.
Fig. 6.
Depletion of condensin II CAP proteins cause deficits in cellular ATP levels. Cellular ATP levels were measured in (A) NT and NCAPD3 (B) NT and NCAPH2 and (C) NT and NCAPG2 shRNA-expressing cells after mock treatment (PBS) or treatment with inhibitors of ATP production (sodium azide, 10 mM and 2-deoxy-D-glucose, 6 mM). Levels were normalized to protein content. For all experiments, n=6 biological replicates. Each experiment was repeated twice. (D) Flow cytometry was performed in NT shRNA (blue bars), NCAPD3 shRNA 1 (red bars), and NCAPH2 shRNA (green bars)-expressing cells to measure median MitoTracker Green intensity, as a proxy for mitochondrial mass. For NCAPD3, n=6 biological replicates, two experimental replicates. For NCAPH2, n=4 biological replicates, two experimental replicates. *P≤0.05; NS, not significant (Student's t-test).
Fig. 7.
Fig. 7.
NCAPD3 and NCAPH2 affect the expression of a few mitochondria-associated genes in a similar manner. (A) Venn diagram comparing the shared deregulated mitochondrial associated genes in NCAPD3 (red circle) and NCAPH2 (green circle)-depleted cells. (B) Table detailing the shared deregulated mitochondrial associated genes, fold change and gene function.
Fig. 8.
Fig. 8.
NCAPD3 depletion results in sensitivity to mitochondrial oxidative stress. (A,B) Flow cytometry analyses were performed to detect MitoSox Red in DMSO and menadione (50 μM)-treated NT and NCAPD3 shRNA-1-expressing cells. For NT and NCAPD3 shRNA-1-expressing DMSO-treated cells, n=4. For NT shRNA-expressing menadione-treated cells, n=4, and for NCAPD3 shRNA-1-expressing menadione-treated cells, n=3. For NT and NCAPD3 shRNA-2-expressing DMSO and menadione-treated cells, n=4. This experiment was repeated twice. (C) Flow cytometry analyses were performed to detect MitoSox Red in DMSO and menadione (50 μM)-treated NT and NCAPH2 siRNA-transfected cells. For control and NCAPH2 siRNA-transfected DMSO and menadione-treated cells, n=6. This experiment was repeated three times. *P≤0.05; NS, not significant (Student's t-test).

References

    1. Abe S., Nagasaka K., Hirayama Y., Kozuka-Hata H., Oyama M., Aoyagi Y., Obuse C. and Hirota T. (2011). The initial phase of chromosome condensation requires Cdk1-mediated phosphorylation of the CAP-D3 subunit of condensin II. Genes Dev. 25, 863-874. 10.1101/gad.2016411 - DOI - PMC - PubMed
    1. Bakhrebah M., Zhang T., Mann J. R., Kalitsis P. and Hudson D. F. (2015). Disruption of a conserved CAP-D3 threonine alters condensin loading on mitotic chromosomes leading to chromosome hypercondensation. J. Biol. Chem. 290, 6156-6167. 10.1074/jbc.M114.627109 - DOI - PMC - PubMed
    1. Bantug G. R., Fischer M., Grählert J., Balmer M. L., Unterstab G., Develioglu L., Steiner R., Zhang L., Costa A. S. H., Gubser P. M. et al. (2018). Mitochondria-endoplasmic reticulum contact sites function as immunometabolic hubs that orchestrate the rapid recall response of memory CD8+ T cells. Immunity 48, 542-555.e6. 10.1016/j.immuni.2018.02.012 - DOI - PMC - PubMed
    1. Bauer C. R., Hartl T. A. and Bosco G. (2012). Condensin II promotes the formation of chromosome territories by inducing axial compaction of polyploid interphase chromosomes. PLoS Genet. 8, e1002873 10.1371/journal.pgen.1002873 - DOI - PMC - PubMed
    1. Beausoleil S. A., Jedrychowski M., Schwartz D., Elias J. E., Villén J., Li J., Cohn M. A., Cantley L. C. and Gygi S. P. (2004). Large-scale characterization of HeLa cell nuclear phosphoproteins. Proc. Natl. Acad. Sci. USA 101, 12130-12135. 10.1073/pnas.0404720101 - DOI - PMC - PubMed

Publication types

MeSH terms