. 2019 Oct 25;10(1):4901.
doi: 10.1038/s41467-019-12919-7.

Feature integration within discrete time windows

Affiliations

Feature integration within discrete time windows

Leila Drissi-Daoudi et al. Nat Commun. .

Abstract

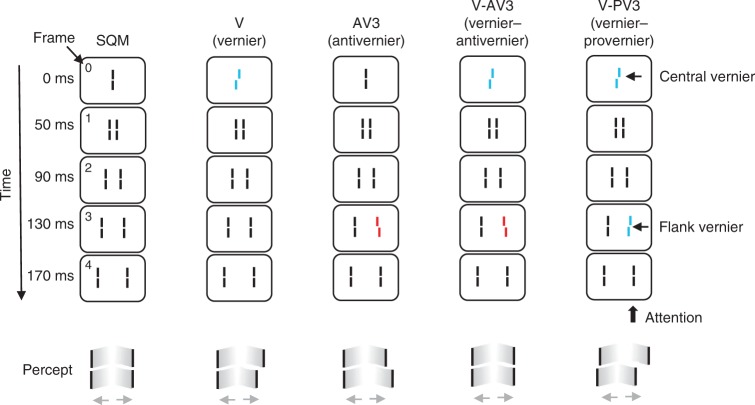
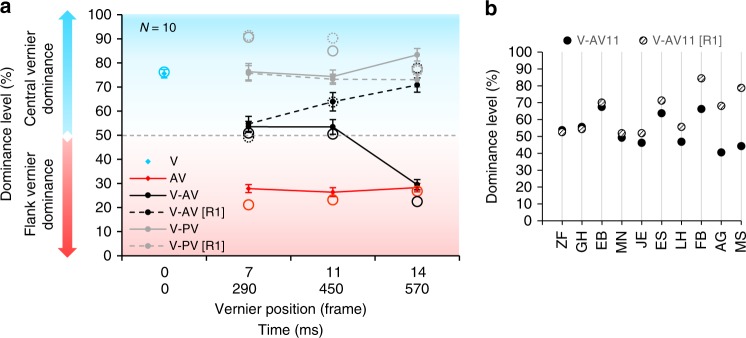
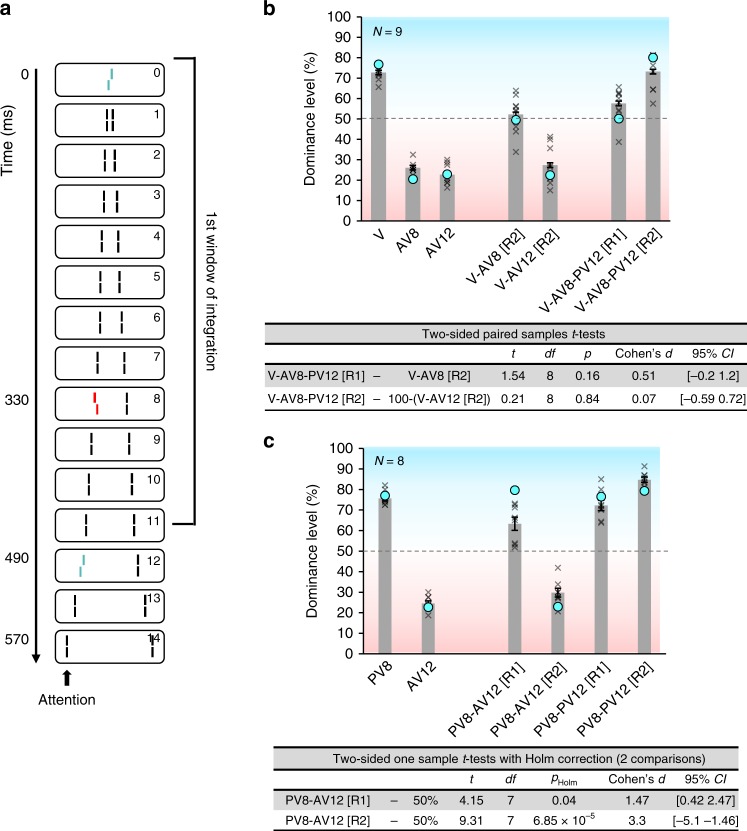
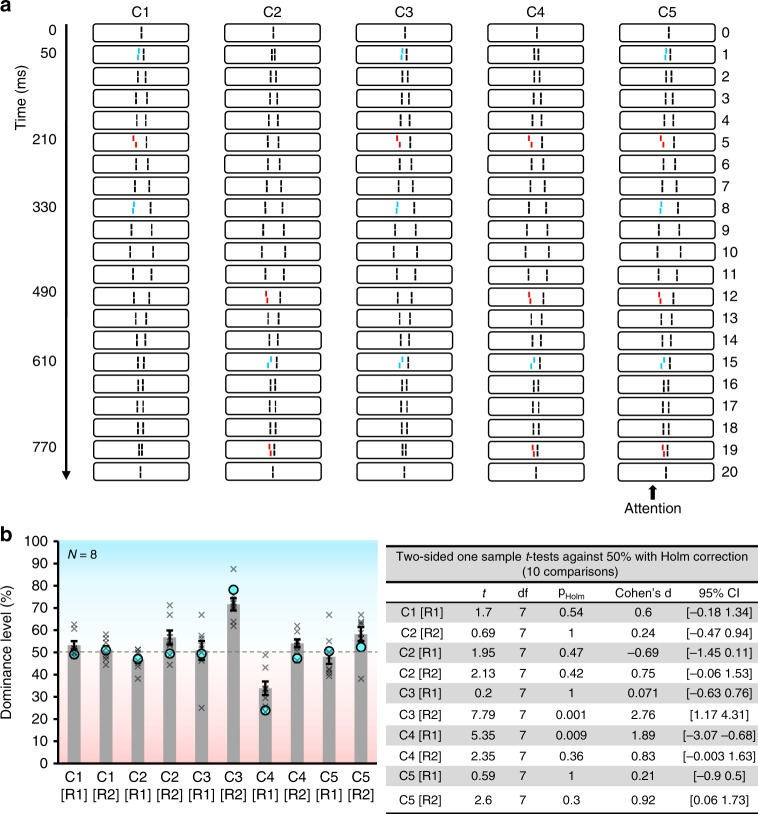
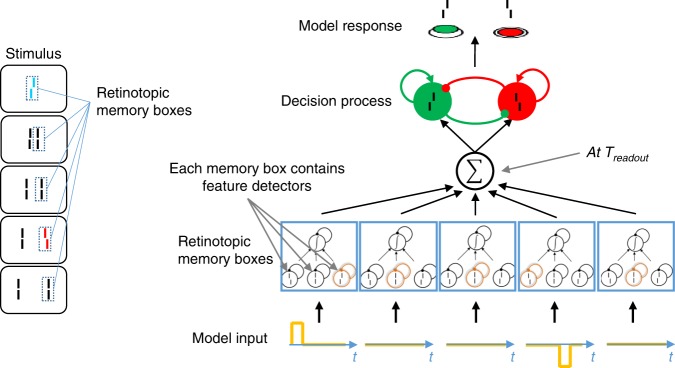
Sensory information must be integrated over time to perceive, for example, motion and melodies. Here, to study temporal integration, we used the sequential metacontrast paradigm in which two expanding streams of lines are presented. When a line in one stream is offset observers perceive all other lines to be offset too, even though they are straight. When more lines are offset the offsets integrate mandatorily, i.e., observers cannot report the individual offsets. We show that mandatory integration lasts for up to 450 ms, depending on the observer. Importantly, integration occurs only when offsets are presented within a discrete window of time. Even stimuli that are in close spatio-temporal proximity do not integrate if they are in different windows. A window of integration starts with stimulus onset and integration in the next window has similar characteristics. We present a two-stage computational model based on discrete time windows that captures these effects.


Conflict of interest statement

The authors declare no competing interests.

Figures

Fig. 1
Fig. 1
The Sequential Metacontrast paradigm (SQM). A central line is followed by pairs of flanking lines. Each line is presented for 20 ms, the inter-stimulus interval (ISI) is 20 ms (except the first ISI, which is 30 ms). A percept of two diverging streams is elicited. Observers attend to one of the streams (here, the right stream) and report the perceived offset direction (right/left) by pressing hand-held push-buttons. Condition V (vernier): only the central line is offset. The offset is visible at the following lines and observers report the offset direction. Condition AV (anti-vernier): only a flanking line is offset. The offset is visible in the attended stream. Condition V-AV (vernier-anti-vernier): the central line and one of the flanking lines are offset. The two offsets are in opposite directions and cancel each other. Observers cannot report the individual vernier offsets. Condition V-PV (vernier–pro-vernier): the central line and one of the flanking lines are offset. The two offsets are in the same direction and add up. Notation: For example, V-AV3 indicates that the central line and the flanking line in frame 3 are offset in opposite directions. The red and blue offset colors are for illustration purposes only. All elements were the same color (see Methods)
Fig. 2
Fig. 2
Results of experiment 1. a We presented the central vernier and, in addition, one flank vernier in frame 7, 11, or 14, respectively (290 ms, 450 ms, or 570 ms). Data is displayed as vernier dominance: the percentage of observers’ responses in accordance with the central vernier. A dominance level above 50% (blue part of the plot) indicates that the central vernier dominates performance; a dominance level below 50% (red part of the plot) indicates that the anti-vernier dominates performance. In the first part of the experiment, observers were naive (solid lines). In the second part of the experiment, they were informed about the paradigm and instructed to report the central vernier offset ([R1], dashed lines). Mandatory integration lasts up to 450 ms, depending on the observer. Performance of a two-stage model (see Fig. 5) is presented by empty circles. The experimental data is well predicted. Error bars represent s.e.m. b Performance when the anti-vernier was presented at 450 ms (frame 11) for each observer in the naive condition V-AV11 (filled disks) and the informed [R1] condition V-AV11 [R1] (hashed disks). About half of the observers were able to report the direction of the central offset only (V-AV11 [R1]; observers ES-MS), whereas integration was mandatory for the other participants (observers ZF-JE). Thus, different observers have different integration window durations. Source data are provided as a Source Data file
Fig. 3
Fig. 3
Experiments 2 and 3. a Experiment 2. A central vernier and an anti-vernier in frame 8 (330 ms) were presented before 450 ms. A pro-vernier was presented in frame 12 (490 ms), after 450 ms. b Results of experiment 2. In condition V-AV8 [R2], observers were not able to report the direction of the flank offset, suggesting mandatory integration. In condition V-AV12 [R2], observers were able to report the direction of the flank offset, suggesting that the flank offset did not integrate with the central vernier offset. We compare dominances in conditions V-AV8-PV12 [R1] and V-AV8-PV12 [R2] to V-AV8 [R2] and 100 − (V-AV12 [R2]), respectively, to test whether the addition of the third offset changed the integration. Observers were not able to report the direction of the central vernier in condition V-AV8-PV12 [R1], whereas they could report the direction of the pro-vernier in frame 12 (V-AV8-PV12 [R2]). We suggest that integration only occurs within discrete windows of integration. Even offsets that are in close spatio-temporal proximity do not integrate if they are in different windows. These results were well replicated by the model (see Fig. 5). Crosses indicate individual data. c Results of experiment 3. The flank verniers were in the same frames as in experiment 2, but there was no central vernier. When the flank verniers in frame 8 and 12 were in opposite directions, observers were able to report the individual offsets (PV8-AV12 [R1] and PV8-AV12 [R2]). Thus, the first window of integration seems to start with stimulus onset. These results are well replicated by the model (blue circles). Error bars represent s.e.m. Source data are provided as a Source Data file
Fig. 4
Fig. 4
Experiment 4. a In the diverging part of the sequence (frames 0 to 10), the two pro-verniers (blue offsets) together have the same dominance as the anti-vernier (red offset) alone (see methods). In the converging part of the sequence (frames 10 to 20), the two anti-verniers (red offsets) have together the same dominance as the pro-vernier (blue offset) alone. b Verniers presented together either before or after 450 ms integrated (C1, C2, C3[R1], C4[R2] and C5). Only verniers that were presented alone either before or after 450 ms can be reported individually (C3[R2] and C4[R1]). Model outputs (see Fig. 5) are represented by the blue circles. Crosses indicate individual data. Error bars represent s.e.m. Source data are provided as a Source Data file
Fig. 5
Fig. 5
Computational model. Left: At each retinal location there is a memory box, which is activated when a visual feature is presented at this location. Right: When a visual feature appears at a given location, the memory box opens and processes information about the corresponding visual feature, i.e., a vernier with either a right, a left, or an aligned offset. These feature detectors are modeled as leaky integrators. We represent pro-verniers as + 1, anti-verniers as −1, and aligned lines as 0. Once stimulation at this retinal location terminates, the memory box closes, buffering the integrated information. Thus, information about visual features at each location is preserved throughout the discrete integration window. This processing is “unconscious”. In this example, there are five memory boxes, and the input to each of them is shown at the bottom. At the end of a discrete time window (denoted Treadout), the content of the different memory boxes is combined, yielding the output of stage 1. In the present case, the attended stream of elements is perceived as a single moving object, so the outputs of all memory boxes are summed. Stage 2 receives the outputs of stage 1 and drives the decision. The task is to report vernier offset directions, which we implement using a biologically plausible decision making network proposed by Wong & Wang. Details of the discrete computational model are provided in the methods

References

    1. Otto TU, Oğmen H, Herzog MH. The flight path of the phoenix–the visible trace of invisible elements in human vision. J. Vis. 2006;6:1079–1086. doi: 10.1167/6.10.7. - DOI - PubMed
    1. Otto TU, Ogmen H, Herzog MH. Feature integration across space, time, and orientation. J. Exp. Psychol. Hum. Percept. Perform. 2009;35:1670–1686. doi: 10.1037/a0015798. - DOI - PMC - PubMed
    1. Breitmeyer, B. & Öğmen, H. Visual Masking: Time Slices Through Conscious and Unconscious Vision - Bruno Breitmeyer, Haluk Ogmen, Haluk Öğmen - Google Books. (Oxford University Press, 2006).
    1. Macknik SL, Livingstone MS. Neuronal correlates of visibility and invisibility in the primate visual system. Nat. Neurosci. 1998;1:144. doi: 10.1038/393. - DOI - PubMed
    1. Taylor MM, Creelman CD. J. Acoust. Soc. Am. 1967. PEST: Efficient Estimates on Probability Functions; pp. 782–787.

Publication types