. 2019 Oct 25;10(1):4876.
doi: 10.1038/s41467-019-12773-7.

Anomalous hydrogen evolution behavior in high-pH environment induced by locally generated hydronium ions

Affiliations

Anomalous hydrogen evolution behavior in high-pH environment induced by locally generated hydronium ions

Xuesi Wang et al. Nat Commun. .

Abstract

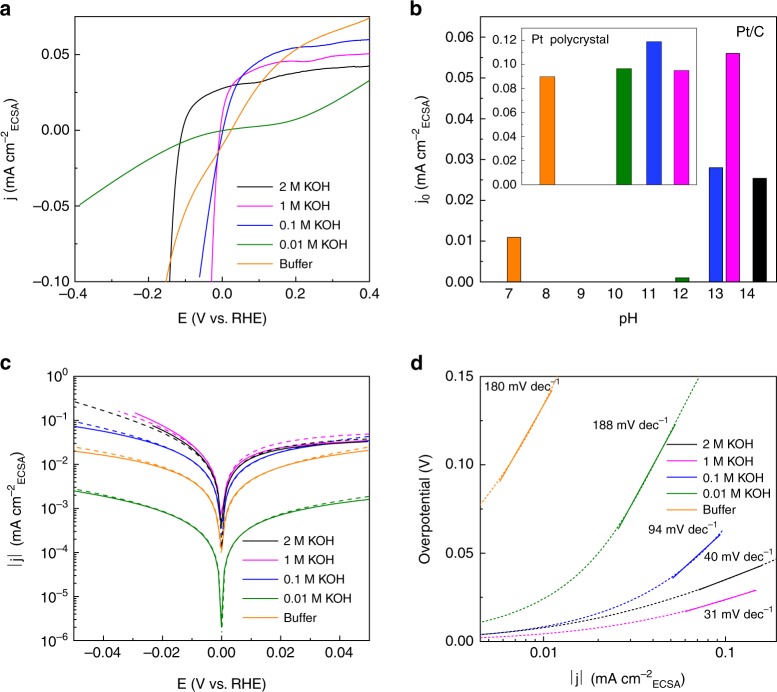
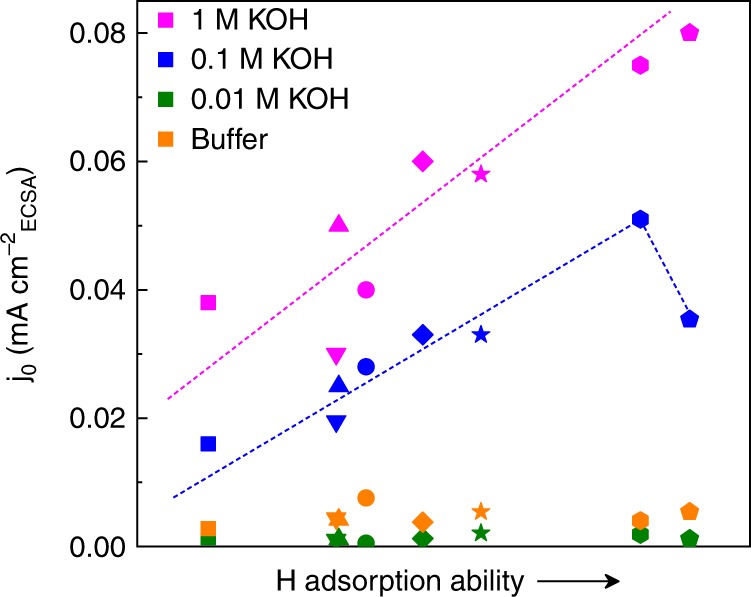
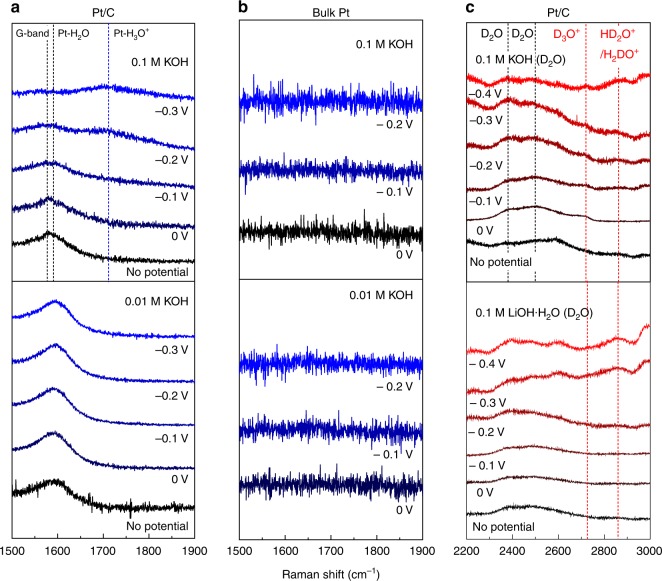
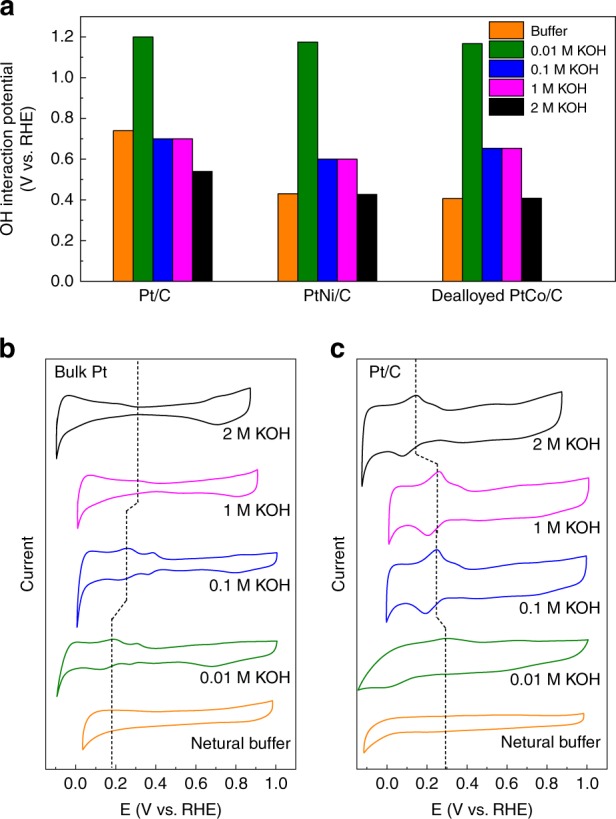
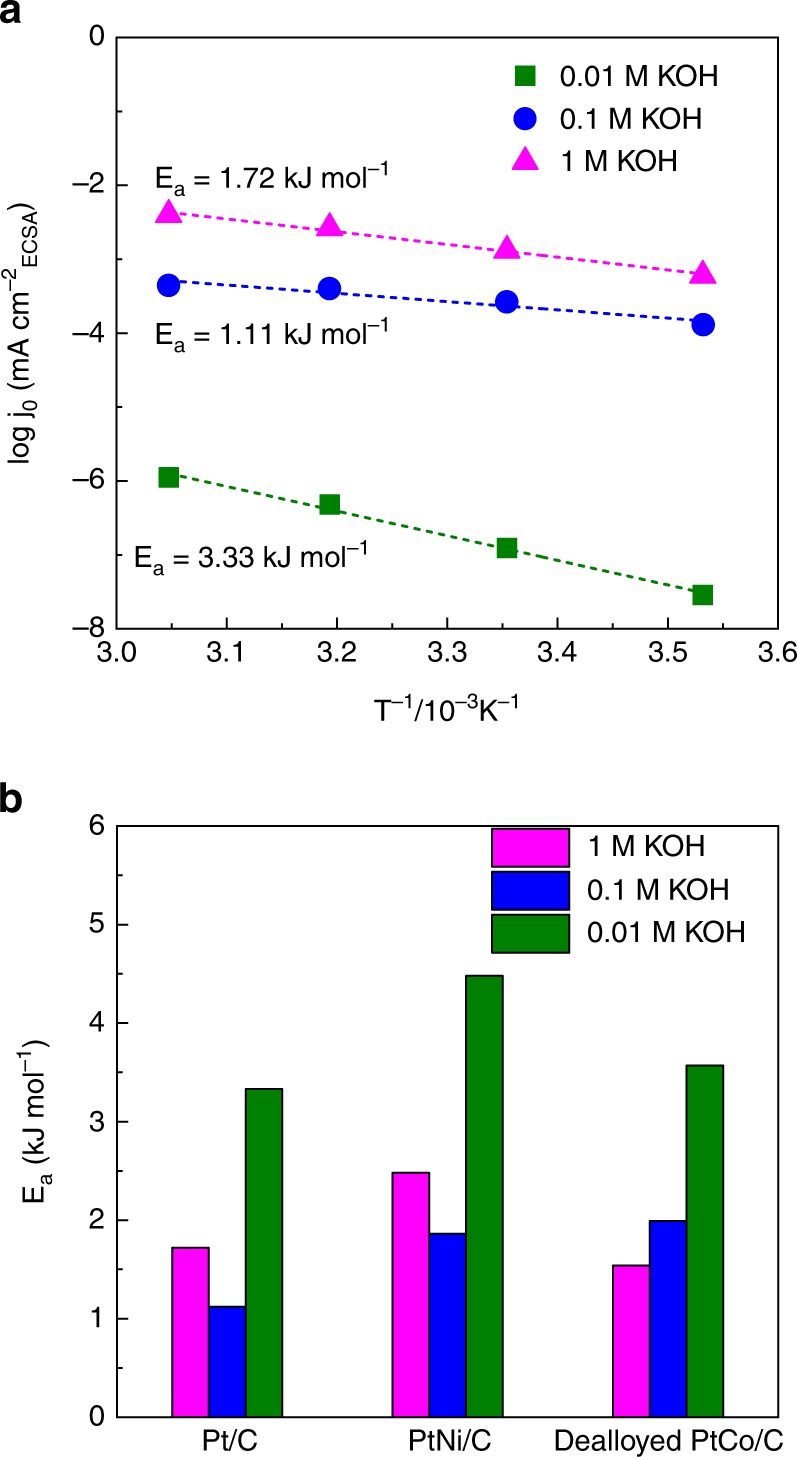
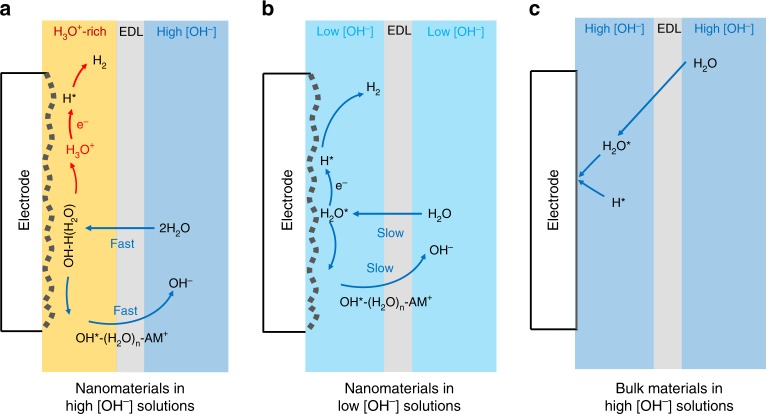
Most fundamental studies of electrocatalysis are based on the experimental and simulation results obtained for bulk model materials. Some of these mechanistic understandings are inapplicable for more active nanostructured electrocatalysts. Herein, considering the simplest and most typical electrocatalytic process, the hydrogen evolution reaction, an alternative reaction mechanism is proposed for nanomaterials based on the identification of a new intermediate, which differs from those commonly known for the bulk counterparts. In-situ Raman spectroscopy and electrochemical thermal/kinetic measurements were conducted on a series of nanomaterials under different conditions. In high-pH electrolytes with negligible hydronium (H3O+) concentration in bulk phase, massive H3O+ intermediates are found generating on the catalytic surface during water dissociation and hydrogen adsorption processes. These H3O+ intermediates create a unique acid-like local reaction environment on nanostructured catalytic surfaces and cut the energy barrier of the overall reaction. Such phenomena on nanostructured electrocatalysts explain their widely observed anomalously high activity under high-pH conditions.


Conflict of interest statement

The authors declare no competing interests.

Figures

Fig. 1
Fig. 1
HER activity comparison under different alkaline environments. a The HER polarization curves of Pt/C under different conditions. b The activity trend for Pt/C and polycrystal Pt (inset) under different conditions. The data for polycrystal Pt were taken from ref. . c Tafel plots and the corresponding Butler–Volmer fitting results for Pt/C under different conditions. d The Tafel slope for Pt/C under different conditions
Fig. 2
Fig. 2
The experimentally acquired relationship between the H adsorption ability and the activity (j0) for a series of Pt-based materials using different electrolytes. The symbols in the figure are circle: Pt/C; square: PtFe/C; standing triangle: PtCo@Pt/C; inverted triangle: PtCo/C; diamond: PtNi/C; star: PtFe@Pt/C; pentagon: dealloyed PtNi/C; hexagon: PtNi@Pt/C. The H adsorption ability of the electrocatalysts is represented according to the d-band vacancies of each material
Fig. 3
Fig. 3
Raman spectra of Pt/C and bulk Pt at various conditions. The Raman spectra for: a Pt/C and b bulk Pt in water-based alkaline environments. c Pt/C in deuterium water-based alkaline environments. The marked overpotential is in comparison to the onset potential of HER (e.g., −0.1 V is 0.1 V more negative to onset potential). The Raman signals on the surface of the catalyst are identified as: G-band of carbon: ~1580 cm−1; H2O: ~1600 cm−1; H3O+: ~1750 cm−1; D3O+: ~2720 cm−1; HD2O/H2DO+: ~2850 cm−1; D2O: ~2380 cm−1, ~2500 cm−1
Fig. 4
Fig. 4
The trends of H and OH interactions with different catalysts. a OH interaction potentials obtained for three catalysts in different electrolytes. Data obtained from CO stripping measurements. b, c CVs of bulk Pt and Pt/C in different electrolytes. The dotted line indicates the shifting trend of the Hupd peak
Fig. 5
Fig. 5
HER energy barrier for various nanostructured electrocatalysts. a The relationship between the temperature and the catalytic activity of Pt/C under certain temperature range (10–55 °C). b A comparison of the activation energy (Ea) for a series of different Pt-based nanostructured electrocatalysts in different alkaline environments
Fig. 6
Fig. 6
Schematic illustration of the water reduction mechanism on the nanostructured electrocatalysts. a Surface intermediates on the nanostructured electrocatalysts in solutions with high [OH]. b Surface intermediates on the nanostructured electrocatalysts in solutions with low [OH]. c Water reduction mechanism on the bulk electrocatalysts in high-pH environments. EDL electric double layer

References

    1. Deng J, Iñiguez JA, Liu C. Electrocatalytic nitrogen reduction at low temperature. Joule. 2018;2:846–856. doi: 10.1016/j.joule.2018.04.014. - DOI
    1. Yang X, et al. Mechanistic insights into electrochemical nitrogen reduction reaction on vanadium nitride nanoparticles. J. Am. Chem. Soc. 2018;140:13387–13391. doi: 10.1021/jacs.8b08379. - DOI - PubMed
    1. Guo C, Ran J, Vasileff A, Qiao S-Z. Rational design of electrocatalysts and photo (electro) catalysts for nitrogen reduction to ammonia (NH3) under ambient conditions. Energy Environ. Sci. 2018;11:45–56. doi: 10.1039/C7EE02220D. - DOI
    1. Vasileff A, Xu C, Jiao Y, Zheng Y, Qiao S-Z. Surface and interface engineering in copper-based bimetallic materials for selective CO2 electroreduction. Chem. 2018;4:1809–1831. doi: 10.1016/j.chempr.2018.05.001. - DOI
    1. Jiao Y, Zheng Y, Chen P, Jaroniec M, Qiao S-Z. Molecular scaffolding strategy with synergistic active centers to facilitate electrocatalytic CO2 reduction to hydrocarbon/alcohol. J. Am. Chem. Soc. 2017;139:18093–18100. doi: 10.1021/jacs.7b10817. - DOI - PubMed

Publication types