. 2019 Oct 25;10(1):4883.
doi: 10.1038/s41467-019-12816-z.

Regulation of the ER stress response by a mitochondrial microprotein

Affiliations

Regulation of the ER stress response by a mitochondrial microprotein

Qian Chu et al. Nat Commun. .

Abstract

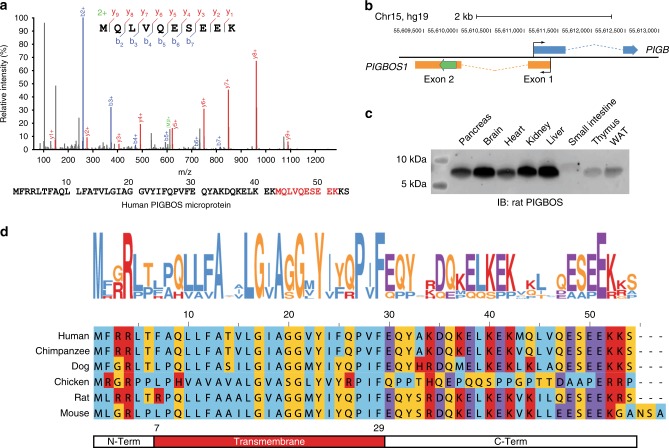
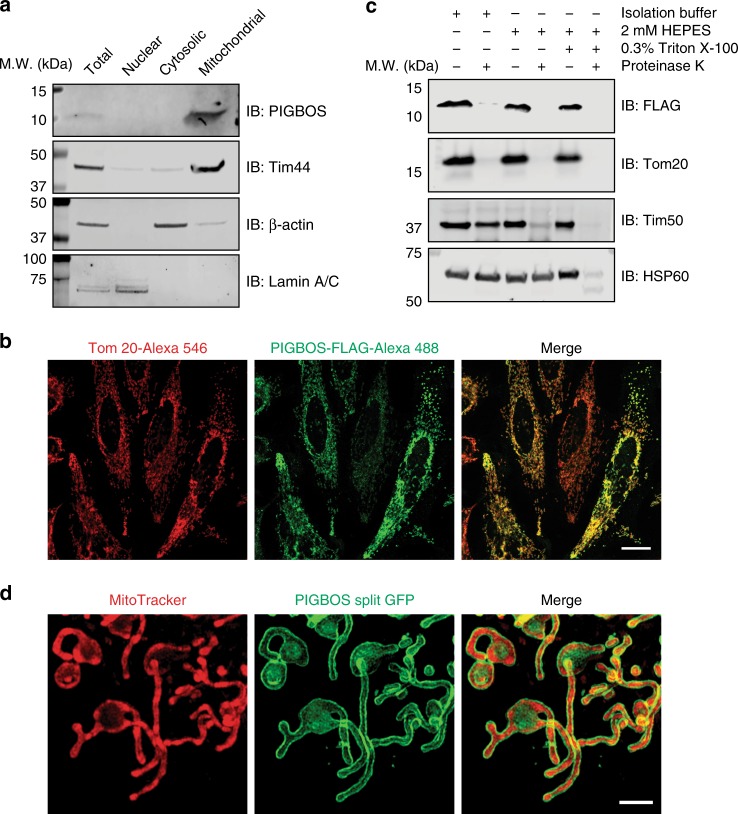
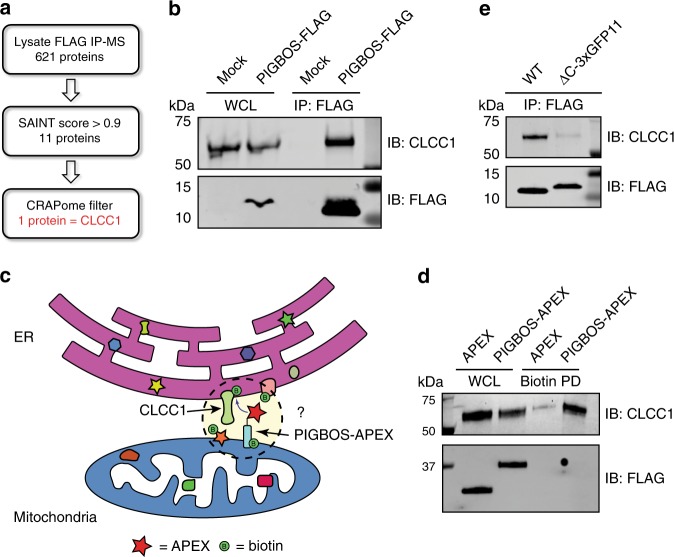
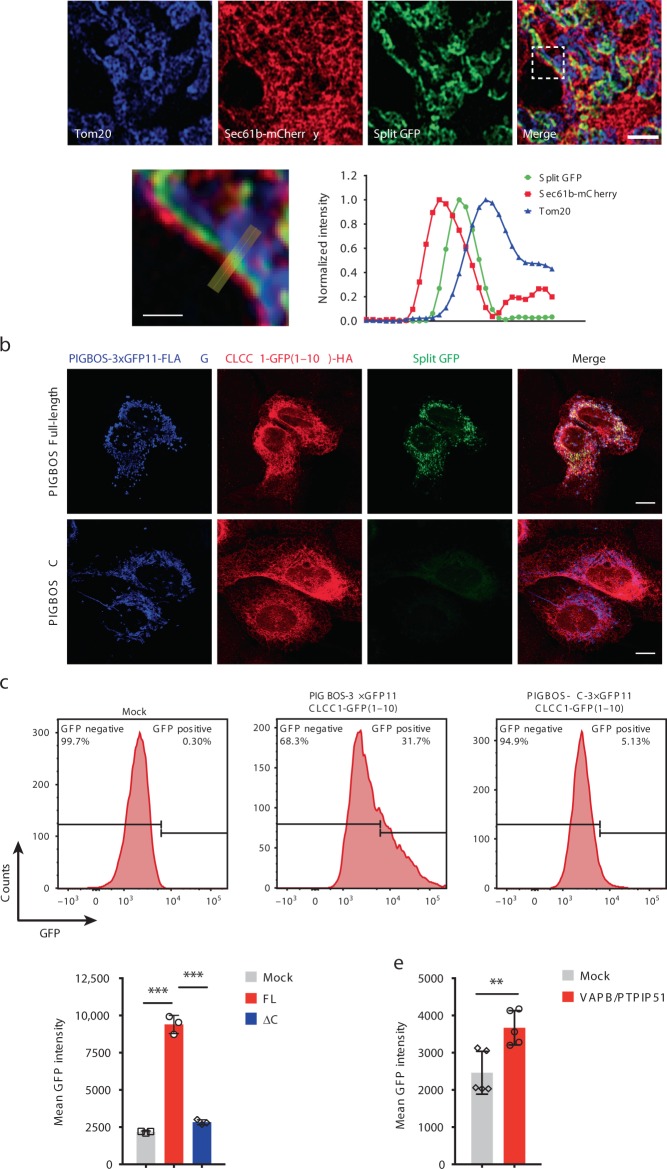
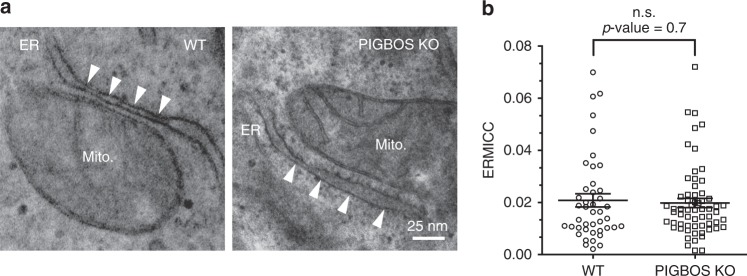
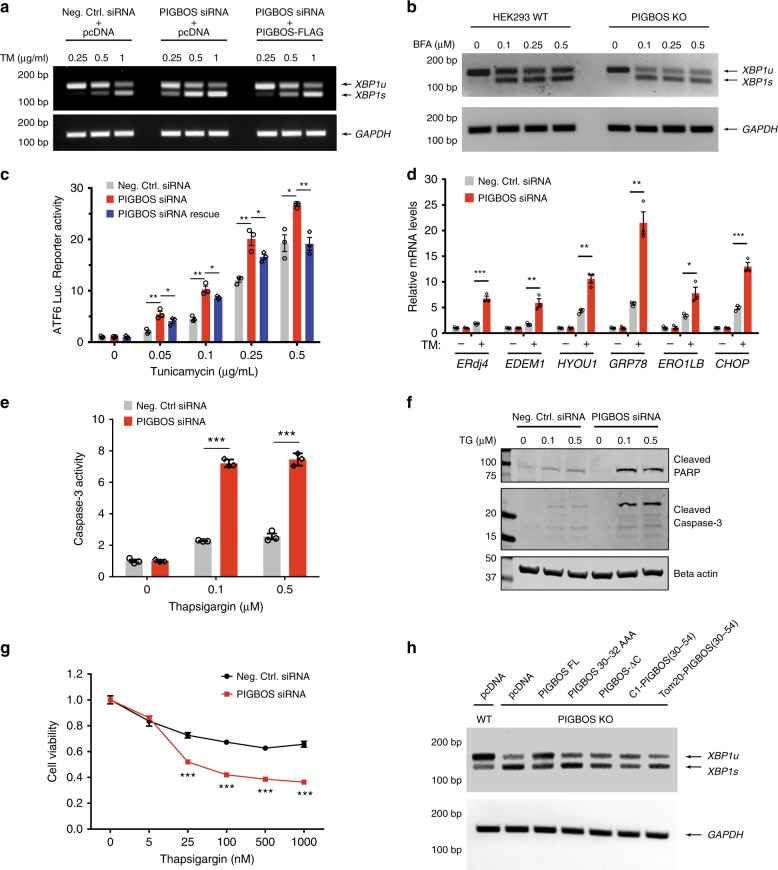
Cellular homeostasis relies on having dedicated and coordinated responses to a variety of stresses. The accumulation of unfolded proteins in the endoplasmic reticulum (ER) is a common stress that triggers a conserved pathway called the unfolded protein response (UPR) that mitigates damage, and dysregulation of UPR underlies several debilitating diseases. Here, we discover that a previously uncharacterized 54-amino acid microprotein PIGBOS regulates UPR. PIGBOS localizes to the mitochondrial outer membrane where it interacts with the ER protein CLCC1 at ER-mitochondria contact sites. Functional studies reveal that the loss of PIGBOS leads to heightened UPR and increased cell death. The characterization of PIGBOS reveals an undiscovered role for a mitochondrial protein, in this case a microprotein, in the regulation of UPR originating in the ER. This study demonstrates microproteins to be an unappreciated class of genes that are critical for inter-organelle communication, homeostasis, and cell survival.


Conflict of interest statement

The authors declare no competing interests.

Figures

Fig. 1
Fig. 1
PIGBOS is a conserved microprotein. a Detection of a unique PIGBOS tryptic peptide by proteomics (MS/MS spectrum as shown) and the entire 54 amino acid human PIGBOS microprotein with detected tryptic peptide (red). b PIGBOS1 gene contains two exons and is located on the opposite strand of the PIGB gene on chromosome 15. The PIGBOS protein coding sequence (CDS) in exon 2 is highlighted in green. c Western blot of rat tissues detects endogenous PIGBOS microprotein expression. d A logo plot generated from the sequence alignment of PIGBOS microprotein from multiple species reveals conserved amino acids including the transmembrane region between amino acids 7–29 (red) flanked by a N-terminal region (N-Term, aa 1–6) and a C-terminal region (C-Term, aa 30–54)
Fig. 2
Fig. 2
PIGBOS is localized on the mitochondrial outer membrane (MOM). a Western blot analysis of nuclear, cytosolic, and mitochondrial fractions from HEK293T cells identifies PIGBOS as a mitochondrial microprotein. b Immunofluorescence imaging of HeLa cells after transfection with PIGBOS-FLAG reveals colocalization of PIGBOS (green) with the mitochondrial marker Tom20 (red), validating PIGBOS’s mitochondrial localization. Scale bar: 20 µm. c Sub-mitochondrial localization using a protease protection assay reveals PIGBOS to be a mitochondrial outer membrane microprotein since proteinase K can access and degrade PIGBOS without any mitochondrial permeabilization. d Live cell imaging of COS-7 cells that were co-transfected with PIGBOS-3 × GFP11 and GFP (1–10) results in a green fluorescent ring around the mitochondria (MitoTracker Deep Red FM), consistent with PIGBOS localization to the MOM. Scale bar: 2.5 µm
Fig. 3
Fig. 3
PIGBOS interacts with the ER protein CLCC1. a Analysis of the PIGBOS-FLAG IP-MS to remove false positives and background proteins yielded CLCC1, an ER-resident protein, as a PIGBOS interacting protein. b Co-immunoprecipitation of PIGBOS-FLAG enriched CLCC1 from HEK293T total cell lysates. c A PIGBOS-APEX construct was used to proximity label the proteome and determine whether PIGBOS and CLCC1 are near each other in living cells. d Enrichment of CLCC1 in PIGBOS-APEX labeling proteome indicated that it was biotinylated and, therefore, in proximity to PIGBOS-APEX. e Replacement of the PIGBOS C-terminal region with 3 × GFP11 (PIGBOS-ΔC-3 × GFP11-FLAG) prevented enrichment of CLCC1
Fig. 4
Fig. 4
Validation of PIGBOS-CLCC1 interaction via split GFP bimolecular complementation. a (Top) Transfection of COS-7 cells with PIGBOS-3 × GFP11 and CLCC1-GFP(1-10) resulted in a GFP signal, which could only occur if the two proteins are close enough to interact and reconstitute a functional GFP. Scale bar: 2 µm. (Bottom) The region in the white box was enlarged, and a cross-sectional analysis of the normalized fluorescence distribution of the Tom20 (MOM), Sec61b (ER), and GFP signals places the GFP signal between the ER and MOM. Scale bar: 0.5 µm. b U2OS cells were co-transfected with CLCC1-GFP(1-10)-HA and PIGBOS-3 × GFP11-FLAG (or PIGBOS-ΔC-3 × GFP11-FLAG). Forty-eight hours later, cells were fixed and stained with FLAG and HA antibodies overnight before imaging. Scale bar: 10 µm. c Flow cytometry measurement of PIGBOS-CLCC1 interaction in HEK293T cells. HEK293T cells were co-transfected with CLCC1-GFP(1-10)-HA and PIGBOS-3 × GFP11-FLAG (or PIGBOS-ΔC-3 × GFP11-FLAG). GFP signals were assessed by flow cytometry 72 hours after transfection. d Quantification of mean GFP intensity in (c). Error bars, s.d., ***p < 0.001 (two tailed unpaired t-test), n = 3 independent experiments. e Flow cytometry measurement of reconstituted PIGBOS-CLCC1 split GFP intensity in HEK293T cells expressing a known ER-mitochondrial tether, VAPB/PTPIP51. Error bars, s.d., **p < 0.01 (two tailed unpaired t-test), n = 5 independent experiments. Source data for Fig. 4a, d and e are provided as a Source Data file
Fig. 5
Fig. 5
PIGBOS shows no effect on modulation of ER-mitochondria contacts. a Representative transmission electron microscopy images from WT and PIGBOS-KO U2OS cells showed no remarkable differences in ER-mitochondria contacts. ER and mitochondria contact sites are indicated by white arrows. b Quantitation of the normalized ER-mitochondria contact coefficient (ERMICC) did not identify a significant difference between ERMICC of WT vs. PIGBOS-KO U2OS cells. Data are collected from two independent experiments and pooled from 43 WT mitochondria (eight cells), and 62 PIGBOS-KO mitochondria (seven cells) and the bar graph is the ERMICC ± s.e.m. with the p-value calculated using two tailed unpaired t-test with all data points included in the calculation. Source data for Fig. 5b are provided as a Source Data file
Fig. 6
Fig. 6
PIGBOS regulates the amplitude of UPR, and apoptosis. a PIGBOS-KD and control HEK293 cells were treated with indicated concentrations of tunicamycin (TM) followed by RT-PCR analysis of XBP-1 splicing (unspliced XBP1 (XBP1u) and spliced XBP1 (XBP1s)). GAPDH was used as a loading control. A stronger UPR correlate with higher XBP1s/XBP1u ratio in PIGBOS-KD cells, which could be rescued by expression of a siRNA-resistant PIGBOS-FLAG. b XBP-1 mRNA splicing was measured in PIGBOS-KO and control HEK293 cells treated with indicated doses of brefeldin A (BFA) for 3 h. c ATF6-dependent luciferase reporter measures the activation of another branch of the UPR pathway. PIGBOS-KD led to increased luciferase activity indicative of a greater UPR, and the expression of the siRNA-resistant PIGBOS-FLAG reversed this effect. d RT-qPCR quantitation of a panel of UPR target genes in PIGBOS-KD and control HEK293 cells after an 8-hour treatment with vehicle or 1 μg/ml of TM. e Caspase-3 activity in mock and PIGBOS-KD U2OS cells treated with thapsigargin (TG) for 27 h. f Cleaved PARP and caspase-3 levels were measured by Western blot in PIGBOS-KD and control U2OS cells treated with TG for 27 h. g PIGBOS-KD and control U2OS cells were treated with indicated doses of TG for 48 h followed by cell viability measurements using MTT. h HEK293 PIGBOS-KO and WT cells were transfected with PIGBOS variants constructs as indicated. Forty-eight hours later, cells were incubated with 1 µg/ml of tunicamycin for 3 h. XBP1 splicing activity was measured by RT-PCR. Error bars, s.e.m. The p-values were calculated using two tailed unpaired t-test. *p < 0.05, **p < 0.01, ***p < 0.001, n = 3 experiments. Source data for Fig. 6c–e and 6g are provided as a Source Data file

References

    1. Saghatelian A, Couso JP. Discovery and characterization of smORF-encoded bioactive polypeptides. Nat. Chem. Biol. 2015;11:909–916. doi: 10.1038/nchembio.1964. - DOI - PMC - PubMed
    1. Couso JP, Patraquim P. Classification and function of small open reading frames. Nat. Rev. Mol. Cell Biol. 2017;18:575–589. doi: 10.1038/nrm.2017.58. - DOI - PubMed
    1. Starck SR, et al. Translation from the 5′ untranslated region shapes the integrated stress response. Science. 2016;351:aad3867. doi: 10.1126/science.aad3867. - DOI - PMC - PubMed
    1. Slavoff SA, et al. Peptidomic discovery of short open reading frame-encoded peptides in human cells. Nat. Chem. Biol. 2013;9:59–64. doi: 10.1038/nchembio.1120. - DOI - PMC - PubMed
    1. Bazzini AA, et al. Identification of small ORFs in vertebrates using ribosome footprinting and evolutionary conservation. EMBO J. 2014;33:981–993. doi: 10.1002/embj.201488411. - DOI - PMC - PubMed

Publication types