

doi: 10.1038/s41467-019-12924-w.
Biological process activity transformation of single cell gene expression for cross-species alignment
Affiliations
- PMID: 31653878
- PMCID: PMC6814736
- DOI: 10.1038/s41467-019-12924-w
Item in Clipboard
Biological process activity transformation of single cell gene expression for cross-species alignment
Nat Commun.
.
Abstract
The maintenance and transition of cellular states are controlled by biological processes. Here we present a gene set-based transformation of single cell RNA-Seq data into biological process activities that provides a robust description of cellular states. Moreover, as these activities represent species-independent descriptors, they facilitate the alignment of single cell states across different organisms.
Conflict of interest statement
The authors declare no competing interests.
Figures

Overview of BPA and performance on single-cell data sets. a Overview of biological process activity inference. Single=cell gene expression profiles for human (outer left column) can be compared with a mouse gene expression profile (outer right column) using transformed biological process activity profiles for human (inner left) and mouse (inner right) even though the gene members of each Gene Ontology Biological Process (GO-BP) are distinct in each species (outer links). b Single peripheral blood mononuclear cells (PBMCs) profiled using 10x Genomics V1 and V2 chemistry were visualized using transcript expression features. Cells were color-coded according to expression of B-cell, monocyte and T-cell-specific markers CD3E, CD14, and CD20, respectively. Two clusters for each cell type, corresponding to each of the Chromium chemistries are visible before the BPA transform. c Same as part B but PBMC data plotted after applying the BPA transform resulting in one cluster per cell type and no visible chemistry batch effect. d Drop-out events (Dro) were simulated into GTEx lung (L), and esophagus (E) bulk RNA-sequencing (Ori) data (Supplementary Fig. 2, see Methods); pairwise correlations between samples was computed and plotted, resulting from comparisons using the original gene expression features (upper matrix triangle) and using BPA features (lower matrix triangle); high correlations, red; low correlations, yellow. BPA preserves same tissue comparisons even for drop-outs and has lower on average cross-tissue correlation than using gene expression features. e BPA transform preserves the developmental order of embryo development of the original study based on the pseudotime inferred from principal curve construction in t-SNE space (Supplementary Fig. 4)
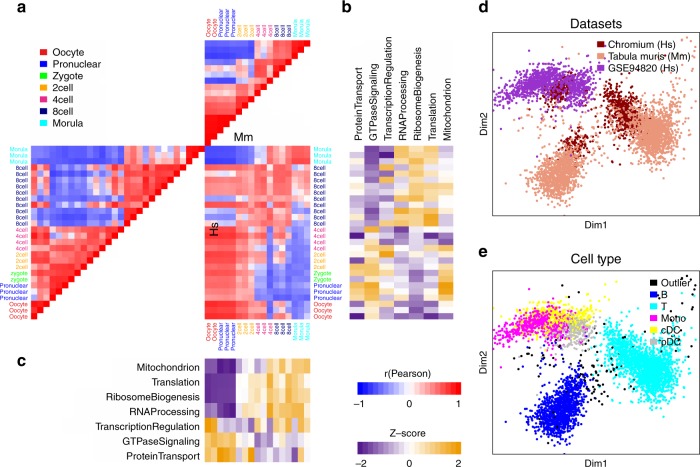
BPA-based human–mouse integrative analysis. a Human and mouse early embryo single cells were taken from ref. . Pairwise correlation of cells shown as a heatmap; high, red; low, blue. b Inferred activity of biological processes described in the original study for the mouse data set; high activities, yellow; low activities, purple. c Same as in b but for the human data set. d Multidimensional scaling (MDS) view of the cross-species BPA-integrated immune cell studies from human and mouse including two human studies—Chromium, brown; and GSE94820, purple—and one mouse study—Tabula Muris, peach. e Same data as in d showing the MDS view of the distinct immune cell types (colors) showing how cell types (e.g. T-cells, light blue) from both species cluster near one another
