. 2019 Oct 25;9(1):15312.
doi: 10.1038/s41598-019-51750-4.

Effect of natural ageing and heat treatments on GII.4 norovirus binding to Histo-Blood Group Antigens

Affiliations

Effect of natural ageing and heat treatments on GII.4 norovirus binding to Histo-Blood Group Antigens

Maëlle Robin et al. Sci Rep. .

Abstract

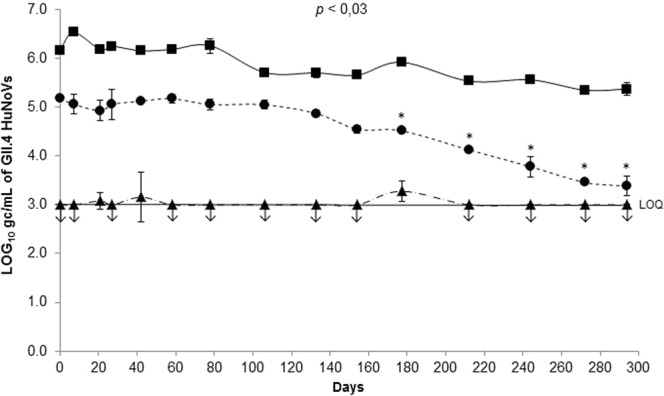
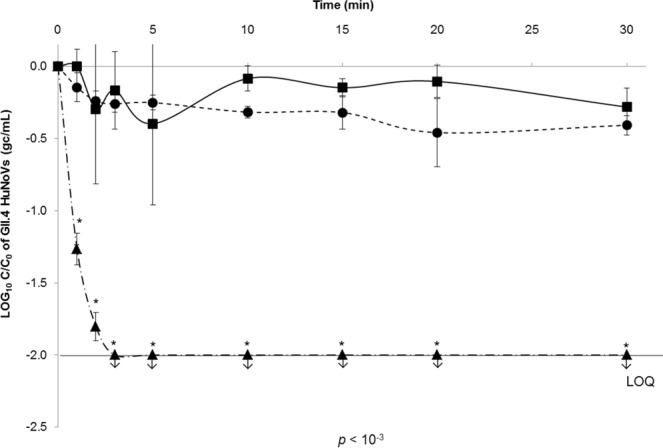
Human noroviruses (HuNoVs) are the leading cause of viral foodborne outbreaks worldwide. To date, no available methods can be routinely used to detect infectious HuNoVs in foodstuffs. HuNoVs recognize Histo-Blood Group Antigens (HBGAs) through the binding pocket (BP) of capsid protein VP1, which promotes infection in the host cell. In this context, the suitability of human HBGA-binding assays to evaluate the BP integrity of HuNoVs was studied on GII.4 virus-like particles (VLPs) and GII.4 HuNoVs during natural ageing at 20 °C and heat treatments. Our results demonstrate that this approach may reduce the over-estimation of potential infectious HuNoVs resulting from solely using the genome detection, even though some limitations have been identified. The specificity of HBGA-binding to the BP is clearly dependent on the HGBA type (as previously evidenced) and the ionic strength of the media without disturbing such interactions. This study also provides new arguments regarding the ability of VLPs to mimic HuNoV behavior during inactivation treatments. The BP stability of VLPs was at least 4.3 fold lower than that of HuNoVs at 20 °C, whereas capsids of both particles were disrupted at 72 °C. Thus, VLPs are relevant surrogates of HuNoVs for inactivation treatments inducing significant changes in the capsid structure.


Conflict of interest statement

The authors declare no competing interests.

Figures

Figure 1
Figure 1
GII.4 VLP binding to OLe+ saliva after exposure to natural ageing at 20 °C under low (10 mM PBS) and high (150 mM PBS) ionic strength conditions. The OD450 values of purified GII.4 VLPs were obtained by HBGA-binding ELISA in 10 mM solution (solid line) and 150 mM PBS solution (dashed line). Squares (▪) and circles (•) represent the VLP binding to untreated and sodium periodate-treated OLe+ human saliva, respectively. Each data point represents the mean OD450 values of four replicates and error bars indicate standard deviations. Paired and unpaired Student’s t-test was used to compare groups.
Figure 2
Figure 2
Decay of GII.4 VLP binding to OLe+ saliva after exposure to natural ageing at 20 °C under low and high ionic strength conditions. The solid and dashed lines represent purified GII.4 VLP binding to untreated saliva under low (10 mM PBS) and high (150 mM PBS) ionic strength conditions, respectively. The ODt/OD0 ratio was determined by dividing the mean OD450 values obtained by HBGA-binding ELISA at each time point (ODt) by the mean OD450 values obtained at day 0 (OD0). Each data point represents the mean OD450 values of four replicates and error bars indicate standard deviations. Unpaired Student’s t-test was used to compare the two groups.
Figure 3
Figure 3
Decay of GII.4 VLP binding to OLe+ saliva after exposure to heat treatments under high ionic strength condition (150 mM PBS). Squares (▪, solid line), circles (•, dotted line), and triangles (▲, dot-and-dash line) represent purified GII.4 VLP binding to untreated OLe+ human saliva after heating at 50 °C, 60 °C, and 72 °C for 30 min, respectively. The log (ODt/OD0) values were determined by dividing the mean OD450 values obtained by HBGA-binding ELISA at each time point (ODt) by the mean OD450 values obtained at time 0 (OD0). Each data point corresponds to the mean OD450 values of triplicates and error bars indicate standard deviations. Paired and unpaired Student’s t-test was used to compare groups.
Figure 4
Figure 4
TEM observations of native and heat-treated GII.4 VLP capsids after negative staining. (a) Native GII.4 VLPs, (b) GII.4 VLPs after exposure at 50 °C for 10 min, and (c) GII.4 VLPs after exposure at 60 °C for 10 min. No GII.4 VLP was observed by TEM after heating at 72 °C for 10 min. The scale bar is at the bottom left of each picture.
Figure 5
Figure 5
Persistence of GII.4 HuNoV genomes and GII.4 HuNoV binding to OLe+ saliva after exposure to natural ageing at 20 °C under low ionic strength condition (10 mM PBS). Quantification of purified GII.4 HuNoV gc was obtained by HBGA-binding assays followed by RNA amplification by RT-qPCR. Squares (▪, solid line) represent GII.4 HuNoV gc/mL treated with RNase. Circles (•, dotted line) and triangles (▲, dot-and-dash line) represent GII.4 HuNoV gc/mL quantified after capsid binding to untreated and sodium periodate-treated OLe+ human saliva, respectively. Each data point is an average of two replicates and error bars indicate standard deviations. Arrows (↓) represent data below the LOQ but above the LOD. The LOD and LOQ were respectively 200 and 1,000 gc/mL of purified GII.4 HuNoVs. Paired Student’s t-test was used to compare groups.
Figure 6
Figure 6
Decay of GII.4 HuNoV binding to OLe+ saliva after exposure to heat treatments under high ionic strength condition (150 mM PBS). Squares (▪, solid line), circles (•, dotted line), and triangles (▲, dot-and-dash line) represent purified GII.4 HuNoV binding to untreated OLe+ human saliva after heating at 50 °C, 60 °C, and 72 °C for 30 min, respectively. The log (C/C0) values were calculated by dividing the mean GII.4 HuNoV gc/mL values obtained by HBGA-binding assays followed by RNA amplification by RT-qPCR at each time point (Ct) by the mean GII.4 HuNoV gc/mL values obtained at time 0 (C0). Each data point is an average of three replicates and error bars indicate standard deviations. Arrows (↓) represent data below the LOQ but above the LOD. The LOD and LOQ were 200 and 1,000 gc/mL of purified GII.4 HuNoVs, respectively. Paired Student’s t-test was used to compare groups.

References

    1. European Food Safety Authority (EFSA). The European Union summary report on trends and sources of zoonoses, zoonotic agents and food‐borne outbreaks in 2017. EFSA J. 16 (2018). - PMC - PubMed
    1. CDC. https://www.cdc.gov/norovirus/trends-outbreaks/index.html (2018).
    1. Zheng D-P, et al. Norovirus classification and proposed strain nomenclature. Virology. 2006;346:312–323. doi: 10.1016/j.virol.2005.11.015. - DOI - PubMed
    1. van Beek J, et al. Molecular surveillance of norovirus, 2005–16: an epidemiological analysis of data collected from the NoroNet network. Lancet Infect. Dis. 2018;18:545–553. doi: 10.1016/S1473-3099(18)30059-8. - DOI - PubMed
    1. Atmar RL, et al. Norwalk virus shedding after experimental human infection. Emerg. Infect. Dis. 2008;14:1553–1557. doi: 10.3201/eid1410.080117. - DOI - PMC - PubMed

Publication types

Substances